. 2024 Nov;16(11):2749-2774.
doi: 10.1038/s44321-024-00142-x. Epub 2024 Oct 21.

Breast cancer secretes anti-ferroptotic MUFAs and depends on selenoprotein synthesis for metastasis

Affiliations

Breast cancer secretes anti-ferroptotic MUFAs and depends on selenoprotein synthesis for metastasis

Tobias Ackermann et al. EMBO Mol Med. 2024 Nov.

Abstract

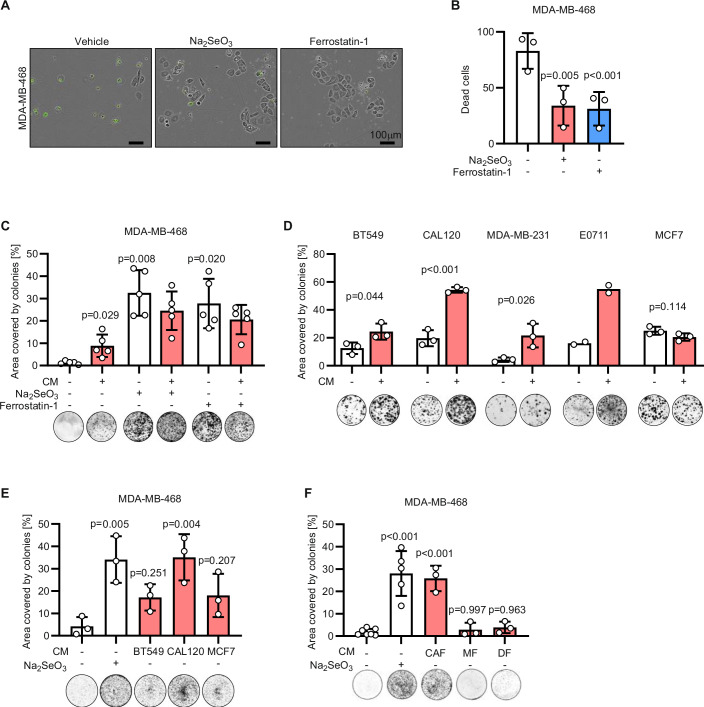
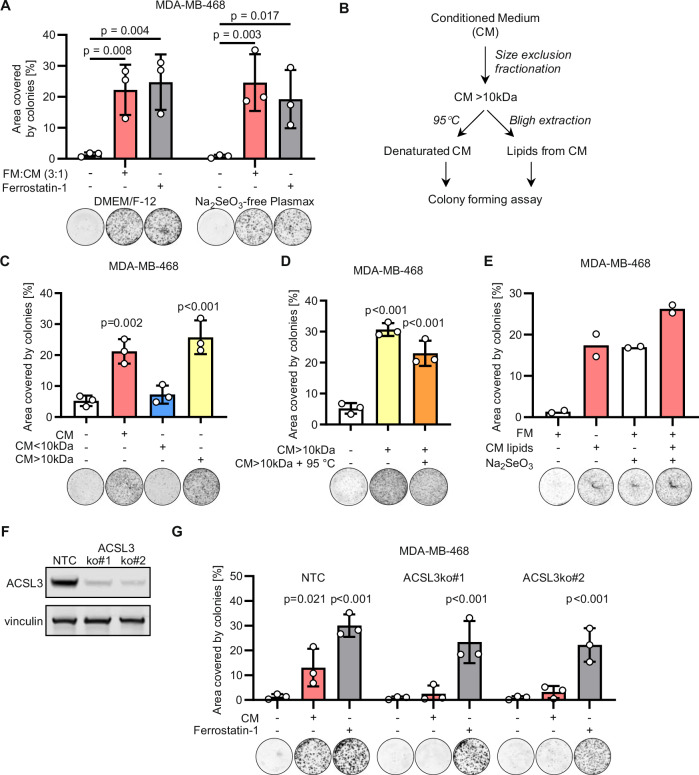
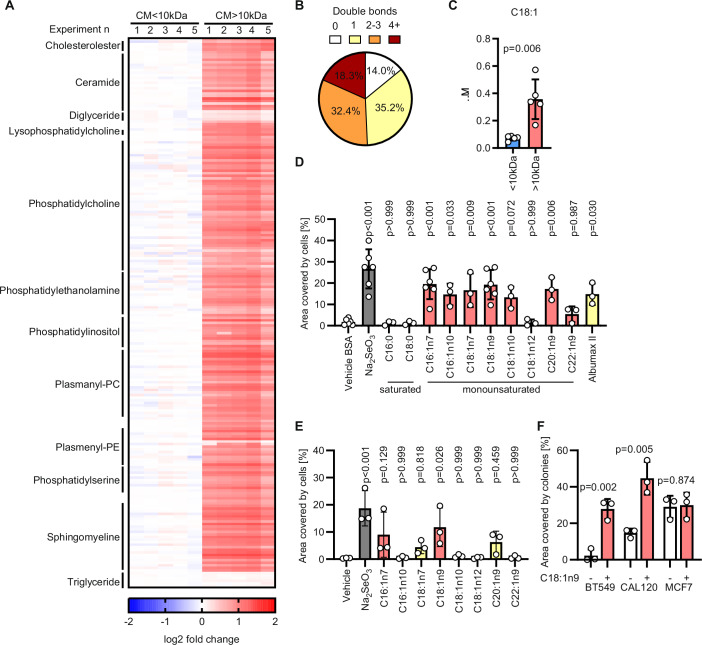
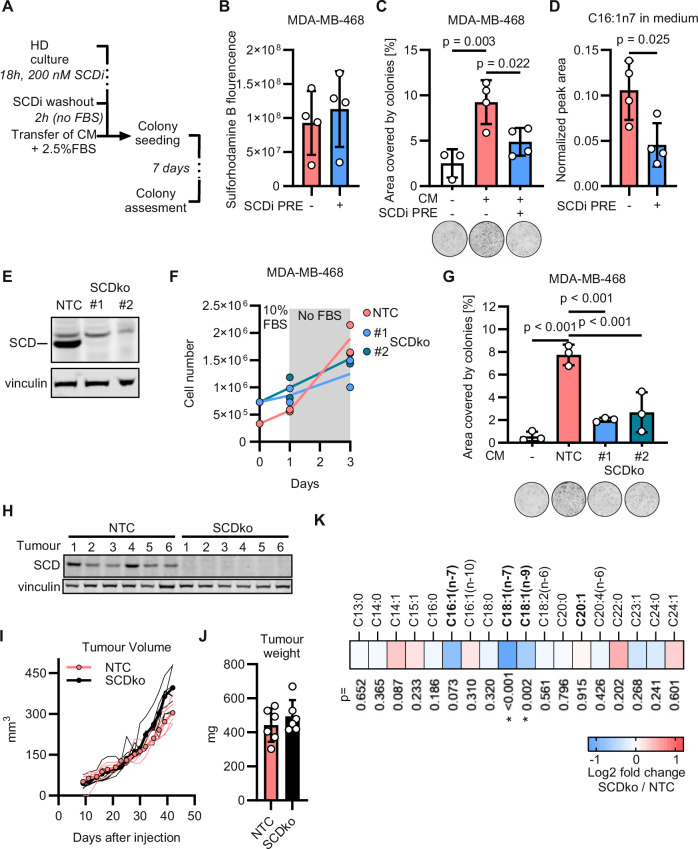
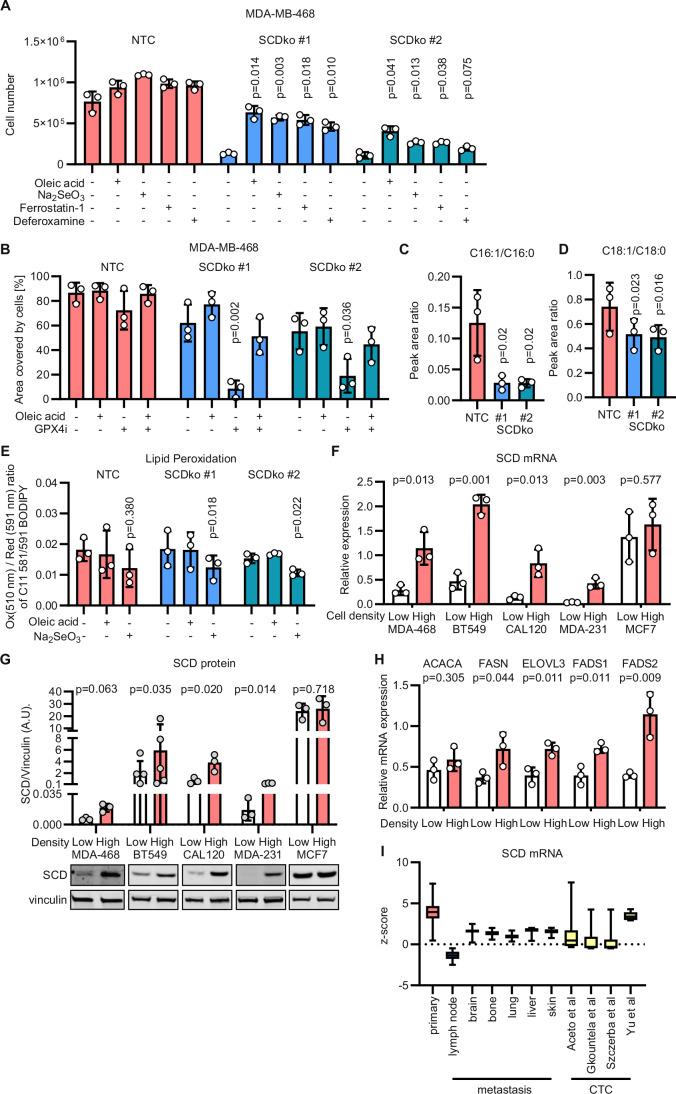
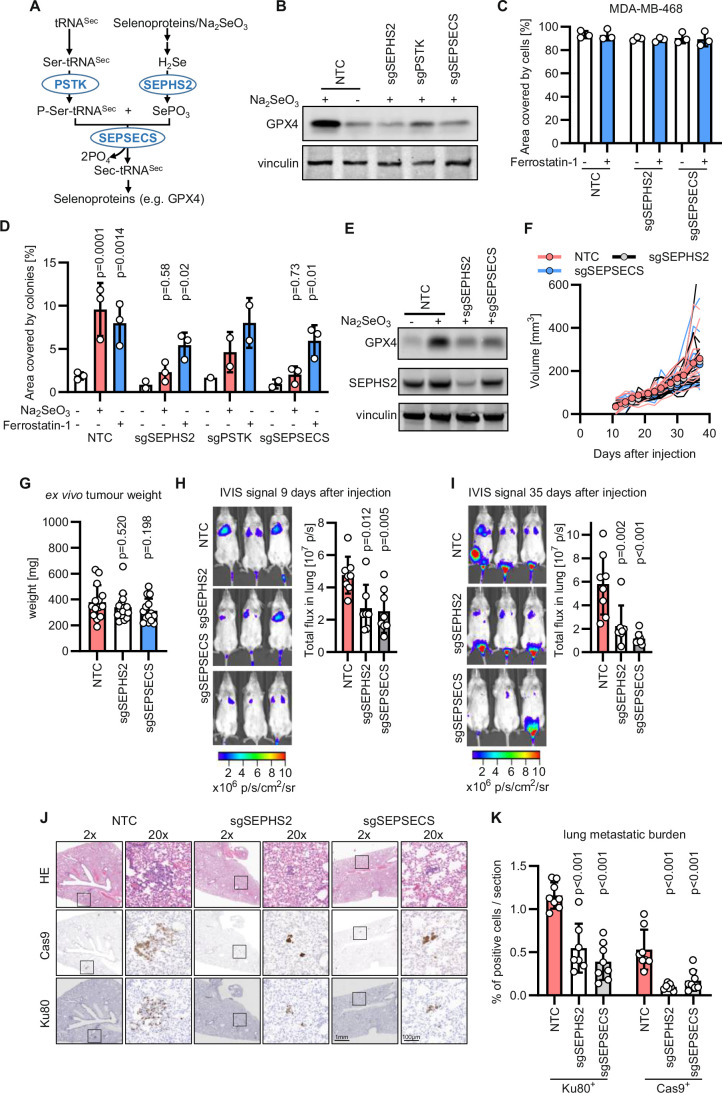
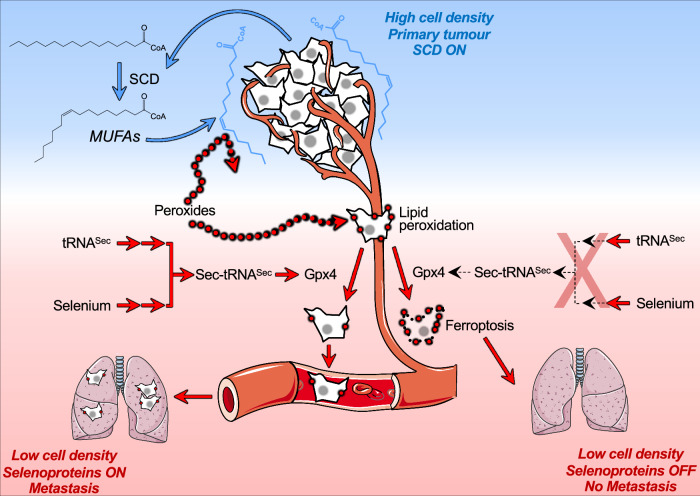
The limited availability of therapeutic options for patients with triple-negative breast cancer (TNBC) contributes to the high rate of metastatic recurrence and poor prognosis. Ferroptosis is a type of cell death caused by iron-dependent lipid peroxidation and counteracted by the antioxidant activity of the selenoprotein GPX4. Here, we show that TNBC cells secrete an anti-ferroptotic factor in the extracellular environment when cultured at high cell densities but are primed to ferroptosis when forming colonies at low density. We found that secretion of the anti-ferroptotic factors, identified as monounsaturated fatty acid (MUFA) containing lipids, and the vulnerability to ferroptosis of single cells depends on the low expression of stearyl-CoA desaturase (SCD) that is proportional to cell density. Finally, we show that the inhibition of Sec-tRNAsec biosynthesis, an essential step for selenoprotein production, causes ferroptosis and impairs the lung seeding of circulating TNBC cells that are no longer protected by the MUFA-rich environment of the primary tumour.

Keywords: Breast Cancer; Ferroptosis; Lipid Metabolism; Metastasis; Selenium Metabolism.


Conflict of interest statement

Disclosure and competing interests statement ST is the inventor of PlasmaxTM cell culture medium. The remaining authors declare no competing interests.

Figures

Figure 1
Figure 1. Medium conditioned by breast cancer cells and cancer-associated fibroblasts enhances the clonogenicity of TNBC cells.
(A) Representative images of MDA-MB-468 cells seeded at low density and incubated for 96 h with 50 nM Na2SeO3 or 2 µM Ferrostain-1 as indicated. Phase contrast and fluorescence images were overlayed and dead cells were identified by green fluorescence emitted by the Incucyte® Cytotox Green Dye. (B) Quantification of the dead cells stained with the green fluorescent dye in the conditions described in (A). P values refer to a one-way ANOVA test for paired samples with Geisser–Greenhouse correction. (C) Well area covered by colonies formed by MDA-MB-468 cells incubated for 7 days with mock medium or medium conditioned by MDA-MB-468 cells seeded at high density (CM). Media used for the colony-forming assay were supplemented with 50 nM Na2SeO3 or 2 µM Ferrostain-1 as indicated. P values refer to a two-way ANOVA test for unpaired samples with Dunnett’s multiple comparisons test. (D) Well area covered by colonies formed by the indicated cell lines incubated for 7 days with mock medium or medium conditioned by BT549, CAL120, MDA-MB-231, EO771 and MCF7 cells seeded at high density. Conditioned medium was used on the respective cell line. P values refer to a two-tailed, homoscedastic Student’s t tests for unpaired samples. (E) Well area covered by colonies formed by MDA-MB-468 incubated for 7 days with mock medium or medium conditioned by BT549, CAL120 or MCF7 cells seeded at high density. Media used for the colony-forming assay were supplemented with 50 nM Na2SeO3 as indicated. P values refer to a one-way ANOVA test for unpaired samples with Dunnett’s multiple comparisons test. (F) Well area covered by colonies formed by MDA-MB-468 incubated for 7 days with mock medium or medium conditioned by cancer-associated fibroblasts (CAF), immortalised mammary fibroblasts (MF), or immortalised human dermal fibroblasts (DF) seeded at high density. Media used for the colony-forming assay were supplemented with 50 nM Na2SeO3 as indicated. P values refer to a one-way ANOVA test for unpaired samples with Dunnett’s multiple comparisons test. (CF) Representative images of wells with colonies are shown for each experimental condition. (BF) nexp = 2–7 as indicated by the data points in each panel. Bars that represent mean ± s.d. are shown. Source data are available online for this figure.
Figure 2
Figure 2. Breast cancer cells produce an anti-ferroptotic molecule at high density.
(A) Well area covered by colonies formed by MDA-MB-468 incubated for 7 days with fresh medium (FM) without or with supplementation of 2 µM ferrostatin-1, or with FM mixed 3:1 with medium conditioned by MDA-MB-468 cells seeded at high density (CM). Experiments were performed in DMEM/F-12 or Na2SO3-free Plasmax™. P values refer to a two-way ANOVA test for unpaired samples with Dunnett’s multiple comparisons test. (B) Schematic diagram of the analytical procedures applied to CM to identify the factor rescuing colony formation. (C, D) Well area covered by colonies formed by MDA-MB-468 incubated for 7 days with CM or with medium supplemented with the fractions separated by a size exclusion column as described in “Methods” section (C), and further incubated for 15 min at 95 °C (D). P values refer to a one-way ANOVA test for unpaired samples with Dunnett’s multiple comparisons test. (E) Well area covered by colonies formed by MDA-MB-468 incubated for 7 days with fresh medium (FM) supplemented with lipidic extracts obtained from the conditioned medium (CM) as shown in (B). (F) Immunoblot of ACSL3 and vinculin (loading control) in NTC and two ACSL3 ko clones obtained from MDA-MB-468 cells. (G) Well area covered by colonies formed by MDA-MB-468 control (NTC) or ACSL3 ko cells incubated for 7 days with fresh medium, conditioned medium (CM) or fresh medium supplemented with 2 µM ferrostatin-1 as indicated. P values refer to a two-way ANOVA test for paired samples with Sidak’s multiple comparisons test. (A, CE, G) Representative images of wells with colonies are shown for each experimental condition. nexp = 2–3 as indicated by the data points in each panel. Bars that represent mean ± s.d. are shown. Source data are available online for this figure.
Figure 3
Figure 3. Monounsaturated fatty acids are enriched in the conditioned medium and prevent ferroptosis.
(A) Heatmap of lipids identified in the fractions of condition medium (CM) described in Fig. 2B,C. Selected classes of lipids are indicated. nexp = 5. (B) Pie chart depicting the proportion of lipid-bound fatty acids with 0, 1, 2–3, or ≥4 double bonds detected by LC-MS in the CM > 10 kDa fraction. (C) Concentration of free C18:1 fatty acid measured in the fractions of conditioned medium described in Fig. 2B,C. P value refers to a two-tailed, homoscedastic Student’s t tests for unpaired samples. (D) Well area covered by colonies formed by MDA-MB-468 cells incubated for 7 days with medium supplemented with 0.015% BSA (vehicle), 0.015% BSA + 50 nM Na2SeO3, 0.015% BSA + 50 µM of the indicated fatty acids, 1.6 g/L lipid-rich BSA (Albumax II). P values refer to a one-way ANOVA test for unpaired samples with Dunnett’s multiple comparisons test. (E) Well area covered by colonies formed by MDA-MB-468 cells incubated for 7 days with fresh medium supplemented with vehicle control, 50 nM Na2SeO3 or 10 µM of the indicated fatty acid. P values refer to a one-way ANOVA test for unpaired samples with Dunnett’s multiple comparisons test. (F) Well area covered by colonies formed by the indicated cell lines incubated for 7 days with or without the supplementation of 10 µM oleic acid (C18:1n9). P values refer to a two-tailed, homoscedastic Student’s t tests for unpaired samples. (CF) nexp = 3–5 as indicated by the data points. Bars represent mean ± s.d. Source data are available online for this figure.
Figure 4
Figure 4. SCD is required for the anti-ferroptotic capacities of the conditioned medium.
(A) Schematic depicting the experimental workflow to condition the medium by MDA-MB-468 at high density (HD) pre-incubated with SCD inhibitor (SCDi, CAY10566). (B) Quantification of Sulforhodamine B staining performed on MDA-MB-468 cells immediately after the conditioning of the medium that followed the SCD inhibitor pre-treatment (SCDi PRE) as described in (A). (C) Well area covered by colonies formed by MDA-MB-468 cells incubated for 7 days with mock medium and medium conditioned for 2 h by MDA-MB-468 cells without or with SCD inhibitor pre-treatment (SCDi PRE). P values refer to a one-way ANOVA test for unpaired samples with Dunnett’s multiple comparisons test. Representative images of wells with colonies are shown for each experimental condition. (D) Quantification of total palmitoleic acid levels (free and lipid-bound C16:1n7) in medium conditioned by MDA-MB-468 cells without or with SCD inhibitor pre-treatment (SCDi PRE). Peak area values are normalised on the signal from internal standard (C17:0). P value refers to a two-tailed, homoscedastic Student’s t tests for unpaired samples. (E) Immunoblot of SCD and vinculin (loading control) in NTC and two SCDko clones from MDA-MB-468 breast cancer cells. Images representative of three independent experiments are shown. (F) The number of cells obtained with MDA-MB-468 NTC and SCDko clones cultured as described in the “Methods” section “Conditioned medium”. The number of seeded NTC and SCDko cells was adjusted to reach a comparable conditioning of the medium employed for the colony-forming assays shown in (G). nexp = 2 as indicated by data points, lines represent mean values. (G) Well area covered by colonies formed by MDA-MB-468 cells incubated for 7 days with mock medium or medium conditioned by NTC or SCDko MDA-MB-468 clones cultured as described in (F) and in “Methods” section “Conditioned medium” P values refer to a one-way ANOVA test for unpaired samples with Dunnett’s multiple comparisons test. Representative images of wells with colonies are shown for each experimental condition. (H) Immunoblot of SCD and vinculin (loading control) in NTC and SCDko tumours (n = 6) harvested 7 weeks after that 3 × 106 MDA-MB-468 cells were transplanted unilaterally in the mammary fat pad of NSG female mice. (I) The calliper-measured volume of the tumours obtained as described in (H). Thinner lines represent the volumes of tumours obtained from each transplantation, thicker lines and symbols represent group means. ntumour = 6. (J) Ex vivo tumour weight of NTC and SCDko tumours described in (H). ntumour = 6. Bars represent mean ± s.d. (K) Quantification of total (free and lipid-bound) fatty acid species in interstitial fluid of the tumours described in (H). SCD-derived fatty acids are highlighted in bold. Peak area values normalised on the signal from the internal standard (C17:0) were used to calculate the Log2 fold change. * indicate significance and P values refer to a two-tailed, homoscedastic Student’s t tests for unpaired samples. ntumour = 6. (BD, G) nexp = 3–4 as indicated by the data points in each panel. Bars represent mean ± s.d. Source data are available online for this figure.
Figure 5
Figure 5. Loss of SCD sensitises cells to ferroptosis.
(A) The number of NTC and SCDko MDA-MB-468 cells seeded at high density and incubated for 5 days without or with 10 µM oleic acid, 50 nM Na2SeO3, 2 µM Ferrostatin-1 or 2.5 µM Deferoxamine as indicated. P values refer to a two-way ANOVA test for unpaired samples with Dunnett’s multiple comparisons test comparing to the respective unsupplemented controls. (B) Well area covered by NTC and SCDko MDA-MB-468 cells seeded at high density and incubated for 5 days without or with 50 nM GPX4 inhibitor (RSL3), 10 µM Oleic acid or their combination (50 nM + 10 µM, respectively). P values refer to a two-way ANOVA test for unpaired samples with Dunnett’s multiple comparisons test comparing to the respective unsupplemented controls. (C, D) Peak Area ratio for C16:1/C16:0 (C) and C18:1/C18:0 (D) fatty acids in NTC and SCDko MDA-MB-468 cells seeded at high density. P values refer to a one-way repeated measures ANOVA test for paired samples with Dunnett’s multiple comparisons test compared to the NTC controls. (E) Ratio between oxidised (510 nm) and reduced (591 nm) BODIPY 581/591 C11 (lipid peroxidation sensor) in NTC and SCDko MDA-MB-468 cells seeded at high density and incubated for 2 days without or with 10 µM oleic acid or 50 nM Na2SeO3 as indicated. P values refer to a one-way repeated measures ANOVA test for paired samples with Dunnett’s multiple comparisons test, comparing to the respective unsupplemented controls. (F) qPCR quantification of SCD mRNA expression in MDA-MB-468, BT549, CAL120, MDA-MB-231 and MCF7 cells seeded at low and high density and cultured for 2 days. The expression is relative to Actin, lamin B1 and TBP mRNA abundance. P values refer to a two-tailed, homoscedastic Student’s t tests for unpaired samples. (G) Immunoblot analysis of SCD levels in MDA-MB-468 (antibody Alpha Diagnostic International Inc., #SCD11-A, 1:1000) and BT549, CAL120, MDA-MB-231, MCF7 cells (antibody Abcam, #ab19862, 1:1000) seeded at low and high density and cultured for 2 days. The lower inset shows representative images of the western blot for SCD and vinculin (loading control) from one of the experiments quantified in the upper panel. P value refers to a two-tailed, homoscedastic Student’s t tests for unpaired samples comparing low and high densities. (H) qPCR quantification of ACACA, FASN, ELOVL3, FADS1 and FADS2 mRNA expression in MDA-MB-468 cells seeded at low and high density and cultured for 2 days. The expression is normalised on the mean mRNA abundance of ACTB, LMNB1 and TBP (Appendix Fig. S2B–D). P values refer to a two-tailed, homoscedastic Student’s t tests for unpaired samples comparing low and high densities. (I) Relative expression of SCD in breast cancer patient-derived samples from primary tumours, metastatic lesions and circulating tumour cells. The analysed data were obtained from the ctcRbase database. Whiskers represent highest and lowest values. Boxes span from first quartile values to third quartile values with line representing the median expression level. (AH) nexp = 3–6 as indicated by the data points in each panel. Bars represent mean ± s.d. Source data are available online for this figure.
Figure 6
Figure 6. Targeting selenocysteine biosynthesis impairs lung metastasis of TNBC.
(A) Schematic depicting selenocysteine synthesis on tRNAsec. (B) Immunoblot images of GPX4 and vinculin (loading control) in control MDA-MB-468 cells (NTC) or in cells depleted of PSTK, SEPHS2 and SEPSECS supplemented with 50 nM Na2SeO3 as indicated. (C) Well area covered by NTC, sgSEPHS2 and sgSEPSECS MDA-MB-468 cells seeded at high density and incubated for 5 days without or with 1 µM Ferrostatin-1. nexp = 3. Bars represent mean ± s.d. (D) Well area covered by colonies formed by NTC, sgSEPHS2, sgPSTK and sgSEPSECS MDA-MB-468 cells seeded at low density and incubated for 7 days without and with 50 nM Na2SeO3 or 1 µM Ferrostatin-1. nexp = 1–3 as indicated by the data points. P values refer to a two-way ANOVA test for unpaired samples with Dunnett’s multiple comparisons test comparing to the respective unsupplemented controls. Bars represent mean ± s.d. (E) Immunoblot images of GPX4, SEPHS2 and vinculin (loading control) in MDA-MB-468 cells (NTC) or in cells depleted of SEPHS2 or SEPSECS supplemented with 50 nM Na2SeO3 as indicated. Images are representative of 3 independent experiments. (F) Calliper-measured volume of tumours in the mammary fat pad of female NSG mice transplanted with NTC, sgSEPHS2 or sgSEPSECS MDA-MB-468 cells (n = 8 mice/group). All mice were transplanted bilaterally with 3 × 106 cells. One transplanted mouse of each NTC and sgSEPSECS group had to be culled before the completion of the experiment for licence reasons due to the location of the tumour. When multiple tumours were formed from a single transplantation of cells their combined volumes were reported as one data point. Thinner lines represent the volumes of tumours obtained from each fat pad transplantation, thicker lines and symbols represent group means (n = 14 tumours for NTC, n = 16 for sgSEPHS2, n = 14 for sgSEPSECS). A CGGC permutation test (https://bioinf.wehi.edu.au/software/compareCurves/) was used to assess the significant differences between growth curves. Adjusted P value comparing the NTC to sgSEPHS2 or sgSEPSECS obtained with a test with 1000 permutations were 0.66 and 0.67, respectively. (G) Ex vivo weight of resected NTC, sgSEPHS2 or SEPSECS tumours taken 38 days after transplantation. P values refer to a one-way ANOVA test for unpaired samples with Dunnett’s multiple comparisons test compared to the NTC control. n = 14 for NTC or sgSEPSECS tumours and n = 16 for sgSEPHS2 as indicated by the data points. (H, I) IVIS pictures and quantification of lung metastasis burden 9 days (H) and 35 days (I) after tail vein injection of 2 × 106 NTC, sgSEPHS2 or sgSEPSECS MDA-MB468 cells. The same mice are shown in (H, I). P value refers to a one-way ANOVA test for unpaired samples with Dunnett’s multiple comparisons test compared to the NTC control. n = 7–8 female NSG mice as indicated by data points. One injected mouse of sgSEPHS2 group had to be culled due to husbandry reasons. (J) Representative images of staining with haematoxylin and eosin (HE), human Ku80 and Cas9 of lungs of mice described in (H, I) seven weeks after tail vein injection. Black squares frame the areas magnified at ×20. (K) Lung metastasis burden assessed by quantifying the % of human Ku80 and Cas9-positive cells in lungs of mice described in (H, I) seven weeks after tail vein injection. P values refer to a one-way ANOVA test for unpaired samples with Dunnett’s multiple comparisons test comparing to the NTC control. n = 7–8 female NSG mice as indicated by data points. Source data are available online for this figure.
Figure 7
Figure 7. The lack of a MUFAs shield sensitizes metastatic TNBC cells to selenoprotein synthtesis inhibition.
Conversely, TNBC cells grown at low density or metastasising in the bloodstream downregulate SCD expression resulting in MUFAs deficiency. This metabolic shift renders metastatic cells dependent on the anti-ferroptotic action of selenoproteins, in particular glutathione peroxidase 4 (GPX4), exposing a novel conditional vulnerability tied to the inhibition of Sec-tRNAsec biosynthesis. Indeed, in preclinical models targeting the enzymes of the Sec-tRNAsec biosynthesis effectively impede TNBC lung metastasis.
Figure EV1
Figure EV1. Breast cancer cells produce an anti-ferroptosis molecule at high density.
(AD) qPCR quantification of AIFM2 (A), ACSL4 (B), DHFR (C), and DHODH (D) mRNA expression in MDA-MB-468 cells seeded at low density in mock medium and supplemented with 50 nM selenite or conditioned medium (CM) for 2 days as indicated. The gene expression was also assessed in cells seeded at high density (HD) grown for 2 days in mock medium. The mRNA level is normalised to the mean mRNA abundance of the three housekeeping genes (ACTB, LMNB1, and TBP) shown in (E). P values refer to a one-way ANOVA for paired samples with Dunnett’s multiple comparisons test. nexp = 3. Bars represent mean ± s.d. (E) qPCR quantification of ACTB, LMNB1, and TBP mRNA expression in MDA-MB-468 cells seeded and treated as described in A–D. nexp = 3. Bars represent mean ± s.d. (F) Immunoblot analysis of GPX4 and vinculin (loading control) in MDA-MB-468 cells MDA-MB-468 cells seeded and treated as described in (AD). A.U.: arbitrary unit. Representative images of GPX4 and vinculin (loading control) from one of the three experiments quantified in the upper graph. P values refer to a one-way ANOVA for paired samples with Dunnett’s multiple comparisons test. Bars represent mean ± s.d.
Figure EV2
Figure EV2. Monounsaturated fatty acids are enriched in the conditioned medium and prevent ferroptosis.
(A) Heatmap of lipids regulated in MDA-MB-468 cells cultured at low density with mock medium, conditioned medium (CM) or mock medium with 10 µM oleic acid. Ferrostatin-1 was supplemented at 2 µM in all conditions. The lipids identified as significantly regulated with a two-tailed, homoscedastic Student’s t tests for unpaired samples in the comparison between conditioned medium and mock medium are reported and selected classes of lipids are indicated. For the phosphatidylcholine class the number of double bonds is also reported (0, 1, 2–3, 4 + ). The Log2 fold change refers to the comparison with mock medium supplemented cells. nexp = 5. (B) Representative images for the colony-forming assays displayed in Fig. 3D. (C) Representative images for the colony-forming assays displayed in Fig. 3E. (D) Representative images for colony-forming assays displayed in Fig. 3F.
Figure EV3
Figure EV3. SCD is required for the anti-ferroptotic capacities of the conditioned medium.
(A) Quantification of total (free and lipid-bound) fatty acid species in medium conditioned by MDA-MB-468 cells without or with SCD inhibitor pre-treatment (SCDi PRE). Peak area values normalised on the signal from internal standard (C17:0) were used to calculate the Log2 fold change. P value refers to a two-tailed, homoscedastic Student’s t tests for unpaired samples. These data complement Fig. 4D. nexp = 4. (B) Immunoblot of LRP8, GPX4, and vinculin (loading control) in NTC and LRP8ko clones (#1–2) derived from MDA-MB-468 breast cancer cells. (C) Well area covered by colonies formed by MDA-MB-468 NTC control cells and LRP8ko clones incubated for 7 days with mock medium or medium conditioned by NTC or SCDko MDA-MB-468 clones cultured as shown in Fig. 4F. P values refer to a one-way ANOVA test for unpaired samples with Dunnett’s multiple comparisons test. nexp = 4. Bars represent mean ± s.d. Representative images of wells with colonies are shown for each experimental condition.
Figure EV4
Figure EV4. Targeting selenocysteine biosynthesis impairs lung metastasis of TNBC.
(A) Representative images of the well area covered by cells at the end of the assays shown in Fig. 6C. (B) Representative images of the colony-forming assays shown in Fig. 6D. (C) IVIS pictures and quantification of lung metastasis burden 1 h after tail vein injection of 2 × 106 NTC, sgSEPHS2 or sgSEPSECS MDA-MB468 cells. The same mice are shown in Fig. 6H,I. P value refers to a one-way ANOVA test for unpaired samples with Dunnett’s multiple comparisons test comparing to the NTC control. n = 7–8 female NSG mice as indicated by data points. One injected mouse of sgSEPHS2 group had to be culled due to husbandry reasons. (D) Immunoblot for GPX4, SEPHS2 and vinculin (loading control) in mammary tumours sampled 38 days after the transplantation of NTC, sgSEPHS2, or sgSEPSECS MDA-MB-468 cells. For each experimental group the lysates from 7 tumours were loaded as indicated.

References

    1. Aceto N, Bardia A, Miyamoto DT, Donaldson MC, Wittner BS, Spencer JA, Yu M, Pely A, Engstrom A, Zhu H et al (2014) Circulating tumor cell clusters are oligoclonal precursors of breast cancer metastasis. Cell 158:1110–1122 - PMC - PubMed
    1. Alborzinia H, Chen Z, Yildiz U, Freitas FP, Vogel FCE, Varga JP, Batani J, Bartenhagen C, Schmitz W, Büchel G et al (2023) LRP8‐mediated selenocysteine uptake is a targetable vulnerability in MYCN‐amplified neuroblastoma. EMBO Mol Med 15(8):e18014 - PMC - PubMed
    1. Altea-Manzano P, Doglioni G, Liu Y, Cuadros AM, Nolan E, Fernández-García J, Wu Q, Planque M, Laue KJ, Cidre-Aranaz F et al (2023) A palmitate-rich metastatic niche enables metastasis growth via p65 acetylation resulting in pro-metastatic NF-κB signaling. Nat Cancer 4(3):344–364 - PMC - PubMed
    1. Bersuker K, Hendricks JM, Li Z, Magtanong L, Ford B, Tang PH, Roberts MA, Tong B, Maimone TJ, Zoncu R et al (2019) The CoQ oxidoreductase FSP1 acts parallel to GPX4 to inhibit ferroptosis. Nature 575:688–692 - PMC - PubMed
    1. Burk RF, Hill KE (2015) Regulation of Selenium Metabolism and Transport. Annu Rev Nutr 35:109–134 - PubMed

MeSH terms

Substances

LinkOut - more resources