. 2024 Dec;43(23):5837-5856.
doi: 10.1038/s44318-024-00269-0. Epub 2024 Oct 21.

Glutamine sensing licenses cholesterol synthesis

Affiliations

Glutamine sensing licenses cholesterol synthesis

Bruna Martins Garcia et al. EMBO J. 2024 Dec.

Abstract

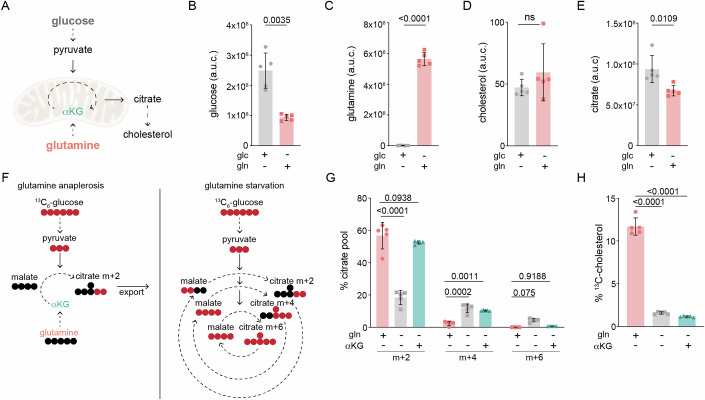
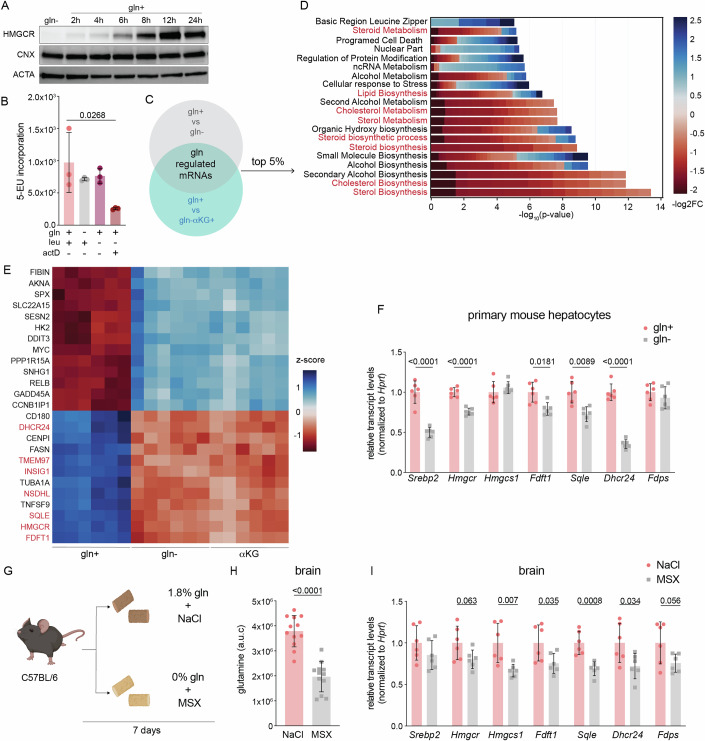
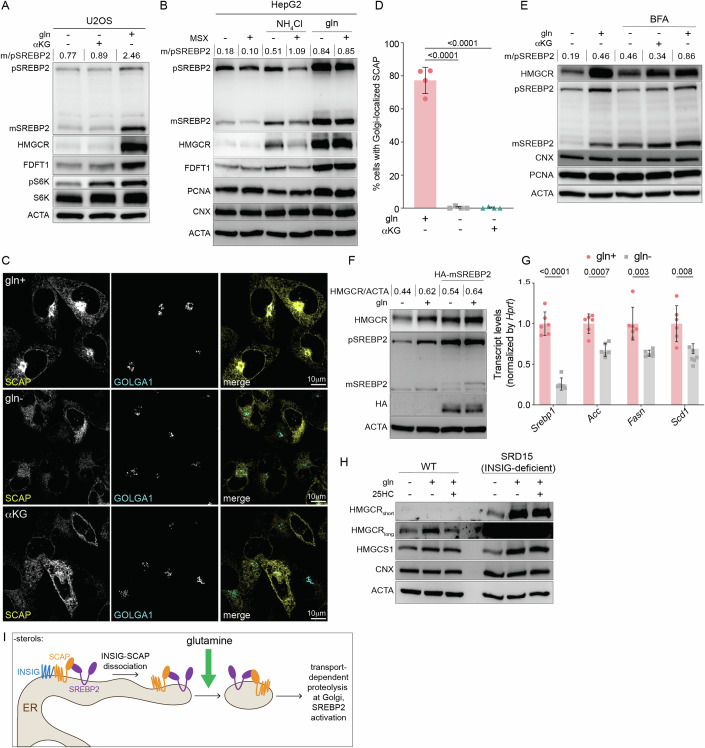
The mevalonate pathway produces essential lipid metabolites such as cholesterol. Although this pathway is negatively regulated by metabolic intermediates, little is known of the metabolites that positively regulate its activity. We found that the amino acid glutamine is required to activate the mevalonate pathway. Glutamine starvation inhibited cholesterol synthesis and blocked transcription of the mevalonate pathway-even in the presence of glutamine derivatives such as ammonia and α-ketoglutarate. We pinpointed this glutamine-dependent effect to a loss in the ER-to-Golgi trafficking of SCAP that licenses the activation of SREBP2, the major transcriptional regulator of cholesterol synthesis. Both enforced Golgi-to-ER retro-translocation and the expression of a nuclear SREBP2 rescued mevalonate pathway activity during glutamine starvation. In a cell model of impaired mitochondrial respiration in which glutamine uptake is enhanced, SREBP2 activation and cellular cholesterol were increased. Thus, the mevalonate pathway senses and is activated by glutamine at a previously uncharacterized step, and the modulation of glutamine synthesis may be a strategy to regulate cholesterol levels in pathophysiological conditions.

Keywords: Cholesterol; HMGCR; MFN2; Nutrient Sensing; SREBP2.


Conflict of interest statement

Disclosure and competing interests statement. BMG and LP are inventors on a European patent application (No. EP23171736.4) filed by the Max-Planck-Gesellschaft. The patent application covers the use of GLUL activators or inhibitors to modulate lipid levels. The remaining authors declare no competing interests.

Figures

Figure 1
Figure 1. Glutamine is required for cholesterol synthesis.
(A) Main nutrients used to generate the citrate used for cholesterol synthesis are glucose via oxidation of pyruvate, and glutamine via α-ketoglutarate (αKG); dotted arrow represents 1+ steps. The abundance of total (B) glucose, (C) glutamine, (D) cholesterol, and (E) citrate in U2OS cells cultured with only glucose (glc) or only glutamine (gln) for 8 h. Data are mean ± s.d. of n = 5 independent cultures, Glc vs. Gln by unpaired t-test; a.u.c.: area under the curve. (F) Left: Simplified model of efflux of m + 2 citrate derived from 13C6-glucose when anaplerosis is supplied by glutamine-derived αKG; right: oxidation of glucose feeds the TCA cycle in the absence of glutamine. Red circles represent 13C-carbons and black circles represent 12C-carbons; dotted arrow represents >1 reactions. (G) Mass isotopologues of citrate in U2OS cells cultured for 24 h with 25 mM 13C6-glucose in the presence of 2 mM glutamine (gln+) or 1 mM αKG as indicated. Data are mean ± s.d. of n = 5 independent cultures; ns: not significant by two-way ANOVA. (H) Percentage of 13C-cholesterol in U2OS cells treated as in (G). Data are mean ± s.d. of n = 5 independent cultures; by one-way ANOVA. Cells were cultured in lipid-free media for all experiments.
Figure 2
Figure 2. Glutamine starvation inhibits the mevalonate pathway.
(A) U2OS cells were cultured ± glutamine (gln+, gln-) for the indicated times and analyzed by immunoblotting for HMGCR, calnexin (CNX), and tubulin (TUBA). (B) HeLa cells and (C) primary human foreskin fibroblasts (HFFs) were cultured w/ or w/o glutamine (gln+, gln-) for 24 h and analyzed by immunoblotting for HMGCR, calreticulin (CALR), actin (ACTA) CNX, or hypoxanthine phosphoribosyl transferase (HPRT1) as indicated. (D) Glutamine synthetase (GLUL) generates gln from ammonia and glutamate. (E) GLUL relative protein expression and RNA log2 TPM + 1 in 347 cancer cell lines; data were obtained from previously generated data available at https://depmap.org/portal/ccle/. (F) Percentage of 15N-glutamine in U2OS and HepG2 cells cultured for 24 h w/o gln and supplemented for 24 h with 10 mM 15NH4Cl. Data are mean ± s.d. of n = 4 independent cultures, analysis by unpaired t-test. Total pool size of (G) glutamine and (H) cholesterol from samples treated as in (F); data are mean ± s.d. of n = 4 independent cultures, analysis by two-way ANOVA. (I) U2OS and (J) HepG2 cells were starved of glutamine for 24 h, then treated for 24 h w/ gln or w/o gln ± 10 mM 15NH4Cl. Samples were harvested and analyzed by immunoblotting for HMGCR and actin (ACTA). (K) U2OS cells expressing cDNA encoding for MYC-tagged GLUL were cultured with or without glutamine and 10 mM NH4Cl for 24 h. Samples were analyzed by immunoblotting for HMGCR, GLUL, TUBA. Following glutamine starvation for 24 h, (L) HepG2s and (M) isolated murine hepatocytes were treated as indicated for 8 and 24 h, respectively, and analyzed by immunoblotting for HMGCR, GLUL, TUBA, CNX, and ACTA as indicated. Concentrations used: Gln 2 mM, 10 mM NH4Cl, 500 μM methionine sulfoximine (MSX). Cells were cultured in lipid-free media for all experiments. Source data are available online for this figure.
Figure 3
Figure 3. Glutamine, but not its derivatives, is required for HMGCR expression.
Glutamine-fed U2OS cells were cultured (A) ± glutamine (gln+, gln-) and ± MG-132 (10 μM) for 8 h; (B) for 24 h ± gln and ± αKG as indicated (C) ± gln and ± ISRIB (200 nM) ± αKG as indicated for 8 h. (AC) Samples were analyzed by immunoblotting for HMGCR, calnexin (CNX), hypoxanthine phosphoribosyltransferase 1 (HPRT1), ubiquitin (UB), p70 S6 kinase (S6K), p70 phospho-S6K (pS6K), ATF4; and actin (ACTA). (D) U2OS cells were treated for as indicated for 8 h, at which point new protein synthesis was assayed by puromycin incorporation (lipids: 10% FBS; leu: 0.8 mM; gln, 2 mM). (E) Glutamine supplies carbons and nitrogen for the biosynthesis of TCA metabolites, glucosamine-6-phosphate (GlcN6P) that is used for UDP-GlcNAc synthesis, non-essential amino acids (NEAA), and nucleotides. Heat map of z-score normalization of the total pool size of (F) TCA-cycle metabolites and UDP-GlcNAc, (G) amino acids (AA), and (H) nucleotides in U2OS cells cultured for 24 h with 25 mM 13C6-glucose in gln+ or gln- ± αKG (gln-; αKG+, respectively) conditions. Data are mean ± s.d. of n = 5 independent cultures. (I) U2OS cells were cultured w/o gln for 8 h w/ indicated supplements and concentrations; gln: 2 mM; αKG: 1 mM; NEAA: 100 μM (glycine, alanine, asparagine, aspartate, glutamate, proline and serine), nucleosides (cytidine 7.3 mg/L, guanosine 8.5 mg/L, uridine 7.3 mg/L, adenosine 8 mg/L, and thymidine 2.4 mg/L), and glucosamine (precursor to UDP-GlcNAc): 1 mM. Samples were analyzed by immunoblotting for HMGCR, CNX, pS6K, and ACTA. For all experiments, glutamine was used at 2 mM, αKG at 1 mM. Cells were cultured in lipid-free media for all experiments. Source data are available online for this figure.
Figure 4
Figure 4. Glutamine starvation transcriptionally represses cholesterol.
(A) U2OS cells were cultured with ±2 mM glutamine (gln) for the indicated time. Samples were analyzed by immunoblotting for HMGCR, calnexin (CNX), and actin (ACTA). (B) U2OS cells were treated as indicated for 8 h and nascent RNA synthesis was measured by 5-ethynyl-uridine (5-EU) incorporation; leu: 0.8 mM; gln, 2 mM; actinomycin D (actD) added 30 min prior to harvesting at 4 μg/mL. Data are shown as mean ± s.d. of n = 3 biological replicates by one-way ANOVA. (C) U2OS cells were cultured ±gln and ±αKG as indicated for 8 h and analyzed by RNAseq analysis. Differential expression was performed between “Control” and “Treatment” samples using limma/3.54.0 (Love et al, 2014). Gln+ samples were classified as Control whereas gln- samples and aKG+ samples were classified as Treatment (Sherman et al, 2022). (D) Pathway enrichment analysis was performed using the DAVID API on the top 5% of glutamine-responsive genes from experiment schematicized in (C); cholesterol-related processes are highlighted in red. (E) Heat map of z-score of expression values of the top 25 glutamine-regulated genes from the subset as described in (C); genes in red are SREBP2 targets. (F) mRNA levels in isolated primary hepatocytes that were 24h-starved of gln and treated with 500 mM methionine sulfoximine (MSX) ± 2 mM of gln as indicated for 24 h. mRNA expression was measured by the standard curve method and normalized to Hprt1; y-axis depicts the transcript levels relative to gln+. Data are mean ± s.d. of n = 6 independent cultures by multiple unpaired t-test. (G) Schematic of experimental setup: 10-week-old C67Bl/6J mice were fed a 1.8% glutamine-containing or glutamine-free diet, and intraperitoneally injected with 0.9% saline or 20 mg/kg MSX in a 48 h interval, respectively. Mice were sacrificed after 7 days. (H) Total glutamine in brain tissue of mice treated as in (G). mRNA levels in isolated primary hepatocytes that were 24h-starved of gln and treated with 500 mM methionine sulfoximine (MSX) ± 2 mM of gln as indicated for 24 h. mRNA expression was measured by the standard curve method and normalized to Hprt1; y-axis depicts the transcript levels relative to gln+. Outliers were removed using Rout and Grubbs’s test. Data are mean ± s.d. of n = 12 by unpaired t-test. (I) Transcript levels of SREBP2 targets in brain tissue of mice treated as in (G). mRNA expression was measured by the standard curve method and normalized to Hprt1; y-axis depicts the transcript levels relative to NaCl. Data are mean ± s.d. of n = 6 mice by multiple unpaired t-tests. Source data are available online for this figure.
Figure 5
Figure 5. Glutamine is required for SCAP/SREBP2 ER-to-Golgi trafficking.
(A) U2OS cells were cultured with w/ glutamine (gln+) or w/o gln (gln-) ± αKG for 8 h as indicated and analyzed by immunoblotting for: HMGCR, precursor (p) SREBP2, mature (m) SREBP2, FDFT1, S6K, pS6K, and actin (ACTA). (B) HepG2 cells were starved of gln for 24 h, then treated ± gln ± 10 mM NH4Cl ± 500 mM methionine sulfoximine (MSX) as indicated for 8 h and analyzed by immunoblotting for HMGCR, SREBP2 and ACTA. (C) Representative images of eGFP-SCAP-expressing CHO cells cultured w/o gln for 24 h, and then treated with + gln of – gln ± aKG in the presence of methionine sulfoximine (MSX; 500 mM) for 24 h and processed for immunofluorescence analysis of the Golgi (GOLGA1; golgin-97). Panels show localization of eGFP-SCAP relative to the Golgi, scale bar 10 µm. (D) Percentage of cells with Golgi-localized eGFP-SCAP from experiments as in (C); data are mean ± s.d. of >100 cells counted from n = 4 biological replicates by one-way ANOVA. (E) HepG2s were starved of glutamine for 24 h and treated w/ brefeldin A: 0.5 mg/ml or gln for indicated time points. Samples were analyzed by immunoblotting for HMGCR, SREBP2, CNX, PCNA, and ACTA. (F) CHO cells expressing cDNA encoding for HA-tagged mature SREBP2 were cultured with or without glutamine for 8 h. Samples were analyzed by immunoblotting for HMGCR, SREBP2, HA, and ACTA. (G) SREBP1-target mRNA levels in isolated primary hepatocytes that were 24 h-starved of gln and treated with 500 mM MSX ± 2 mM of gln as indicated for 24 h. mRNA expression was measured by the standard curve method and normalized to Hprt1; y-axis depicts the transcript levels relative to gln+. Data are mean ± s.d. of n = 6 independent cultures, gln- vs. gln+ by multiple unpaired t-test. (H) Control and SRD-15 (INSIG-deficient) CHO cells were cultured ± gln and ± 25HC (10 μM) for 24 h as indicated and analyzed by immunoblotting for HMGCR and ACTA. (I) Model of glutamine-based regulation of cholesterol synthesis. Glutamine was used at 2 mM and aKG at 1 mM; cells were cultured in lipid-free media for all experiments. m/p SREBP2 is the densitometry-based ratio of mature vs. precursor SREBP2. Source data are available online for this figure.
Figure 6
Figure 6. Chronic mitochondrial dysfunction increases glutamine consumption and mevalonate pathway activation.
(A) U2OS cells were cultured w/o glutamine (gln) for 24 h and treated with indicated gln concentrations for 8 h. Samples were analyzed by immunoblotting for HMGCR and actin (ACTA). (B) WT and MFN2 knockout (KO) U2OS cells were serum-starved for 24 h and analyzed by immunoblot analysis for MFN2, TOM70, ACTA, and ATP synthase F1 subunit beta (ATP5) and in parallel for (C) oxygen consumption analyses including (D) basal respiration; (E) maximal respiration; (F) ATP production; (G) spare respiratory capacity. (H) Total glutamine in DMEM versus glutamine in media 8 h after culture with WT or MFN2 KO cells. (I) During mitochondrial dysfunction glutamine feeds citrate synthesis via reductive carboxylation of αKG. (J) m + 5 αKG and (K) m + 4/5 citrate in U2OSs cultured for 24 h with 1 mM 13C5-glutamine. Data are mean ± s.d. of n = 4 independent cultures by unpaired t-test (J) or (K) two-way ANOVA. (L) WT and MFN2KO U2OSs in lipid-free culture for 24 h were analyzed by immunoblotting for HMGCR, MFN2, and ACTA. (M) WT and MFN2-KO U2OSs cultured in lipid-free media overnight followed by 24 h ± lipids were analyzed by immunoblotting for SREBP2, the nuclear protein PCNA, MFN2, and ACTA; m/p is the densitometry-based ratio of mature vs. precursor SREBP2. (N) Total cholesterol levels in WT and MFN2KO U2OSs in lipid-free culture for 24 h. Data are mean ± s.d. of n = 5 independent cultures by unpaired t-test. (O) WT and MFN2KO U2OSs in gln-free media for 24 h were refed gln for indicated times and analyzed by immunoblotting for HMGCR, MFN2, and ACTA. Glutamine is used at 2 mM unless otherwise stated. Cells were cultured in lipid-free media for all experiments except as indicated in 6 M. Source data are available online for this figure.

References

    1. Bligh EG, Dyer WJ (1959) A rapid method of total lipid extraction and purification. Can J Biochem Physiol 37:911–917 - PubMed
    1. Boncompain G, Divoux S, Gareil N, de Forges H, Lescure A, Latreche L, Mercanti V, Jollivet F, Raposo G, Perez F (2012) Synchronization of secretory protein traffic in populations of cells. Nat Methods 9:493–498 - PubMed
    1. Bray NL, Pimentel H, Melsted P, Pachter L (2016) Near-optimal probabilistic RNA-seq quantification. Nat Biotechnol 34:525–527 - PubMed
    1. Brown MS, Goldstein JL (1997) The SREBP pathway: regulation of cholesterol metabolism by proteolysis of a membrane-bound transcription factor. Cell 89:331–340 - PubMed
    1. Brown MS, Radhakrishnan A, Goldstein JL (2018) Retrospective on cholesterol homeostasis: the central role of scap. Annu Rev Biochem 87:783–807 - PMC - PubMed

MeSH terms