

Lipid levels and insulin resistance markers in gastric cancer patients: diagnostic and prognostic significance
- PMID: 39434031
- PMCID: PMC11495014
- DOI: 10.1186/s12876-024-03463-w
Lipid levels and insulin resistance markers in gastric cancer patients: diagnostic and prognostic significance
Abstract
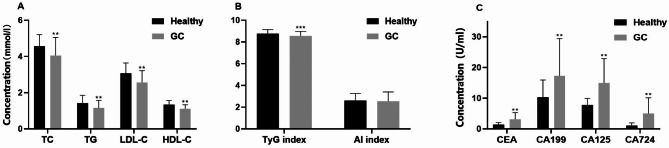
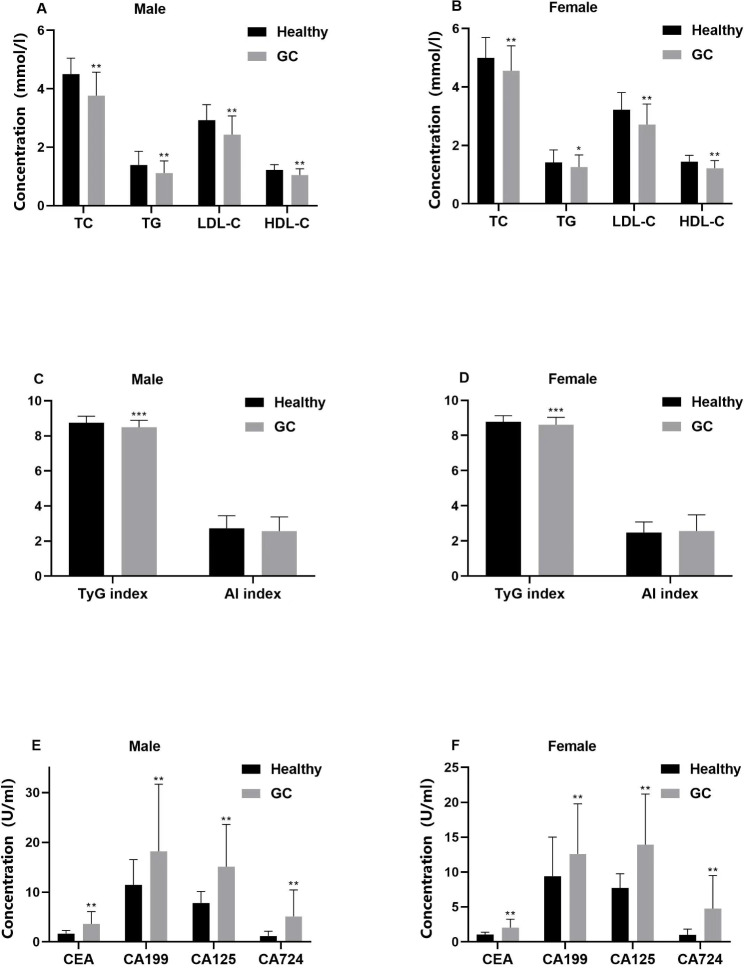
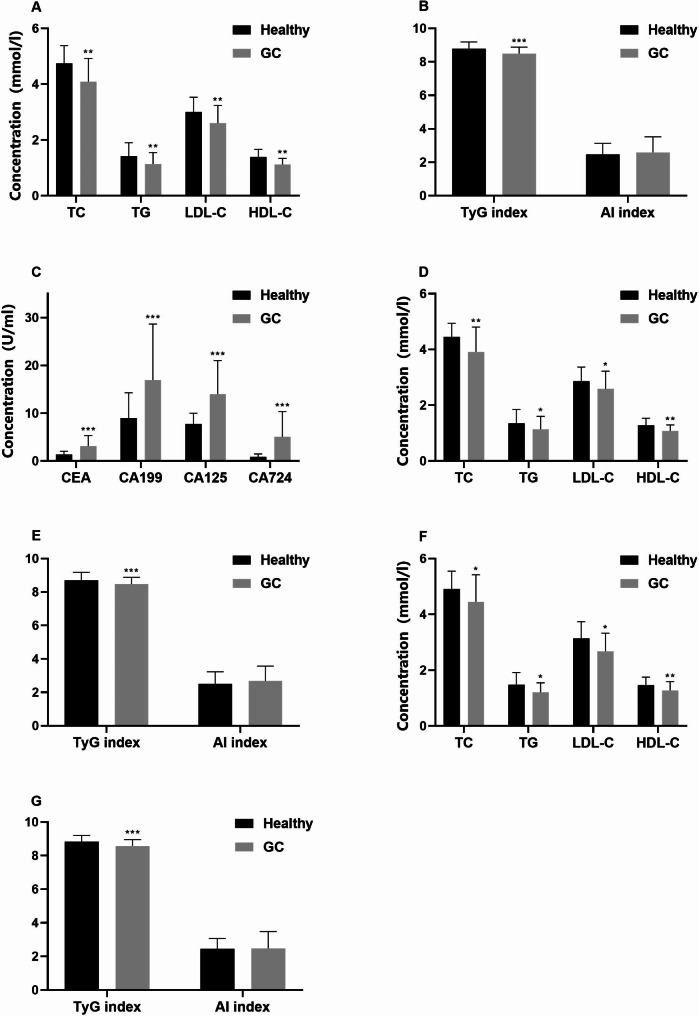
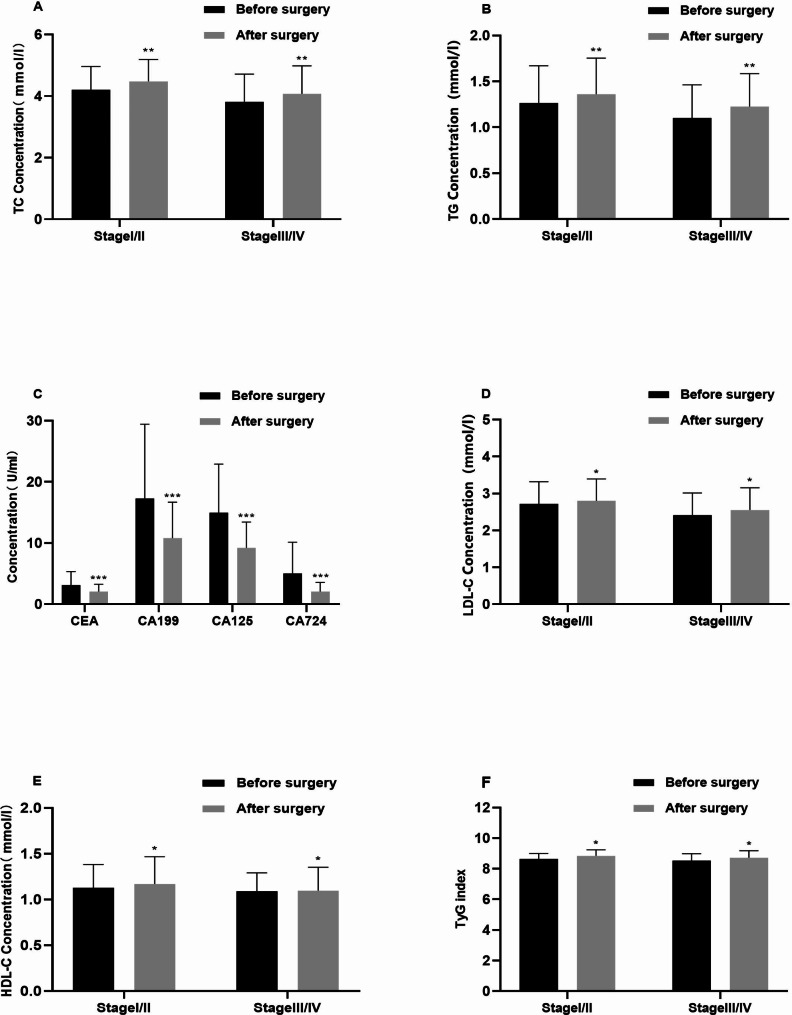
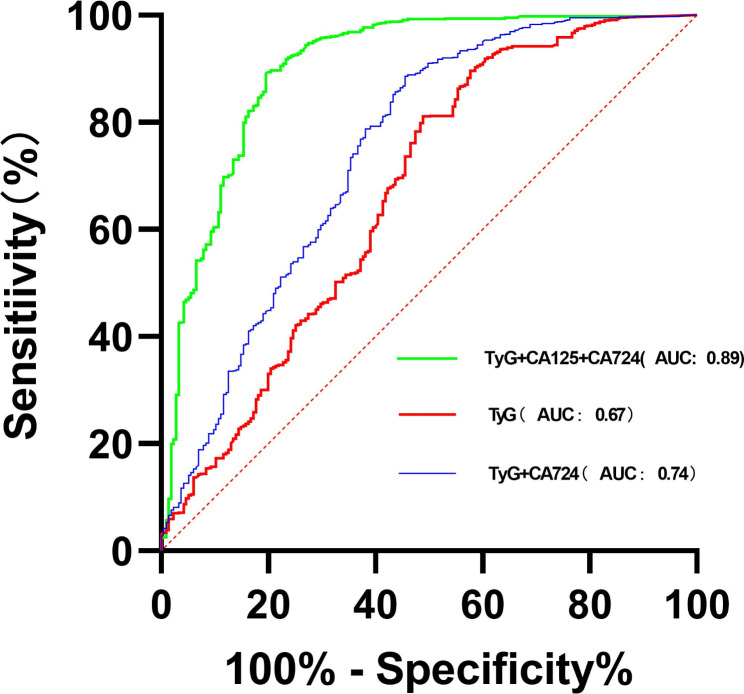
Gastric cancer (GC) is a highly heterogeneous and aggressive malignant tumor that seriously affects the life safety of people all over the world. Its early manifestations are subtle. The present study aimed to investigate the clinical significance of serum lipid profiles, insulin resistance markers including the triglyceride-glucose (TyG) index and the atherosclerotic index (AI), in GC patients. A retrospective analysis encompassed 215 GC patients and 827 healthy individuals. The study results show that the total cholesterol, triglycerides, low-density lipoprotein, high-density lipoprotein levels, and the TyG index of GC patients were significantly lower than those of the control group before and after propensity score matching analysis. In the GC group, the levels of CEA, CA199, CA125, and CA724 tumor markers were higher than those in the healthy control group. Patients in advanced stages exhibited lower serum levels of serum lipids and TyG index compared to those in early stages. ROC analysis revealed that the TyG index, CA125, and CA199 combination yielded the highest positive prediction rate for GC at 98.6%. TyG index is significantly associated with the risk of adverse reactions after chemotherapy (OR = 1.104, 95% CI 1.028-1.186, P < 0.01). Multiple tumor markers and the TyG index combined detection showed correlations with five adverse reactions caused by chemotherapy (r < 0.6, P < 0.05). Preoperative lipid profiles in the serum show a strong correlation with patients diagnosed with GC. Evaluating a combination of various serum lipids and cancer markers significantly improves diagnostic precision for GC and the ability to predict chemotherapy side effects.
Keywords: Diagnostic marker; Gastric cancer; Serum lipids; Triglyceride-glucose index.
© 2024. The Author(s).
Conflict of interest statement
The authors declare no competing interests.
Figures
References
-
- Smyth EC, Nilsson M, Grabsch HI, van Grieken NC, Lordick F. Gastric cancer. Lancet. 2020;396(10251):635–48. - PubMed
-
- Sung H, Ferlay J, Siegel RL, Laversanne M, Soerjomataram I, Jemal A, Bray F. Global Cancer statistics 2020: GLOBOCAN estimates of incidence and Mortality Worldwide for 36 cancers in 185 countries. CA-CANCER J CLIN. 2021;71(3):209–49. - PubMed
-
- Douda L, Cyrany J, Tachecí I. Early gastric cancer. Vnitr Lek. 2022;68(6):371–5. - PubMed
MeSH terms
Substances
Grants and funding
LinkOut - more resources
Full Text Sources
Medical
Research Materials
Miscellaneous
