. 2024 Oct 21;25(1):277.
doi: 10.1186/s13059-024-03422-4.

Mapping lineage-traced cells across time points with moslin

Affiliations

Mapping lineage-traced cells across time points with moslin

Marius Lange et al. Genome Biol. .

Abstract

Simultaneous profiling of single-cell gene expression and lineage history holds enormous potential for studying cellular decision-making. Recent computational approaches combine both modalities into cellular trajectories; however, they cannot make use of all available lineage information in destructive time-series experiments. Here, we present moslin, a Gromov-Wasserstein-based model to couple cellular profiles across time points based on lineage and gene expression information. We validate our approach in simulations and demonstrate on Caenorhabditis elegans embryonic development how moslin predicts fate probabilities and putative decision driver genes. Finally, we use moslin to delineate lineage relationships among transiently activated fibroblast states during zebrafish heart regeneration.

Keywords: Cellular dynamics; Fate decisions; Lineage tracing; Optimal transport; Regeneration.


Conflict of interest statement

F.J.T. consults for Immunai Inc., Singularity Bio B.V., CytoReason Ltd, Cellarity, and Omniscope Ltd, and has ownership interest in Dermagnostix GmbH and Cellarity. The remaining authors declare no competing interests.

Figures
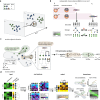
Fig. 1
Fig. 1
Moslin maps lineage-traced single cells across time points. a Schematic of scRNA-seq time-course experiment with time points t1 (circles) and t2 (triangles). Cells are destroyed upon sequencing; this makes it difficult to study the trajectories of early cells giving rise to late cells. We highlight a rare population (brown triangles) that only appears at t2, with uncertain origin at t1. Illustration of independent clonal evolution (ICE) experimental design for scLT studies, adjusted from ref [32]. ICE samples cells from different individuals at different time points and is applicable to in vivo settings. c Overview of moslin’s optimal-transport (OT)-based objective function for in vivo scLT. The gray outline shows a simplified state manifold; shapes and colors as in a. The dashed inset highlights lineage trees reconstructed independently for each time point [16]; these trees may be used in moslin to quantify lineage similarity. We use Wasserstein (W) and Gromov-Wasserstein (GW) terms to compare cells in terms of gene expression and lineage similarity, respectively. The combination of W and GW terms gives rise to moslin’s Fused Gromov-Wasserstein (FGW) objective function on the right (“Methods”). d The moslin workflow; based on gene expression matrices X and Y, marginals a and b, and lineage information across time points, we compute distance matrices CX, CY, and C, and use moslin to reconstruct a coupling matrix P, probabilistically matching early to late cells. The marginals may be used to quantify measurement uncertainty or cellular growth and death. The coupling matrix P may be analyzed directly or passed to CellRank 2 [23] to compute fate probabilities, driver genes and expression trends or cascades. Figure created in BioRender.com
Fig. 2
Fig. 2
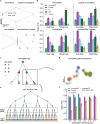
Moslin obtains accurate couplings for simple and complex trajectory topologies. a Visualization of the four different kinds of simulated trajectories in gene expression space for the 2D setting. b Each subplot presents the evaluation of a different simulated trajectory. Per trajectory, the mean error (the mean value of the ancestors and descendants error) is evaluated for the true tree or a reconstructed fitted tree for all methods, LineageOT, CoSpar, W, GW, and moslin (“Methods”). Error bars depict the 95% confidence interval across 10 random simulations. ce Simulated tree and expression using TedSim [52]. The cell state tree (c) defines the underlying trajectories of cell differentiation. TedSim simulations yield gene expression (d) and a cell division tree (e), which represents the true lineage and barcode for each cell. f Mean prediction error of moslin compared to CoSpar and LineageOT, as a function of the stochastic silencing rate. Error bars depict the 95% confidence interval across 10 random simulations
Fig. 3
Fig. 3
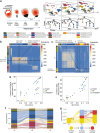
Moslin accurately captures C. elegans embryogenesis. a UMAP [56] of approx. 6.5k C. elegans ABpxp cells, colored by time point (left) and cell type (right) [7]. b Bar chart of the mean error for different methods across time points (“Methods”). c Left: UMAP of 330–390 min cells, colored in gray (390 min cells) or by the difference in descendant error between moslin and LineageOT (330 min cells). Black inset highlights RIM parent cells, which transition towards RIM cells [7]. Right: ground-truth, moslin and LineageOT couplings for the RIM parent population; “error” indicates the aggregated descendant error over this population (Additional file 1: Fig. S6 and “Methods”) UMAP, showing the top 30 cells per moslin/CellRank 2 (ref [23]) computed terminal state. e UMAPs of aggregated fate probabilities towards ciliated neurons, non-ciliated neurons, and glia and excretory cells (Additional file 1: Fig. S11 and “Methods”), computed via absorption probabilities in CellRank 2 (“Methods”). f Scatter plot, showing the correlation of gene expression (GEX) with non-ciliated (x-axis) and ciliated (y-axis) neuronal fate probabilities. Annotated TFs are known to be involved in the developmental trajectory they correlate with (Additional file 3: Table S1). Right: UMAPs, showing expression of exemplary TFs. g Left: heatmap showing expression values for the top 50 predicted driver genes of non-ciliated neurons (all gene names shown in Additional file 1: Fig. S15). Each row corresponds to a gene, smoothed using fate probabilities (e) and the Palantir pseudotime [57] (x-axis; Additional file 1: Fig. S9). We annotate a few TFs, including cnd-1 [58, 59], fax-1 [60], and zag-1 [–63] (black), and other genes, including syg-1 [–66], madd-4 [–69], and flp-1 [60, 70] (gray), which are known to play important roles in establishing non-ciliated neurons (Additional file 3: Table S1). Right: UMAPs, showing expression of previously unknown predicted driver TFs
Fig. 4
Fig. 4
Moslin recovers lineage relations among transient fibroblast subsets. a Underlying data describes zebrafish heart regeneration, measured through single-cell transcriptomic and lineage profiling before injury (n = 4), at 3 dpi (n = 9), and 7 dpi (n = 7) [32]. Right-hand side projections show transcriptomic data over time (top) and a representative lineage tree for each time point (bottom). b Cell type persistence test: for each cell at t2, determine if the t1 cell with the highest transition probability to it is of the same cell type (“Methods”). Annotation colors indicate cell types as in a. c Transient fibroblast test: calculate proportion of ground truth ancestor cell types for transient col12a1a and nppc fibroblasts. Annotation colors indicate cell types as in a. Performance on transient fibroblast tests correlates with cell type persistence accuracy: col12a1a (d) and nppc (e). f Flow diagram of cell type transitions. Colors indicate cell types as in a. g Flow diagram of transient epicardial fibroblasts corroborates col11a1a fibroblasts as an intermediary state between constitutive and col12a1a fibroblasts. Colors indicate cell types as in a

Similar articles

Cited by

References

    1. Schiebinger G, et al. Optimal-transport analysis of single-cell gene expression identifies developmental trajectories in reprogramming. Cell. 2019;176:1517. - PMC - PubMed
    1. Fischer DS, et al. Inferring population dynamics from single-cell RNA-sequencing time series data. Nat Biotechnol. 2019;37:461–8. - PMC - PubMed
    1. Tong A, Huang J, Wolf G, van Dijk D, Krishnaswamy S. TrajectoryNet: a dynamic optimal transport network for modeling cellular dynamics. Proc Mach Learn Res. 2020;119:9526–36. - PMC - PubMed
    1. Guan J, et al. Chemical reprogramming of human somatic cells to pluripotent stem cells. Nature. 2022;605:325–31. - PubMed
    1. Pijuan-Sala B, et al. A single-cell molecular map of mouse gastrulation and early organogenesis. Nature. 2019;566:490–5. - PMC - PubMed

LinkOut - more resources