. 2024 Oct 21;22(1):952.
doi: 10.1186/s12967-024-05754-y.

Comprehensive multi-omics integration uncovers mitochondrial gene signatures for prognosis and personalized therapy in lung adenocarcinoma

Affiliations

Comprehensive multi-omics integration uncovers mitochondrial gene signatures for prognosis and personalized therapy in lung adenocarcinoma

Wenjia Zhang et al. J Transl Med. .

Abstract

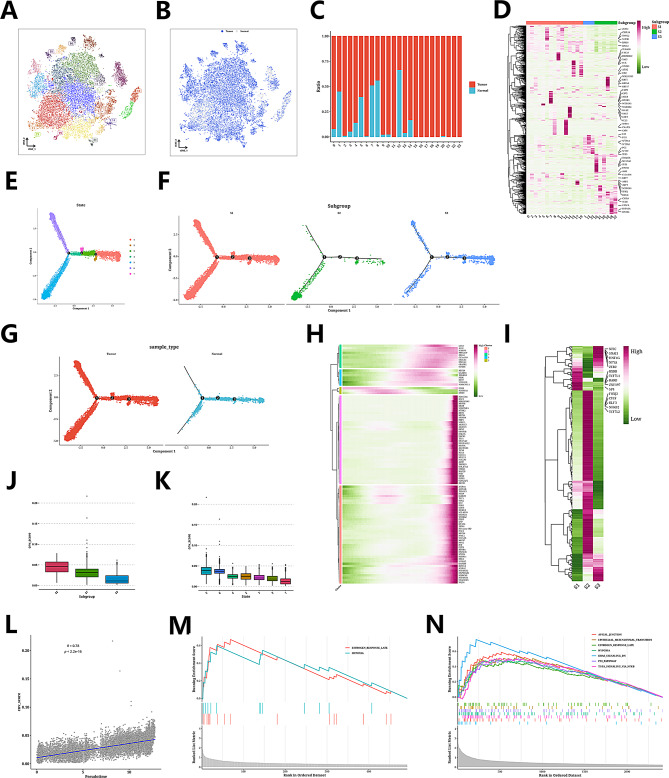
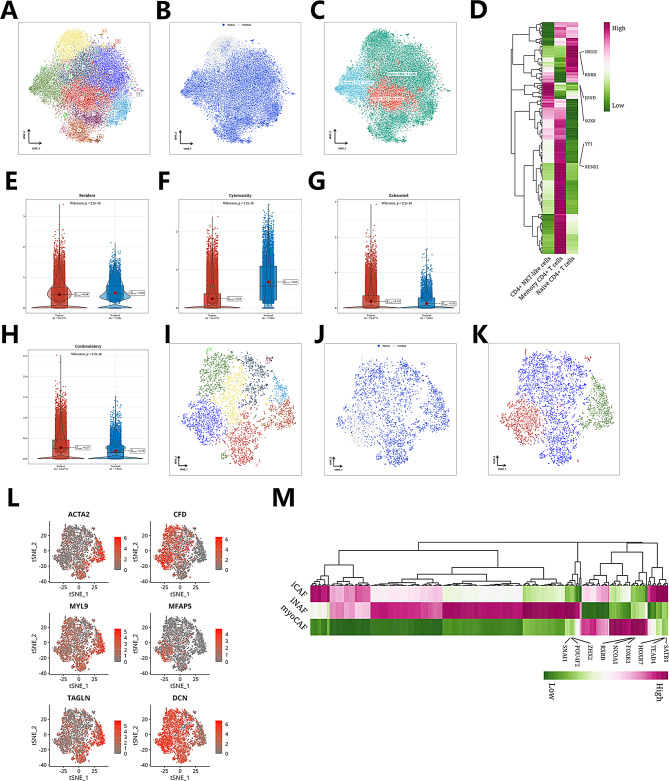
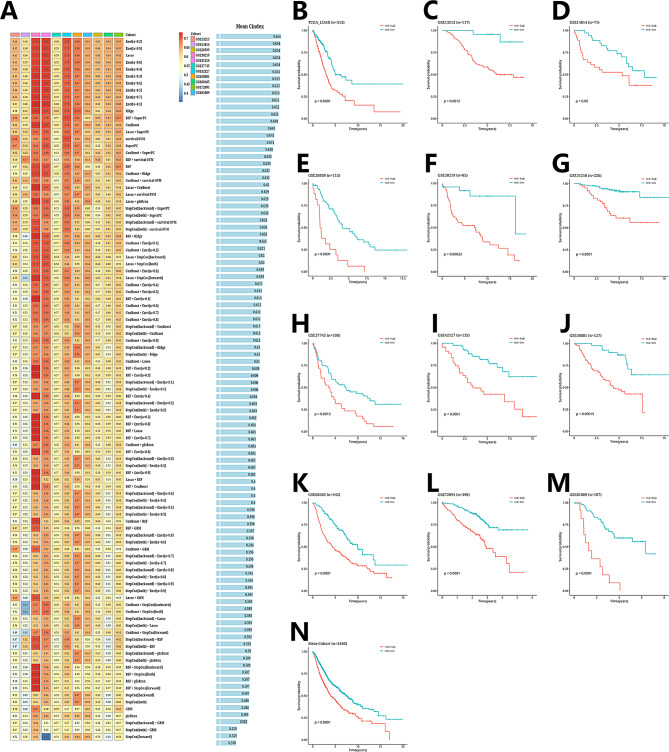
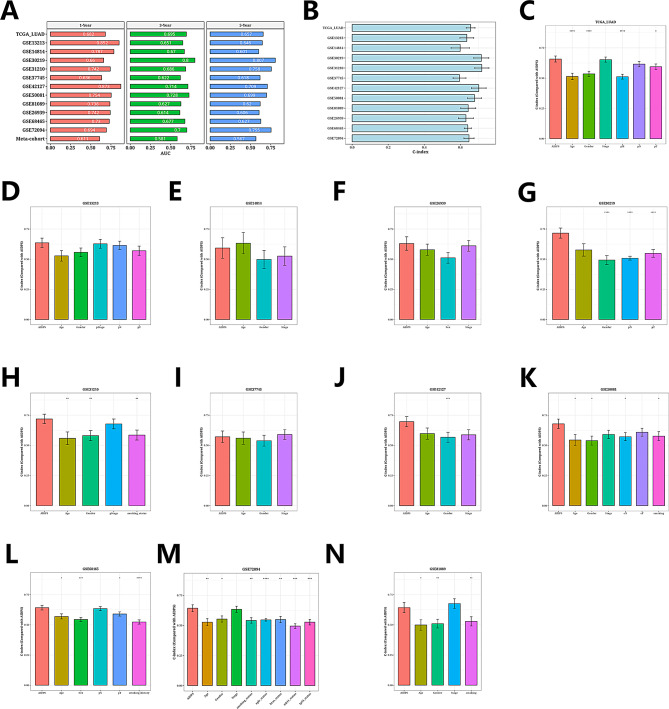
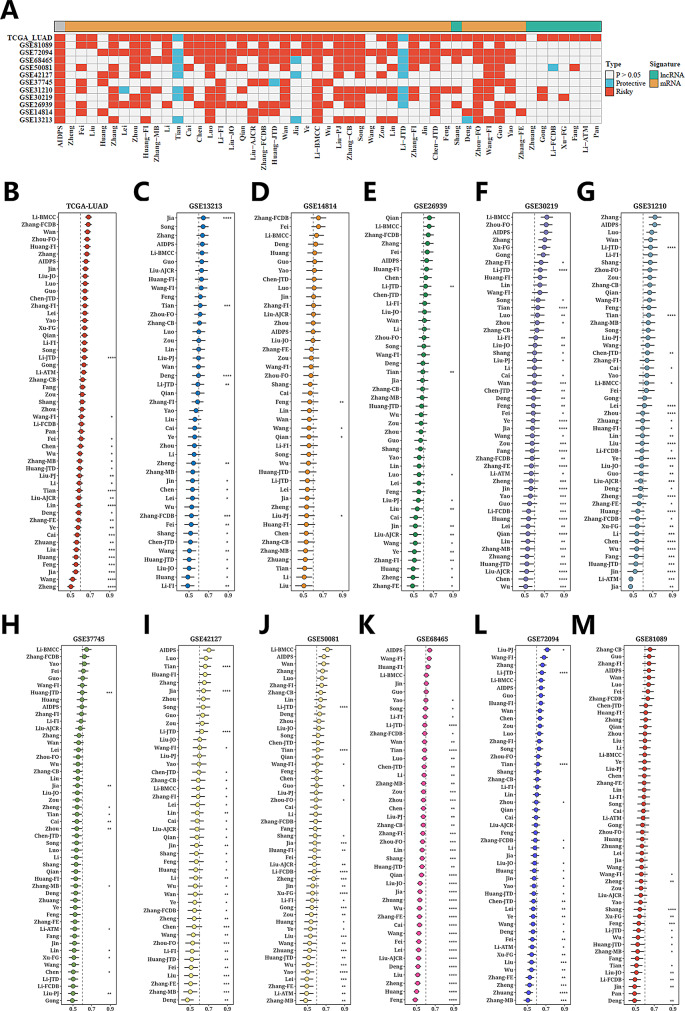
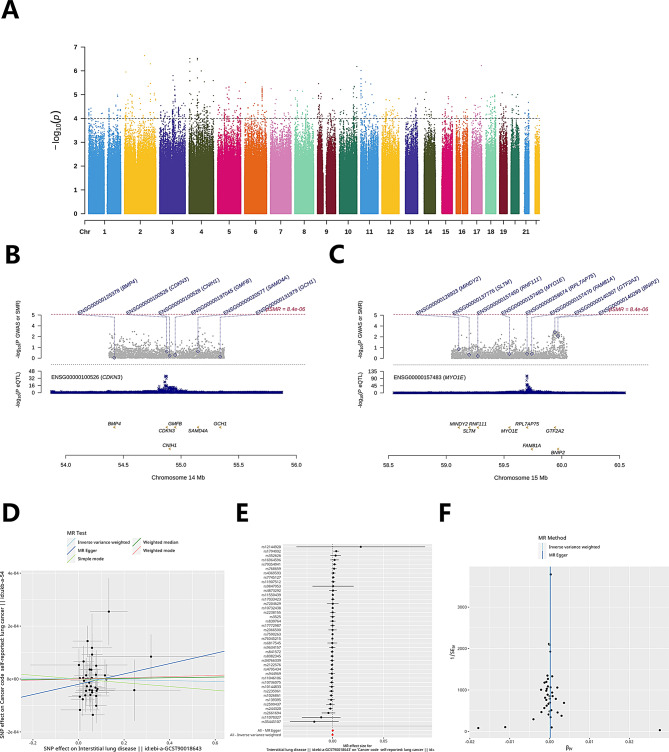
The therapeutic efficacy of lung adenocarcinoma (LUAD), the most prevalent histological subtype of primary lung cancer, remains inadequate, with accurate prognostic assessment posing significant challenges. This study sought to elucidate the prognostic significance of mitochondrial-related genes in LUAD through an integrative multi-omics approach, aimed at developing personalized therapeutic strategies. Utilizing transcriptomic and single-cell RNA sequencing (scRNA-seq) data, alongside clinical information from publicly available databases, we first applied dimensionality reduction and clustering techniques to the LUAD single-cell dataset, focusing on the subclassification of fibroblasts, epithelial cells, and T cells. Mitochondrial-related prognostic genes were subsequently identified using TCGA-LUAD data, and LUAD cases were stratified into distinct molecular subtypes through consensus clustering, allowing for the exploration of gene expression profiles and clinical feature distributions across subtypes. By leveraging an ensemble of machine learning algorithms, we developed an Artificial Intelligence-Derived Prognostic Signature (AIDPS) model based on mitochondrial-related genes and validated its prognostic accuracy across multiple independent datasets. The AIDPS model demonstrated robust predictive power for LUAD patient outcomes, revealing significant differences in responses to immunotherapy and chemotherapy, as well as survival outcomes between risk groups. Furthermore, we conducted comprehensive analyses of tumor mutation burden (TMB), immune microenvironment characteristics, and genome-wide association study (GWAS) data, providing additional insights into the mechanistic roles of mitochondrial-related genes in LUAD pathogenesis. This study not only offers a novel approach to improving prognostic assessments in LUAD but also establishes a strong foundation for the development of personalized therapeutic interventions.

Keywords: Lung adenocarcinoma; Machine learning; Mitochondrial-related genes; Prognostic model; Single nucleotide variation.


Conflict of interest statement

The authors declare that they have no conflicts of interest to report regarding the present study.

Figures

Fig. 1
Fig. 1
The workflow of this study
Fig. 2
Fig. 2
Single-cell classification results of LUAD. (A) t-SNE plots of LUAD single-cell data colored by clustering clusters. (B) tSNE plots of LUAD single-cell data colored by cell origins. (C) tSNE plots of LUAD single-cell data colored by clustering clusters and cell origins. (D) tSNE plots of LUAD single-cell data colored by cell types. (E) Bubble plot showing the expression of each marker in various cell types. (F) Bar graph showing the composition of cell types in each sample, with the first 11 being adjacent/normal samples and the remaining samples being tumor samples. (G) Box plot showing the composition of cells in tumor and adjacent groups
Fig. 3
Fig. 3
Subclassification analysis, cell trajectory analysis, and CNV analysis results of epithelial cells. (A) tSNE plots of epithelial cell data colored by clustering clusters. (B) tSNE plots of epithelial cell data colored by cell origins. (C) Bar graph showing the cell composition of each clustering cluster of epithelial cells. (D) Heat map clustering the expression levels of the top 50 markers for each clustering cluster. (E-G) Monocle2 trajectory plots based on epithelial cell data, colored by State, Subgroup, and cell origin, respectively. (H) Heat map showing the expression of 100 differentially expressed genes over pseudotime. (I) Heat map showing the transcription factor activity of each Subgroup. (J-K) Box plots of CNV scores for each State and cell classification Subgroup. (L) Scatter plot showing the correlation between pseudotime and CNV score. (M-N) Resulting plots of GSEA pathway analysis for S1 and S2
Fig. 4
Fig. 4
Single-cell analysis. (A) tSNE plots of T-cell data colored by clustering clusters and cell sources. (B) tSNE plots of cell types(Tumor or Normal). (C) tSNE plot of cell annotations after annotation using SCType software. (D) Heatmap of transcription factor activity for each immune cell type. (E-H) Boxplots of scores for resident, cytotoxic, exhausted, and costimulatory T-cells. (I-J) tSNE plots of fibroblast cell data colored by clustering clusters and cell sources. (K) tSNE plot of fibroblast cell annotations after annotation using specific markers. (L) tSNE expression plots of specific markers (“ACTA2,” “CFD,” “MYL9,” “MFAP5,” “TAGLN,” “DCN”) for fibroblast cells. (M) Heatmap of transcription factor activity for three types of CAF cells
Fig. 5
Fig. 5
Consistency Clustering Analysis and Acquisition of Mitochondrial-related Prognostic Gene Set Results. (A) HR forest plot of 220 prognostic genes. (B) Heatmap of consistency clustering analysis for LUAD. (C) Principal component analysis results. (D) Survival analysis results for clusters C1 and C2. (E) Heatmap of expression levels of 220 prognostic genes in TCGA data. (F-K) Statistical bar graphs of subtype results and some clinical indicators (T stage, N stage, M stage, stage, age, and survival status). (L-M) GSEA results for clusters C1 and C2
Fig. 6
Fig. 6
Construction Results of Risk Models Generated by Machine Learning-based Integrated Method. (A) Heatmap and average C-index bar graph of C-index in 101 machine learning prognostic models for 11 validation datasets. (B-M) Survival analysis results for TCGA training data and 11 validation datasets. (N) Survival analysis results for the merged dataset
Fig. 7
Fig. 7
Evaluation Analysis Results of AIDPS Model. (A) Bar graph of AUC values for each dataset at 1 year, 3 years, and 5 years. (B) Bar graph of C-index errors for each dataset. (C-J) C-index error bar graphs of AIDPS and other clinical indicators for TCGA training set and 11 validation datasets
Fig. 8
Fig. 8
Comparison with Other Literature-based Prognostic Models. (A) Heatmap of prognostic correlation in 12 datasets for 52 models reported in other literature along with the AIDPS model. (B-M) C-index error dot plots for each model in TCGA training set and 11 validation datasets
Fig. 9
Fig. 9
Analysis Results of Predicting Response to Immunotherapy/Chemotherapy in Risk Groups. (A-D) Violin plots showing differences in IC50 values for chemotherapy drugs (Bortezomib_1191, Docetaxel_1007, Sepantronium bromide_1941, Vinblastine_1004) between high and low-risk groups. (E) Violin plot showing differences in TIDE values in TCGA data between risk groups. (F) Survival analysis results combining risk groups and immune response status. (G) Bar graph showing the proportion of immune response status in risk groups. (H) Survival analysis results using the AIDPS prognostic model in the IMvigor210 dataset. (I) Bar graph showing the proportion of immune response status in risk groups in the IMvigor210 dataset. (J) Heatmap showing the correlation between risk values and immune checkpoint gene expression
Fig. 10
Fig. 10
Analysis Results of SNV Mutation and Immune Microenvironment Differences. (A) Waterfall plot of SNV mutations in two sample groups. (B-D) Boxplots showing differences in TMB, MATH, and HRD values between the two groups. (E) Boxplots showing differences in the content of 22 immune cell types obtained by CIBERSORT algorithm between the two groups. (F-H) Violin plots showing differences in 3 indices calculated by the ESTIMATE algorithm between the two groups
Fig. 11
Fig. 11
Genetic Association and MR Analysis Results. (A) Manhattan plot of GWAS data for lung cancer. (B-C) Co-localization analysis results for two prognostic model genes (CDKN3, MYO1E). (D-F) Mendelian randomization analysis results for interstitial lung disease (ebi-a-GCST90018643) and lung cancer (ukb-a-54) by constructing Cox gene corresponding SNP sites, including scatter plots, funnel plots, and forest plots

References

    1. Sung H, Ferlay J, Siegel RL, Laversanne M, Soerjomataram I, Jemal A, Bray F. Global Cancer statistics 2020: GLOBOCAN estimates of incidence and Mortality Worldwide for 36 cancers in 185 countries. Cancer J Clin. 2021;71(3):209–49. - PubMed
    1. Jhala H, Harling L, Rodrigo A, Nonaka D, McLean E, Ng W, et al. Clinicopathological predictors of survival in resected primary lung adenocarcinoma. J Clin Pathol. 2022;75(5):310–5. - PMC - PubMed
    1. Shu J, Jiang J, Zhao G. Identification of novel gene signature for lung adenocarcinoma by machine learning to predict immunotherapy and prognosis. Front Immunol. 2023;14:1177847. - PMC - PubMed
    1. Smith ALM, Whitehall JC, Greaves LC. Mitochondrial DNA mutations in ageing and cancer. Mol Oncol. 2022;16(18):3276–94. - PMC - PubMed
    1. Xu Y, Krishnan A, Wan XS, Majima H, Yeh CC, Ludewig G, et al. Mutations in the promoter reveal a cause for the reduced expression of the human manganese superoxide dismutase gene in cancer cells. Oncogene. 1999;18(1):93–102. - PubMed

LinkOut - more resources