. 2024 Oct 21;12(1):208.
doi: 10.1186/s40168-024-01932-8.

Host-microbe interaction-mediated resistance to DSS-induced inflammatory enteritis in sheep

Affiliations

Host-microbe interaction-mediated resistance to DSS-induced inflammatory enteritis in sheep

Shuo Yan et al. Microbiome. .

Abstract

Background: The disease resistance phenotype is closely related to immunomodulatory function and immune tolerance and has far-reaching implications in animal husbandry and human health. Microbes play an important role in the initiation, prevention, and treatment of diseases, but the mechanisms of host-microbiota interactions in disease-resistant phenotypes are poorly understood. In this study, we hope to uncover and explain the role of microbes in intestinal diseases and their mechanisms of action to identify new potential treatments.

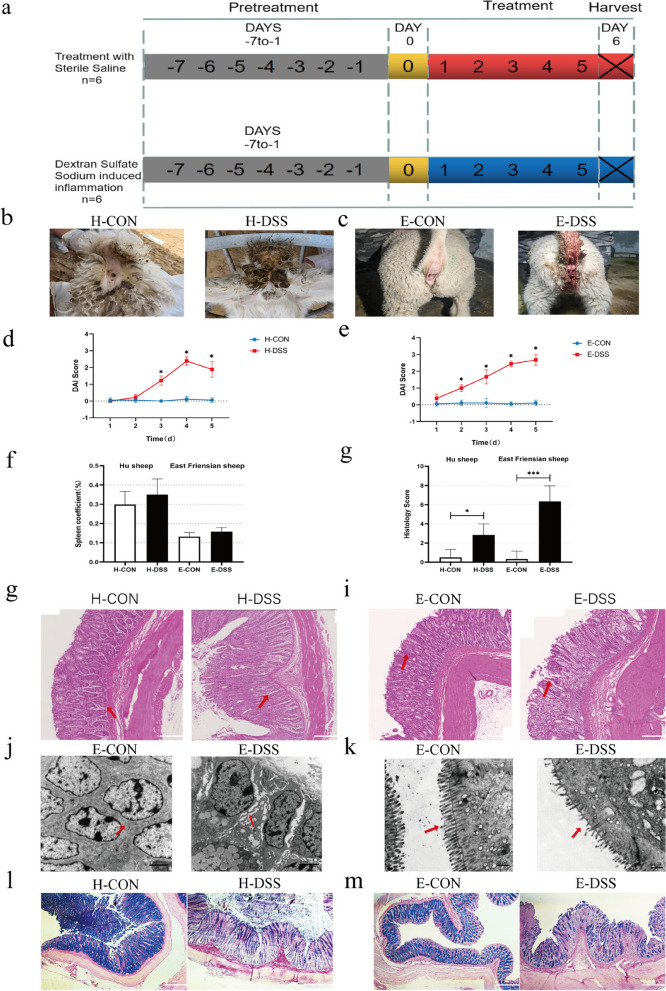
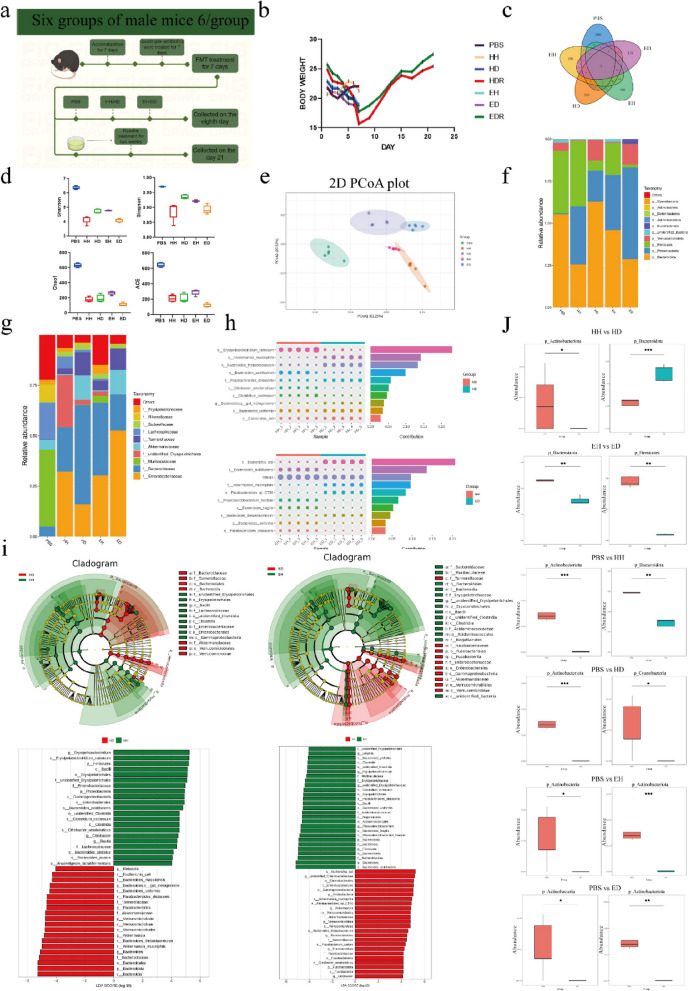
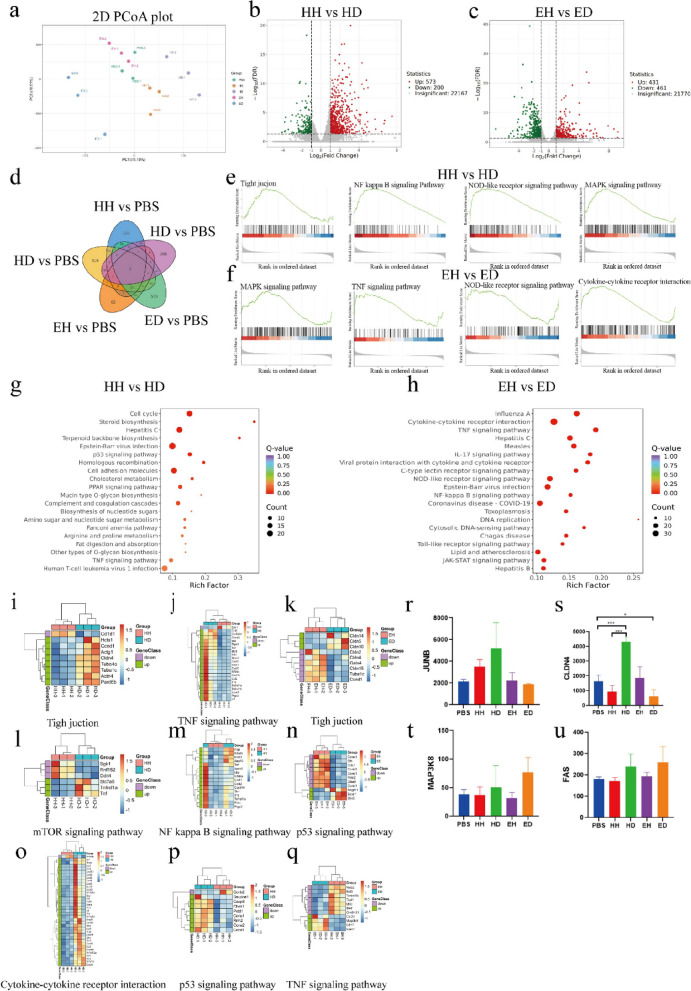
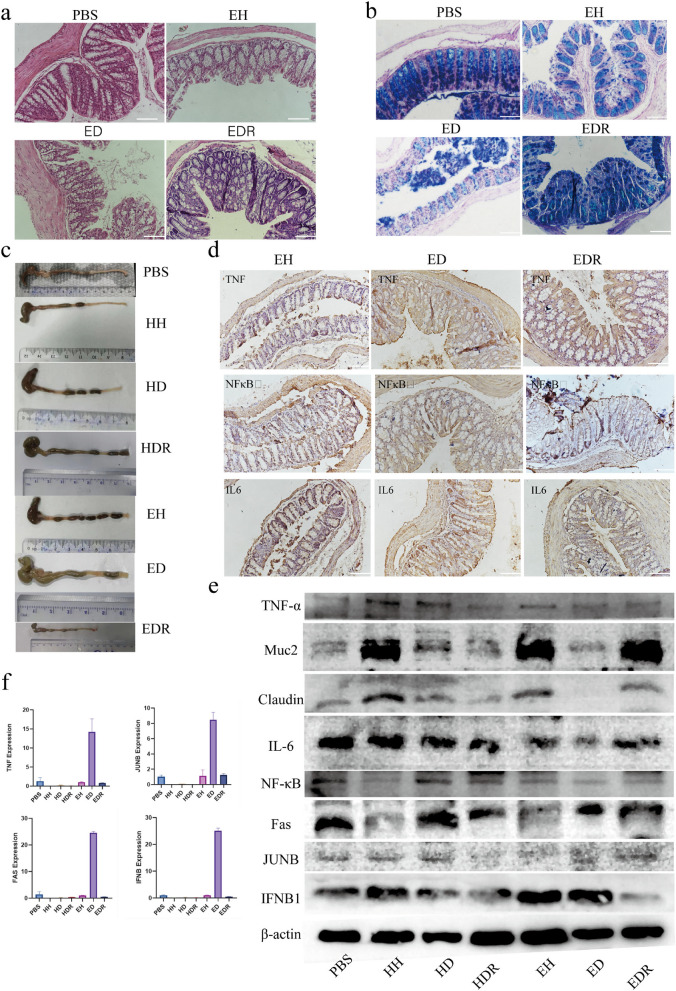
Methods: First, we established the colitis model of DSS in two breeds of sheep and then collected the samples for multi-omics testing including metagenes, metabolome, and transcriptome. Next, we made the fecal bacteria liquid from the four groups of sheep feces collected from H-CON, H-DSS, E-CON, and E-DSS to transplant the fecal bacteria into mice. H-CON feces were transplanted into mice named HH group and H-DSS feces were transplanted into mice named HD group and Roseburia bacteria treatment named HDR groups. E-CON feces were transplanted into mice named EH group and E-DSS feces were transplanted into mice in the ED group and Roseburia bacteria treatment named EDR groups. After successful modeling, samples were taken for multi-omics testing. Finally, colitis mice in HD group and ED group were administrated with Roseburia bacteria, and the treatment effect was evaluated by H&E, PAS, immunohistochemistry, and other experimental methods.

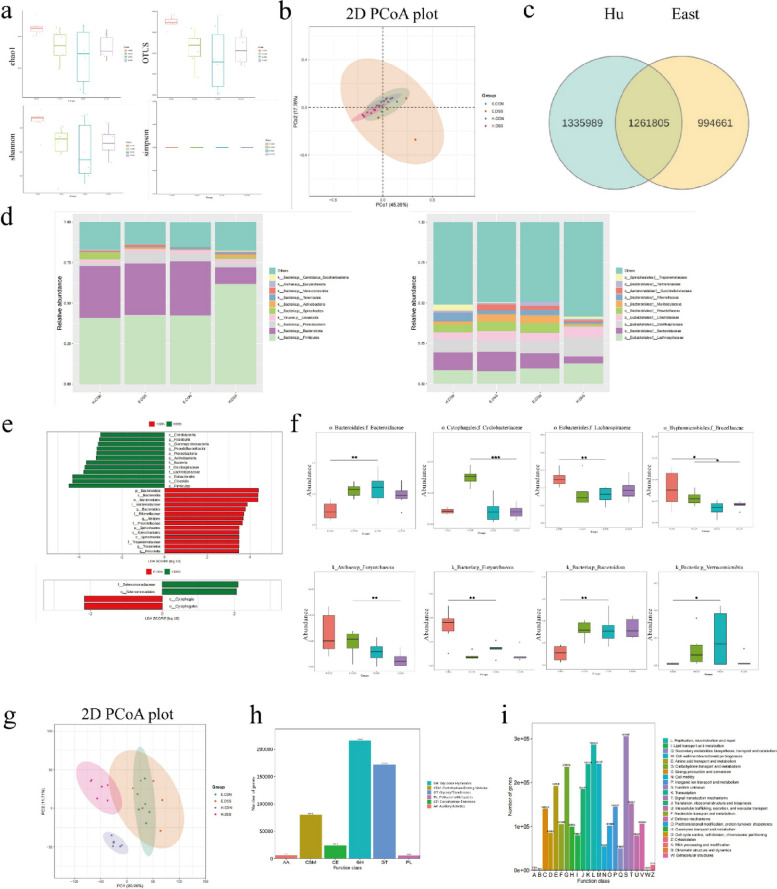
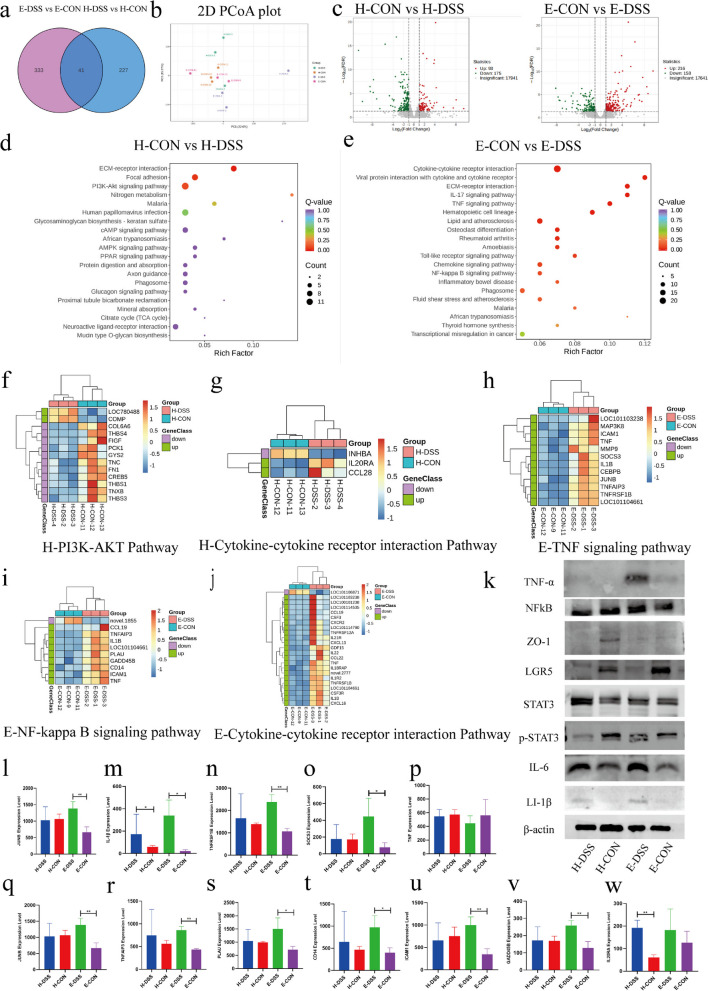
Results: The difference in disease resistance of sheep to DSS-induced colitis disease is mainly due to the increase in the abundance of Roseburia bacteria and the increase of bile acid secretion in the intestinal tract of Hu sheep in addition to the accumulation of potentially harmful bacteria in the intestine when the disease occurs, which makes the disease resistance of Hu sheep stronger under the same disease conditions. However, the enrichment of harmful microorganisms in East Friesian sheep activated the TNFα signalling pathway, which aggravated the intestinal injury, and then the treatment of FMT mice by culturing Roseburia bacteria found that Roseburia bacteria had a good curative effect on colitis.

Conclusion: Our study showed that in H-DSS-treated sheep, the intestinal barrier is stabilized with an increase in the abundance of beneficial microorganisms. Our data also suggest that Roseburia bacteria have a protective effect on the intestinal barrier of Hu sheep. Accumulating evidence suggests that host-microbiota interactions are associated with IBD disease progression. Video Abstract.

Keywords: Roseburia bacteria; Fecal microbiota transplantation (FMT); Gut microbiota; Intestinal inflammation.


Conflict of interest statement

The authors declare no competing interests.

Figures

Fig. 1
Fig. 1
Study design for the experiment using East Friesian sheep. a Control group of Hu sheep and the model group of Hu sheep with acute colitis (H-CON and H-DSS); control group of East Friesian sheep and the model group of East Friesian sheep with acute colitis (E-CON and E-DSS) (n = 6). b Phenotypic images of the control group and the DSS group. c Phenotypic diagram of the East Friesian sheep control group and the DSS group. d DAI of the Hu sheep control group and the DSS group (n = 6). e DAI of the East Friesian sheep control group and the DSS group (n = 6). f Spleen coefficient (n = 6). g Histology score. h H&E tissue sections of Hu sheep colon. i H&E tissue sections of East Friesian sheep colon. j, k Transmission electron microscopy tissue sections of East Friesian sheep colon. l AB-PAS tissue sections of Hu sheep colon. m AB-PAS tissue sections of East Friesian sheep colon (*P < 0.05, **P < 0.01, ***P < 0.001)
Fig. 2
Fig. 2
Microbial results for Hu sheep and East Friesian sheep.α diversity of Hu sheep and East Friesian sheep. β diversity of Hu sheep and East Friesian sheep. c Venn diagram of Hu sheep and East Friesian sheep microorganisms. d Changes in microbial abundance at the phylum and genus levels. e Fold change diagram of differential microorganisms between Hu sheep and East Friesian sheep. f Box plot of microbial changes. g PCA diagram of microbial function. h, i Functional enrichment map of microbial genes (*P < 0.05, **P < 0.01)
Fig. 3
Fig. 3
RNA-seq analysis was used to explore the mechanism underlying the disease resistance phenotype in the two sheep breeds. a Venn diagram of differentially expressed genes. b PCA map of differentially expressed genes. c Volcano plot of differentially expressed genes. d KEGG enrichment map of differentially expressed genes in Hu sheep. e KEGG enrichment map of differentially expressed genes in East Friesian sheep. f Gene heatmap of the PI3K-AKT pathway in Hu sheep. g Gene heatmap of the cytokine‒cytokine signalling pathway in Hu sheep. h Gene heatmap of the TNF signalling pathway in East Friesian sheep. i Gene heatmap of the NF-kappa B signalling pathway in East Friesian sheep. j Gene heatmap of the cytokine‒cytokine signalling pathway in East Friesian sheep. k Western blotting was used to validate the immune status and intestinal structure in sheep. l–w Relative RNA expression of differentially differentiated genes. The data are presented as the mean ± SEM (n = 3 mice per group) (*P < 0.05, **P < 0.01)
Fig. 4
Fig. 4
Remodelling of the mouse gut microbiome. a Experimental treatment and grouping were performed as follows: PBS, normal control group (not treated); HH, H-CON feces gavage for 7 days; HD, H-DSS feces gavage for 7 days; HDR, H-DSS feces gavage for 7 days; Roseburia gavage for 14 days; EH, E-CON feces gavage for 7 days; ED, E-DSS feces gavage for 7 days; and EDR, E-DSS feces gavage for 7 days; Roseburia gavage for 14 days. b Weight change (n = 6). c Venn diagram of differential microorganisms in FMT mice. α diversity of mice. eβ diversity of mice; f, g Changes in microbial abundance at the phylum and genus levels. h Fold change diagram of differential microorganisms between HH and HD, EH, and ED. i Fold change plot of differential microorganisms in LEfSe mice. j Box diagram of differentially abundant microbes in mice (*P < 0.05, **P < 0.01)
Fig. 5
Fig. 5
RNA-seq analysis was used to explore the mechanism underlying the disease resistance phenotype in mice. a PCA map of DEGs. b Volcano plot of HH and HD DEGs. c Volcano plot of EH and ED DEGs. d Venn diagram of DEGs. d GSEA diagram of HH and HD DEGs. f GSEA diagram of EH and ED DEGs. g KEGG enrichment map of HH and HD DEGs. h KEGG enrichment map of EH and ED DEGs. i Gene heatmap of the tight junction pathway in HH and HD. j Gene heatmap of the TNF signalling pathway in HH and HD. k Gene heatmap of the tight junction pathway in EH and ED. l Gene heatmap of the mTOR signalling pathway in HH and HD. m Gene heatmap of the NF-kappa B signalling pathway in HH and HD. n Gene heatmap of the p53 signalling pathway in EH and ED. o Gene heatmap of the cytokine‒cytokine receptor interaction in HH and HD. p Gene heatmap of the p53 signalling pathway in HH and HD. q Gene heatmap of the TNF signalling pathway in EH and ED. r Relative expression of JUNB. s The data are presented as the mean ± SEM (n = 6 mice per group). *P < 0.05, **P < 0.01, *** P < 0.001 were determined by one-way ANOVA with Bonferroni’s multiple comparisons test
Fig. 6
Fig. 6
Therapeutic effect of Roseburia bacteria on DSS-induced colitis. a H&E tissue sections of mice. b AB-PAS tissue sections of mice. c Mouse colon length. d Mouse immunohistochemistry results. e Western blotting was used to validate the immune status and intestinal structure in mice. f Relative RNA expression

References

    1. Zhernakova A, et al. Population-based metagenomics analysis reveals markers for gut microbiome composition and diversity. Science. 2016;352:565–9. 10.1126/science.aad3369. - PMC - PubMed
    1. Chen L, et al. The long-term genetic stability and individual specificity of the human gut microbiome. Cell. 2021;184:2302-2315.e2312. 10.1016/j.cell.2021.03.024. - PubMed
    1. Schirmer M, Garner A, Vlamakis H, Xavier RJ. Microbial genes and pathways in inflammatory bowel disease. Nat Rev Microbiol. 2019;17:497–511. 10.1038/s41579-019-0213-6. - PMC - PubMed
    1. Zhao X, et al. Host-microbiota interaction-mediated resistance to inflammatory bowel disease in pigs. Microbiome. 2022;10. 10.1186/s40168-022-01303-1. - PMC - PubMed
    1. de Vos WM, Tilg H, Van Hul M, Cani PD. Gut microbiome and health: mechanistic insights. Gut. 2022;71:1020–32. 10.1136/gutjnl-2021-326789. - PMC - PubMed

Substances

LinkOut - more resources