. 2024 Dec 1;110(12):7701-7719.
doi: 10.1097/JS9.0000000000002116.

METTL16 inhibits pancreatic cancer proliferation and metastasis by promoting MROH8 RNA stability and inhibiting CAPN2 expression - experimental studies

Affiliations

METTL16 inhibits pancreatic cancer proliferation and metastasis by promoting MROH8 RNA stability and inhibiting CAPN2 expression - experimental studies

Tingzhuang Yi et al. Int J Surg. .

Abstract

Background: N6-methyladenosine (m6A) modification plays a crucial role in the progression of various cancers, including pancreatic cancer, by regulating gene expression. However, the specific mechanisms by which m6A affects pancreatic cancer metastasis remain unclear. This study aims to elucidate the role of METTL16, an m6A writer gene, in regulating core genes such as CAPN2 and MROH8, influencing tumor growth and metastasis.

Materials and methods: Transcriptomic data from pancreatic cancer patients in The Cancer Genome Atlas (TCGA) were analyzed to identify m6A-related genes. We performed correlation and survival analyses to uncover core genes influenced by m6A expression. Functional assays, including METTL16 knockdown and overexpression experiments, were conducted in pancreatic cancer cell lines, patient-derived organoids, and animal models. Immunofluorescence, co-immunoprecipitation (Co-IP), and m6A-specific quantitative PCR were used to validate protein interactions and m6A modifications. Chromatin immunoprecipitation (ChIP) analysis was utilized to investigate transcription factor binding at gene promoter regions.

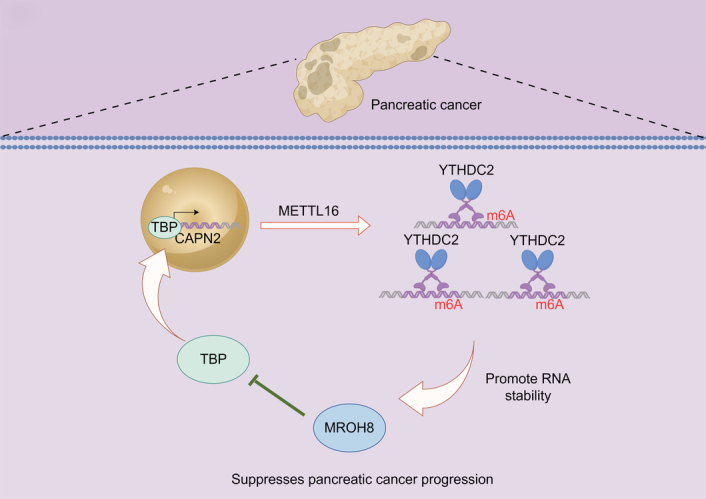
Results: METTL16 and METTL3 were identified as key m6A regulators associated with improved prognosis in pancreatic cancer patients ( P <0.05). CAPN2, CHMP2B, ITGA3, ITGA6, ITPR1, and RAC1 were identified as core genes linked to m6A expression, all significantly correlated with patient prognosis ( P <0.05). METTL16 overexpression significantly inhibited tumor growth and metastasis ( P <0.001) by downregulating CAPN2 through an indirect mechanism involving the transcription factor TBP and the gene MROH8. MROH8 negatively regulated CAPN2 by promoting TBP degradation, with METTL16 enhancing MROH8 mRNA stability through m6A modifications ( P <0.01). Functional assays demonstrated that METTL16 and YTHDC2 (an m6A reader) collaboratively enhanced MROH8 mRNA stability, thereby inhibiting CAPN2 expression and reducing tumor proliferation and metastasis ( P <0.001).

Conclusion: This study reveals a novel regulatory axis involving METTL16, MROH8, and TBP that modulates CAPN2 expression, contributing to the suppression of pancreatic cancer progression. The METTL16-MROH8-TBP-CAPN2 pathway offers potential therapeutic targets for pancreatic cancer treatment, highlighting the significance of m6A modifications in tumor regulation. Further clinical validation is needed to confirm these findings in human patients.


Conflict of interest statement

The authors declare no conflicts of interest.

Sponsorships or competing interests that may be relevant to content are disclosed at the end of this article.

Figures

Figure 1
Figure 1
Research flowchart. ChIP, chromatin immunoprecipitation; Co-IP, co-immunoprecipitation; GEPIA, gene expression profiling interactive analysis; H&E, hematoxylin and eosin; IF, immunofluorescence; IHC, immunohistochemistry; MeRIP-qPCR, methylated RNA immunoprecipitation followed by quantitative polymerase chain reaction; PDOX, patient-derived orthotopic xenograft; PPI, protein–protein interaction; TCGA: The Cancer Genome Atlas; WB, Western blot.
Figure 2
Figure 2
METTL16 and CAPN2 can interact and influence the prognosis of pancreatic cancer patients. (A) The left panel shows the high and low expression of the m6A writer gene METTL16 and its association with patient prognosis in the TCGA database. The right panel shows the high and low expression of the m6A writer gene METTL3 and its association with patient prognosis in the TCGA database. (B) Protein interaction plots show the correlation analysis between m6A-related genes and the expression levels of other mRNAs. (C) High and low expression of CAPN2, CHPM2B, ITGA3, ITGA8, ITPR1, and RAC1 in the TCGA database and their association with patient prognosis. (D) Comparison of the expression levels of CAPN2, CHPM2B, ITGA3, ITGA8, ITPR1, and RAC1 across stages 1, 2, 3, and 4 in the TCGA database. (E), Comparison of the expression levels of METTL16, METTL3, CAPN2, CHPM2B, ITGA3, ITGA8, ITPR1, and RAC1 in paraneoplastic and carcinoma tissues in the TCGA database. (F), RT-qPCR comparison of METTL16, METTL3, CAPN2, CHPM2B, ITGA3, ITGA8, ITPR1, and RAC1 expression levels in cell lines HPDE6c7, ASPC1, BXPC3, CAPAN1, CAPAN2, and CFPAC1. (G) Representative images of immunofluorescence showing METTL16 and CAPN2 expression in pancreatic cancer patients. (H) Statistical analysis of positive cells from panel G.
Figure 3
Figure 3
METTL16 suppresses the proliferation of human pancreatic cancer organoids and subcutaneous tumors. (A) Representative images showing the effect of METTL16 knockdown on human pancreatic cancer organoid formation. (B) Bar graph showing the quantification of organoid formation in panel A. (C) Representative images showing the effect of METTL16 overexpression on human pancreatic cancer organoid formation. (D) Bar graph showing the quantification of organoid formation in panel C. (E) Representative immunofluorescence images showing the effect of METTL16 knockdown on KI67 expression in human pancreatic cancer organoids. (F) Bar graph showing the quantification of KI67 expression in panel E. (G) Representative immunofluorescence images showing the effect of METTL16 overexpression on KI67 expression in human pancreatic cancer organoids. (H) Bar graph showing the quantification of KI67 expression in panel G. (I) Representative images showing tumor size following subcutaneous injection of human pancreatic cancer organoids with METTL16 knockdown or overexpression. (J) Bar graph showing tumor size quantification after METTL16 knockdown from panel I. (K) Bar graph showing tumor size quantification after METTL16 overexpression from panel I. (L) Representative immunofluorescence images showing the effect of METTL16 knockdown on KI67 expression in subcutaneous tumors derived from human pancreatic cancer organoids. (M) Bar graph showing the quantification of KI67 expression in panel L. (N) Representative immunofluorescence images showing the effect of METTL16 overexpression on KI67 expression in subcutaneous tumors derived from human pancreatic cancer organoids. (O) Bar graph showing the quantification of KI67 expression in panel N. * P<0.05, ** P<0.01, *** P<0.001.
Figure 4
Figure 4
Capn2 promotes the proliferation of human pancreatic cancer organoids and subcutaneous tumors. (A) Representative images showing the effect of Capn2 knockdown on human pancreatic cancer organoid formation. (B) Bar graph showing the quantification of organoid formation in panel A. (C) Representative images showing the effect of Capn2 overexpression on human pancreatic cancer organoid formation. (D) Bar graph showing the quantification of organoid formation in panel C. (E) Representative immunofluorescence images showing the effect of Capn2 knockdown on KI67 expression in human pancreatic cancer organoids. (F) Bar graph showing the quantification of KI67 expression in panel E. (G) Representative immunofluorescence images showing the effect of Capn2 overexpression on KI67 expression in human pancreatic cancer organoids. (H) Bar graph showing the quantification of KI67 expression in panel G. (I) Representative images showing tumor size following subcutaneous injection of human pancreatic cancer organoids with Capn2 knockdown or overexpression. (J) Bar graph showing tumor size quantification after Capn2 knockdown from panel I. (K) Bar graph showing tumor size quantification after Capn2 overexpression from panel I. (L) Representative immunofluorescence images showing the effect of Capn2 knockdown on KI67 expression in subcutaneous tumors derived from human pancreatic cancer organoids. (M) Bar graph showing the quantification of KI67 expression in panel L. (N) Representative immunofluorescence images showing the effect of Capn2 overexpression on KI67 expression in subcutaneous tumors derived from human pancreatic cancer organoids. (O) Bar graph showing the quantification of KI67 expression in panel N. * P<0.05, ** P<0.01, *** P<0.001.
Figure 5
Figure 5
Illustrates that METTL16 can inhibit the function of CAPN2. (A) Representative images comparing the impact of CAPN2 and METTL16 knockdown on organoid formation in human pancreatic cancer-like organs. (B) Statistical bar graph of organoid formation from panel A. (C) Representative images comparing immunofluorescence of Ki67 expression in human pancreatic cancer-like organs following CAPN2 and METTL16 knockdown. (D) Statistical bar graph of organoid Ki67 expression from panel C. (E) Representative images comparing the impact of CAPN2 and METTL16 overexpression on organoid formation in human pancreatic cancer-like organs. (F) Statistical bar graph of organoid formation from panel E. (G) Representative images comparing immunofluorescence of Ki67 expression in human pancreatic cancer-like organs following CAPN2 and METTL16 overexpression. (H) Statistical bar graph of organoid Ki67 expression from panel G. (I) RT-qPCR comparison of METTL16 and CAPN2 mRNA levels after METTL16 overexpression. (J) RT-qPCR comparison of METTL16 and CAPN2 mRNA levels after METTL16 overexpression. (K) Immunofluorescence comparison of METTL16 and CAPN2 levels and colocalization after METTL16 overexpression. (L) Quantification of cell numbers expressing CAPN2. (M) Immunofluorescence comparison of METTL16 and CAPN2 levels and colocalization after CAPN2 overexpression. (N) Quantification of cell numbers expressing METTL16. (O) Correlation analysis of METTL16 and CAPN2 expression levels in the TCGA database. * P<0.05, ** P<0.01, *** P<0.001.
Figure 6
Figure 6
METTL16 promotes the function of MROH8. (A) Bar chart of mRNA expression levels positively correlated with METTL16 expression in TCGA database. (B) Bar chart of mRNA expression levels negatively correlated with CAPN2 expression in TCGA database. (C) Scatter plot showing the correlation between METTL16 and MROH8 expression in TCGA database. (D) Scatter plot showing the correlation between CAPN2 and MROH8 expression in TCGA database. (E) Survival analysis of high and low MROH8 mRNA expression levels in TCGA database. (F) Representative image comparing the effects of MROH8 overexpression on organ formation in human pancreatic cancer cells. (G) Bar chart of organ formation statistics in the F figure. (H) Comparison of mRNA levels of METTL16, MROH8, and CAPN2 after METTL16 overexpression using RT-qPCR. (I) Comparison of mRNA levels of METTL16, MROH8, and CAPN2 after METTL16 knockdown using RT-qPCR. (J) Comparison of mRNA levels of METTL16, MROH8, and CAPN2 after MROH8 overexpression using RT-qPCR. (K) Comparison of mRNA levels of METTL16, MROH8, and CAPN2 after MROH8 knockdown using RT-qPCR. (L) Comparison of mRNA levels of METTL16, MROH8, and CAPN2 after METTL16 overexpression and MROH8 knockdown using RT-qPCR. (M) Comparison of mRNA levels of METTL16, MROH8, and CAPN2 after MROH8 overexpression and METTL16 knockdown using RT-qPCR. * P<0.05, ** P<0.01, *** P<0.001.
Figure 7
Figure 7
METTL16 and YTHDC2 promote the mRNA stability of MROH8 through m6A modification. (A) Comparison of the related m6A levels of MROH8 after METTL16 overexpression and knockdown in human pancreatic cancer organoids. (B) Comparison of the related m6A levels of MROH8 after METTL16 overexpression and knockdown in PANC1 pancreatic cancer cell line. (C) Comparison of METTL16 levels related to MROH8 in pancreatic cancer organoids using METTL16 RIP-qPCR. (D) Comparison of METTL16 levels related to MROH8 in PANC1 pancreatic cancer cell line using METTL16 RIP-qPCR. (E) mRNA stability of MROH8 after METTL16 overexpression in human pancreatic cancer organoids. (F) mRNA stability of MROH8 after METTL16 overexpression in PANC1 pancreatic cancer cell line. (G) mRNA stability of MROH8 after METTL16 knockdown in human pancreatic cancer organoids. (H) mRNA stability of MROH8 after METTL16 knockdown in PANC1 pancreatic cancer cell line. (I) Correlation between m6A reader YTHDC2 and MROH8 mRNA expression levels in TCGA database. (J) Comparison of MROH8 mRNA levels after YTHDC2 overexpression using RT-qPCR. (K) Comparison of MROH8 mRNA levels after YTHDC2 knockdown using RT-qPCR. (L) mRNA stability of MROH8 after YTHDC2 overexpression in human pancreatic cancer organoids. (M) mRNA stability of MROH8 after YTHDC2 overexpression in PANC1 pancreatic cancer cell line. (N) mRNA stability of MROH8 after YTHDC2 knockdown in human pancreatic cancer organoids. (O) mRNA stability of MROH8 after YTHDC2 knockdown in PANC1 pancreatic cancer cell line. * P<0.05, ** P<0.01, *** P<0.001.
Figure 8
Figure 8
MROH8 binds to TBP causing its protein degradation. (A) Signal pathway analysis comparing MROH8 knockdown and control group. (B) Differential protein analysis heatmap of MROH8 knockdown and control group through proteomic analysis. (C) Western blot comparison of TBP and MROH8 expression levels after MROH8 overexpression. (D) Western blot comparison of TBP and MROH8 expression levels after MROH8 knockdown. (E) CO-IP comparison of MROH8 and TBP protein interactions. (F) Western blot comparison of MROH8 and TBP protein levels at different time points after doxycycline withdrawal. (G) RT-qPCR comparison of MROH8 and TBP mRNA levels at different time points after doxycycline withdrawal.
Figure 9
Figure 9
TBP affects CAPN2 translation by binding to its promoter. (A) RT-qPCR comparison of CAPN2 mRNA levels after TBP knockdown and overexpression. (B) Chip comparison of TBP overexpression and knockdown with CAPN2 promoter binding. (C) Representative image of the effects of CAPN2 knockdown on lung metastasis in mice via tail vein injection. (D) Bar chart of statistical analysis of lung metastatic foci in C figure. (E) Representative images of H&E staining of lung metastatic tumors in C figure using immunohistochemistry. (F) Representative images of Ki67 and CAPN2 staining of lung metastatic tumors in C figure using immunohistochemistry. (G) Bar chart of statistical analysis of Ki67-positive cells in F figure. (H) Bar chart of statistical analysis of CAPN2-positive cells in F figure. * P<0.05, ** P<0.01, *** P<0.001.
Figure 10
Figure 10
Mechanism overview diagram.

References

    1. Wainberg ZA, Melisi D, Macarulla T, et al. . NALIRIFOX versus nab-paclitaxel and gemcitabine in treatment-naive patients with metastatic pancreatic ductal adenocarcinoma (NAPOLI 3): a randomised, open-label, phase 3 trial. Lancet (London, England) 2023;402:1272–1281. - PMC - PubMed
    1. Rawla P, Sunkara T, Gaduputi V. Epidemiology of pancreatic cancer: global trends, etiology and risk factors. World J Oncol 2019;10:10–27. - PMC - PubMed
    1. Chen S, Yang C, Wang ZW, et al. . CLK1/SRSF5 pathway induces aberrant exon skipping of METTL14 and Cyclin L2 and promotes growth and metastasis of pancreatic cancer. J Hematol Oncol 2021;14:60. - PMC - PubMed
    1. Scotti MM, Swanson MS. RNA mis-splicing in disease. Nat Rev Genet 2016;17:19–32. - PMC - PubMed
    1. Ping XL, Sun BF, Wang L, et al. . Mammalian WTAP is a regulatory subunit of the RNA N6-methyladenosine methyltransferase. Cell Res 2014;24:177–189. - PMC - PubMed