. 2024 Aug 8;6(11):101184.
doi: 10.1016/j.jhepr.2024.101184. eCollection 2024 Nov.

Albumin reprograms the B cell transcriptional landscape and improves neutrophil antimicrobial function in patients with decompensated cirrhosis

Affiliations

Albumin reprograms the B cell transcriptional landscape and improves neutrophil antimicrobial function in patients with decompensated cirrhosis

Joan Clària et al. JHEP Rep. .

Abstract

Background & aims: Patients with acutely decompensated (AD) cirrhosis are immunocompromised and particularly susceptible to infections. This study investigated the immunomodulatory actions of albumin by which this protein may lower the incidence of infections.

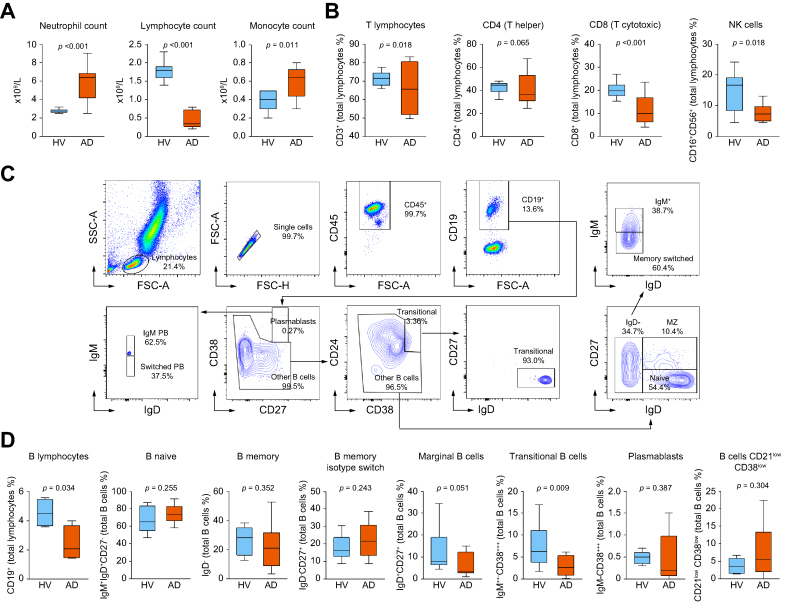
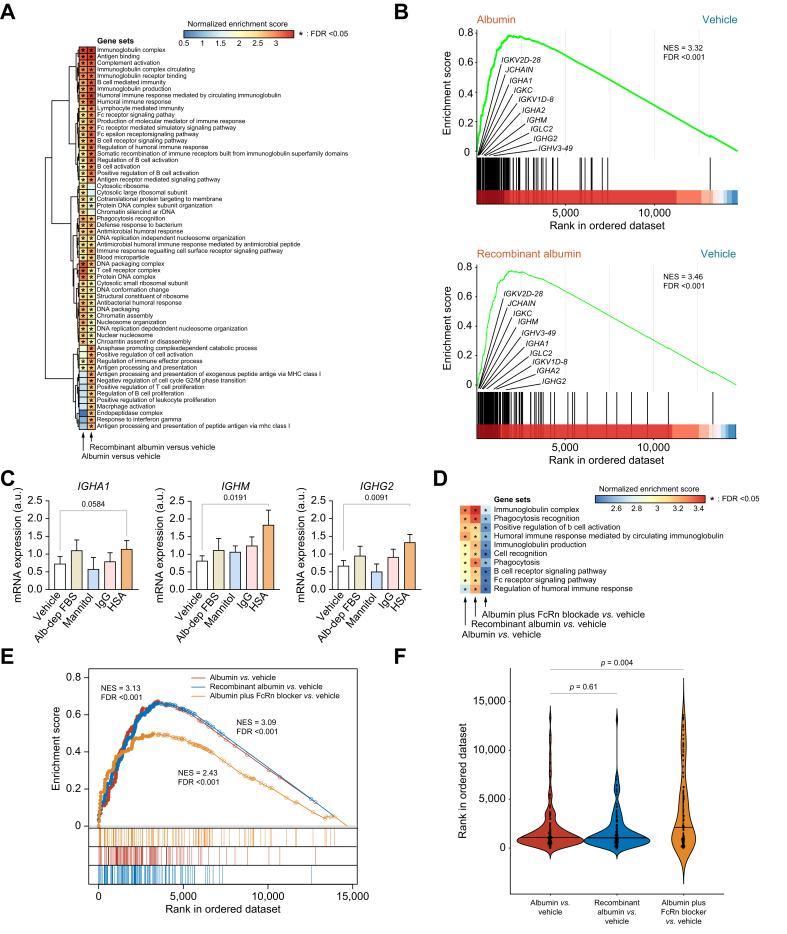
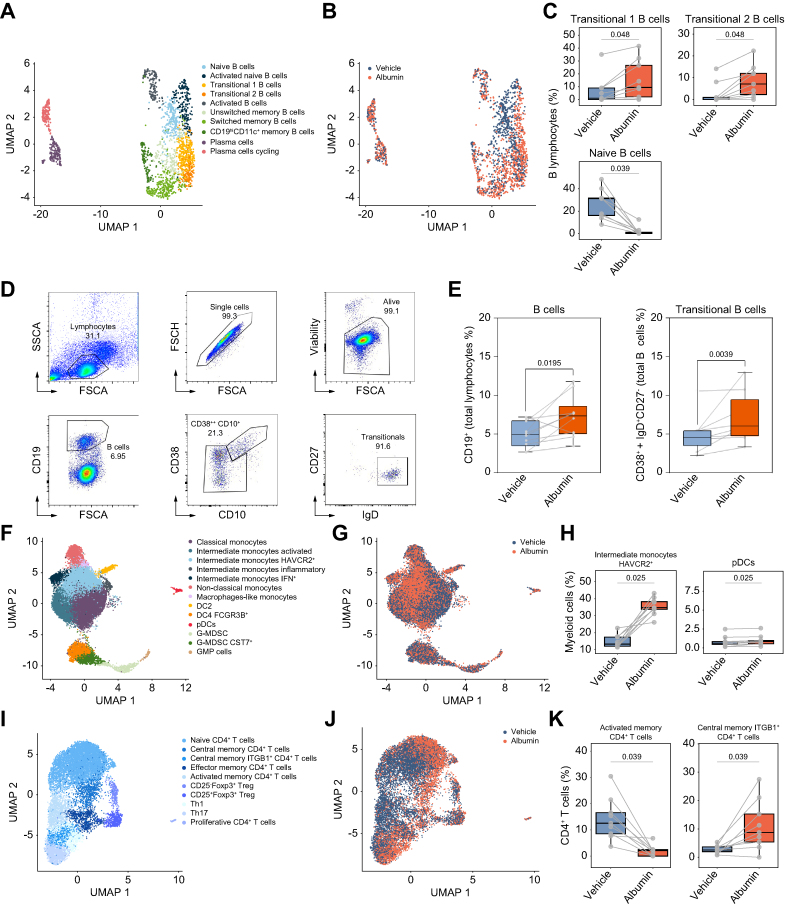
Methods: Blood immunophenotyping was performed in 11 patients with AD cirrhosis and 10 healthy volunteers (HV). Bulk and single-cell RNA sequencing (scRNA-seq) and flow cytometry were performed in peripheral blood mononuclear cells (PBMCs) from 20 patients with AD cirrhosis and 34 HV exposed to albumin. Albumin's effects on degranulation, phagocytosis, chemotaxis, and swarming of neutrophils from six patients with AD cirrhosis and nine HV were assessed by measuring myeloperoxidase enzymatic activity, the engulfment of fluorescent-labeled Escherichia coli and zymosan, and interactions of neutrophils with Candida albicans at single-cell resolution in microfluidic chambers, respectively. Whole blood RNA sequencing (RNA-seq) analyses were performed in 49 patients admitted for severe AD cirrhosis, of whom 30 received albumin during hospitalization.

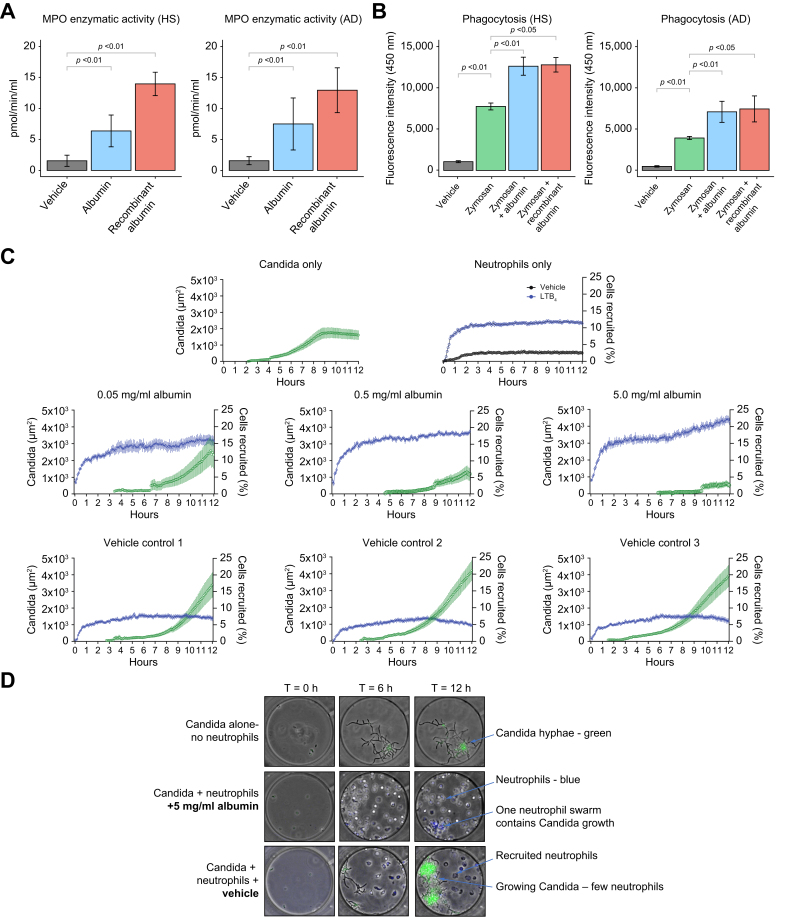
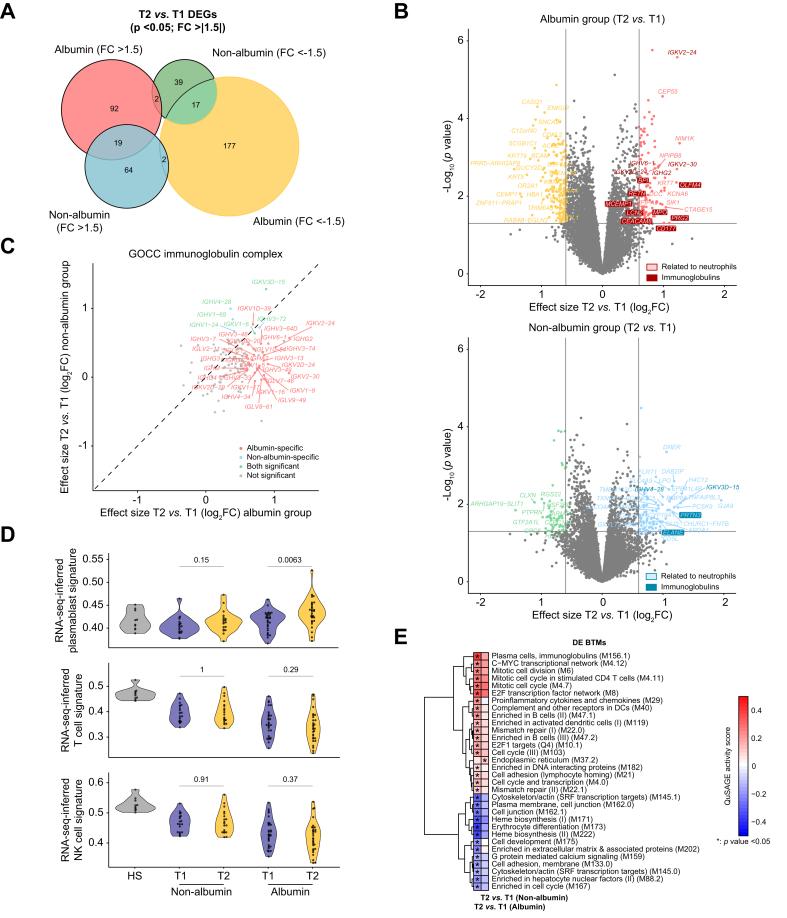
Results: Compared with HV, patients with AD cirrhosis showed severe lymphopenia and defective neutrophil antimicrobial function. Bulk and scRNA-seq analyses revealed significantly (false discovery rate [FDR] <0.05) increased signatures related to B cells, myeloid cells, and CD4+ T cells in PBMCs incubated with albumin. Changes in the B cell population were confirmed by flow cytometry. Neutrophils exposed to albumin also exhibited augmented chemotactic and degranulation responses, enhanced phagocytosis, and increased pathogen-restrictive swarming. RNA-seq data analysis in patients who had received albumin revealed specific upregulation of signatures related to B cells and neutrophils together with transcriptional changes in CD4+ T cells (FDR <0.05).

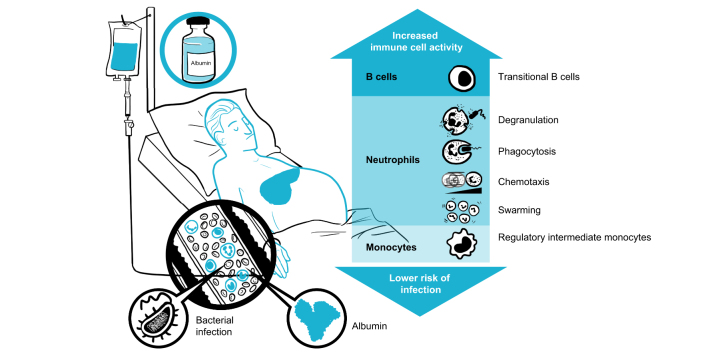
Conclusions: The finding that albumin promotes the transcriptional reprogramming and expansion of the B cell compartment and improves neutrophil antimicrobial functions indicates mechanisms that may lower the incidence of infections in patients with severe AD cirrhosis receiving albumin therapy.

Impact and implications: Patients with acutely decompensated cirrhosis receiving albumin as treatment have a lower incidence of infections. The reason for this protection is currently unknown, but the present study provides data that support the ability of albumin to boost the antimicrobial functions of immune cells in these patients. Moreover, these findings encourage the design of controlled clinical studies specifically aimed at investigating the effects of albumin administration on the immune system.

Keywords: Gene expression; Immunosuppression; Inflammation; Multiorgan failure.


Figures

Image 1
Graphical abstract
Fig. 1
Fig. 1
Peripheral immune cell landscape of patients with AD cirrhosis. (A) Peripheral blood cell counts in 10 HV and 11 patients with AD cirrhosis. (B) Peripheral blood immunophenotyping of T cells, CD4+ and CD8+ T cells, and NK cells in HV and patients with AD cirrhosis. (C) Scatterplots of the flow cytometry analysis showing the gating strategy to identify the different B cell subtypes, including plasmablasts (CD45+CD19+CD38++CD27++), transitional (CD45+CD19+CD38++CD24+IgD+CD27-), naïve (CD45+CD19+IgD+CD27-CD24lowIgM+), marginal (CD45+CD19+IgD+CD27+CD24highIgM++), and switched (CD45+CD19+IgD-CD27+/-IgM-). (D) Proportions of B cells and subpopulations in the peripheral blood of HV and patients with AD cirrhosis. Box and whisker graphs in panels A, B, and D represent the median (IQR). Lower and upper box borders indicate the 25th and 75th percentiles, respectively. Lines within each box indicate median percentage. Whiskers above and below each box indicate maximum and minimum values, respectively. Significance between groups was obtained using Wilcoxon–Mann–Whitney tests. AD, acutely decompensated; HV, healthy volunteers; NK, natural killer.
Fig. 2
Fig. 2
Changes in the transcriptional landscape of PBMCs isolated from patients with AD cirrhosis and incubated in vitro with HSA. (A) GSEA was run on RNA-seq data to generate ranked lists of genes for the two following pairwise comparisons vs. vehicle: HSA and recombinant albumin (both at 15 mg/ml). Color gradient corresponds to increasing values of the NES of gene sets from the less (in blue) to the most (in red) upregulated. Asterisks in the heat map indicate FDR <0.05. (B) GSEA enrichment plots of the immunoglobulin complex gene set in two comparisons vs. vehicle: HSA (top) and recombinant albumin (bottom). The hash plot under GSEA curves shows where the members of the gene set appear in the ranked list of genes. The genes shown on the plots are representative of leading-edge genes (i.e. top-scoring genes). (C) Changes in the expression of three representative leading-edge genes coding for immunoglobulins in response to the vehicle control, 15% albumin-depleted FBS (Alb-dep FBS), mannitol (15 mg/ml), IgG (15 mg/ml), and HSA (15 mg/ml). Significant differences between groups were assessed using t tests. (D) Heat map of the NES for the 10 representative B cell‒related gene sets obtained for each of the following three comparisons vs. vehicle: HSA, recombinant albumin, and FcRn blocker (10 μg/ml) plus HSA vs. vehicle. (E) Enrichment plots of the immunoglobulin complex in the three GSEA comparisons described in D. The leading-edge genes are indicated by solid dots. The hash plots under GSEA curves show where the members of the gene set appear in each of the three ranked lists of genes. (F) Rank order of each gene of the immunoglobulin complex gene set. The higher in the rank, the lower the importance. Values of p are ranked from Kruskal–Wallis tests, followed by Mann–Whitney U tests. All FDR values are computed with adjustments for multiple testing and gene set size in the GSEA analysis. AD, acutely decompensated; FcRn, neonatal Fc receptor; FDR, false discovery rate; GSEA, gene set enrichment analysis; HSA, human serum albumin; HV, healthy volunteers; NES, normalized enrichment score; PBMC, peripheral blood mononuclear cell; RNA-seq, RNA sequencing.
Fig. 3
Fig. 3
scRNA-seq and flow cytometry analyses identify specific immune cell changes in PBMCs exposed in vitro to HSA. (A) UMAP of 1,946 patients’ B cells exposed to HSA and the vehicle, colored by cell types. (B) Overlay of HSA and vehicle exposure on the B lymphocyte UMAP. (C) Box plots for the proportion of B cell populations that significantly changed after HSA exposure. (D, E) Scatterplots of the flow cytometry analysis showing the gating strategy to identify B and transitional B cells and boxplots showing their proportions after HSA exposure. (F) UMAP of 21,819 patients’ myeloid cells exposed to HSA and the vehicle, colored by cell populations. (G) Overlay of HSA and vehicle exposure on the myeloid cell UMAP. (H) Box plots for the proportion of myeloid cell types that significantly changed after HSA exposure. (I) UMAP of 12,692 patients’ CD4+ T cells exposed to HSA and the vehicle, colored by cell types. (J) Overlay of HSA and vehicle exposure on CD4+ T cell UMAP. (K) Box plots for the proportion of CD4+ T cells that significantly changed after HSA exposure. Fig. 3A–C and F–K have been designed using scRNA-seq in PBMCs from nine patients with AD cirrhosis. (D) and (E) were designed based on results obtained by flow cytometry in PBMCs from 10 age-matched HV. Significant differences between groups were assessed using paired t tests. AD, acutely decompensated; HSA, human serum albumin; HV, healthy volunteers; PBMC, peripheral blood mononuclear cell; pDC, plasmacytoid dendritic cell; scRNA-seq, single-cell RNA sequencing; UMAP, Uniform Manifold Approximation and Projection.
Fig. 4
Fig. 4
Effects of HSA on the host defense function of neutrophils from patients with AD cirrhosis. (A) Neutrophils were incubated with cell medium (vehicle), HSA, or recombinant human albumin (both at 15 mg/ml) for 2 h at 37 °C in a 5% CO2 incubator. Neutrophil degranulation was assessed by measuring the MPO enzymatic activity in the cell supernatants. (B) Phagocytic capacity assessed by incubating neutrophils with FITC-conjugated zymosan bioparticles alone or in the presence of HSA and recombinant albumin for 60 min and compared with vehicle control. (C) Quantification of Candida albicans growth and neutrophil recruitment in the microfluidic device. The size of Candida hyphae clusters was quantified based on the area of green fluorescence and is shown in green. The number of neutrophils recruited was quantified and shown in blue. For the neutrophils-only condition, we compared the neutrophils entering the chambers in the presence of the vehicle (black) with the number of neutrophils in the presence of LTB4 chemoattractant (100 nM; blue). Twelve chambers per condition were quantified, and three of them are shown. (D) Microscopy images of neutrophil–Candida albicans interactions in microfluidic chambers. A similar number of Candida yeast was loaded in each chamber (time T-0). Neutrophils were loaded outside the chambers. Neutrophils migrated to the chambers, attracted by Candida-released molecules. In the presence of HSA, neutrophils actively phagocytosed Candida. Neutrophils swarmed around any Candida hyphae clusters, delaying their growth. In vehicle controls, neutrophils delayed the growth of Candida but were not efficient enough to contain clusters of Candida hyphae. (A)–(D) were designed using functional assays in freshly isolated peripheral neutrophils from six patients with AD cirrhosis and five age-matched HV. Significant differences between groups were assessed using paired t tests. AD, acutely decompensated; HSA, human serum albumin; HV, healthy volunteers; LTB4, leukotriene B4; MPO, myeloperoxidase.
Fig. 5
Fig. 5
Whole blood gene signatures associated with HSA treatment. (A) Euler plot showing DEGs between T2 and T1 for the albumin and non-albumin groups. DEGs were defined by an absolute FC greater than 1.5 and p <0.05. (B) Volcano plots showing differential expression effect size (log2 FC) between T2 and T1 plotted against significance (-log10p) for the albumin (top) and non-albumin (bottom) groups. In both volcano plots, gray points indicate genes with no significant difference in expression between T2 and T1 (with absolute FC <1.5 and p >0.05, i.e. -log10p <1.3). Colored points indicate DEGs, either upregulated or downregulated. The neutrophil-related genes are highlighted. (C) Differential expression effect size (log2 FC) between T2 and T1 in the albumin group compared with corresponding differential effect size in the non-albumin group. Only genes included in the Gene Ontology gene set ‘GOCC_Immunoglobulin Complex’ are shown here. DEGs with a concordant sign were considered as shared. (D) Violin plots of RNA-seq inferred signatures at T1 and T2 for plasmablasts, NK cells, and T cells, determined using the SingleR software, in the albumin and non-albumin groups. Baseline values in HV are also shown. Values of p are from Kruskal–Wallis tests. (E) Heat map of 32 DE BTMs between T2 and T1 that were specific for either the albumin or non-albumin group. Thirty-one DE BTMs were specific for the albumin group, whereas only one DE BTM (‘endoplasmic reticulum [M37.2]’) was specific for the non-albumin group. BTMs were hierarchically clustered based on QuSAGE activity scores obtained in the albumin group. Asterisks denote p <0.05 obtained when comparing probability density functions with QuSAGE. Color represents QuSAGE activity score. BTM, blood transcription module; DE, differentially expressed; DEG, differentially expressed gene; FC, fold change; HSA, human serum albumin; NK, natural killer; QuSAGE, Quantitative Set Analysis for Gene Expression; RNA-seq, RNA sequencing; T1, time 1; T2, time 2.

References

    1. Moreau R., Jalan R., Ginès P., et al. Acute-on-chronic liver failure is a distinct syndrome that develops in patients with acute decompensation of cirrhosis. Gastroenterology. 2013;144:1426–1437. - PubMed
    1. Arroyo V., Moreau R., Jalan R. Acute-on-chronic liver failure. N Engl J Med. 2020;382:2137–2145. - PubMed
    1. Weiss E., de la Grange P., Defaye M., et al. Characterization of blood immune cells in patients with decompensated cirrhosis including ACLF. Front Immunol. 2021;11 - PMC - PubMed
    1. Clària J., Stauber R.E., Coenraad M.J., et al. Systemic inflammation in decompensated cirrhosis: characterization and role in acute-on-chronic liver failure. Hepatology. 2016;64:1249–1264. - PubMed
    1. López-Vicario C., Checa A., Urdangarin A., et al. Targeted lipidomics reveals extensive changes in circulating lipid mediators in patients with acutely decompensated cirrhosis. J Hepatol. 2020;73:817–828. - PubMed

LinkOut - more resources