. 2024 Oct 7:14:1407465.
doi: 10.3389/fonc.2024.1407465. eCollection 2024.

Harnessing the power of AI in precision medicine: NGS-based therapeutic insights for colorectal cancer cohort

Affiliations

Harnessing the power of AI in precision medicine: NGS-based therapeutic insights for colorectal cancer cohort

Victor Murcia Pienkowski et al. Front Oncol. .

Abstract

Purpose: Developing innovative precision and personalized cancer therapeutics is essential to enhance cancer survivability, particularly for prevalent cancer types such as colorectal cancer. This study aims to demonstrate various approaches for discovering new targets for precision therapies using artificial intelligence (AI) on a Polish cohort of colorectal cancer patients.

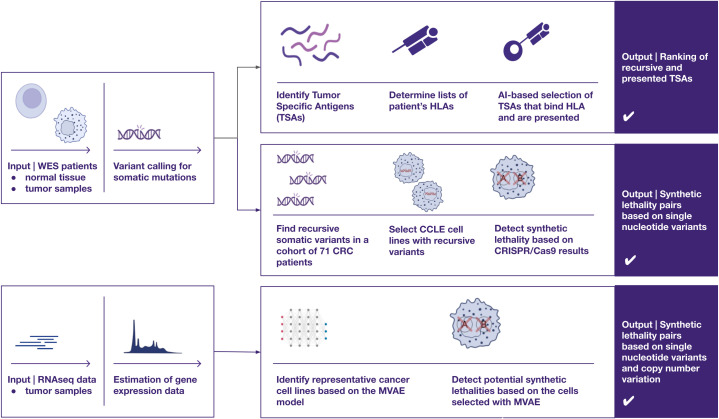
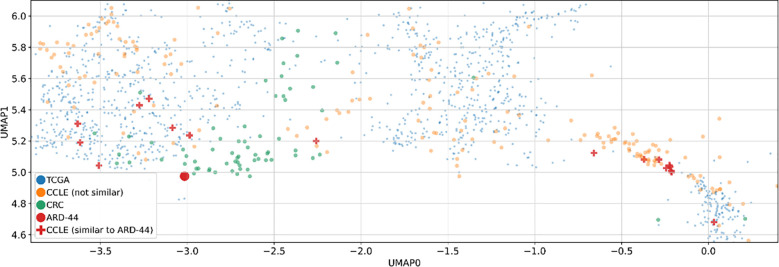
Methods: We analyzed 71 patients with histopathologically confirmed advanced resectional colorectal adenocarcinoma. Whole exome sequencing was performed on tumor and peripheral blood samples, while RNA sequencing (RNAseq) was conducted on tumor samples. We employed three approaches to identify potential targets for personalized and precision therapies. First, using our in-house neoantigen calling pipeline, ARDentify, combined with an AI-based model trained on immunopeptidomics mass spectrometry data (ARDisplay), we identified neoepitopes in the cohort. Second, based on recurrent mutations found in our patient cohort, we selected corresponding cancer cell lines and utilized knock-out gene dependency scores to identify synthetic lethality genes. Third, an AI-based model trained on cancer cell line data was employed to identify cell lines with genomic profiles similar to selected patients. Copy number variants and recurrent single nucleotide variants in these cell lines, along with gene dependency data, were used to find personalized synthetic lethality pairs.

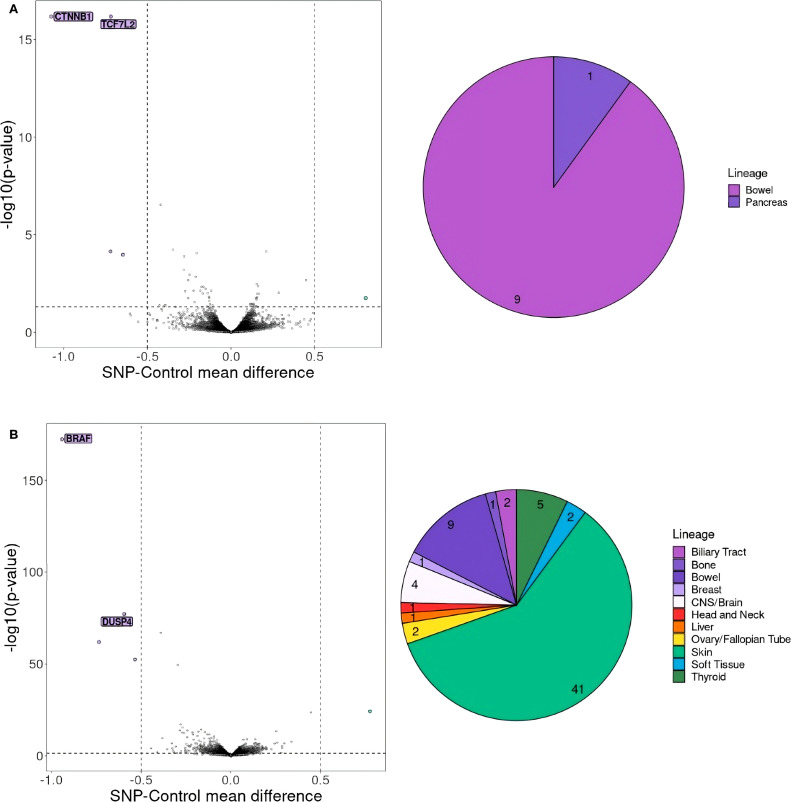
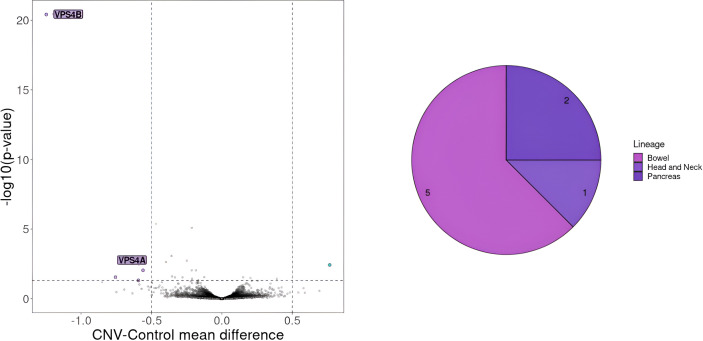
Results: We identified approximately 8,700 unique neoepitopes, but none were shared by more than two patients, indicating limited potential for shared neoantigenic targets across our cohort. Additionally, we identified three synthetic lethality pairs: the well-known APC-CTNNB1 and BRAF-DUSP4 pairs, along with the recently described APC-TCF7L2 pair, which could be significant for patients with APC and BRAF variants. Furthermore, by leveraging the identification of similar cancer cell lines, we uncovered a potential gene pair, VPS4A and VPS4B, with therapeutic implications.

Conclusion: Our study highlights three distinct approaches for identifying potential therapeutic targets in cancer patients. Each approach yielded valuable insights into our cohort, underscoring the relevance and utility of these methodologies in the development of precision and personalized cancer therapies. Importantly, we developed a novel AI model that aligns tumors with representative cell lines using RNAseq and methylation data. This model enables us to identify cell lines closely resembling patient tumors, facilitating accurate selection of models needed for in vitro validation.

Keywords: AI; CRC; neoantigens; precision medicine; synthetic lethality.


Conflict of interest statement

Authors VMP, PS, AZ, MBa, PB, WC, OG, ŁG, MKam, BK-J, JM-G, GM, RS, JWi, MP, MJ, MWa, JK and AB were employed by Ardigen SA. The remaining authors declare that the research was conducted in the absence of any commercial or financial relationships that could be construed as a potential conflict of interest.

Figures

Figure 1
Figure 1
A visual overview of three distinct approaches for identifying therapeutic targets in cancer, utilizing omics data such as whole exome sequencing and RNA sequencing — two of the most widely adopted techniques in cancer research. The proposed pipelines focus on uncovering two primary categories of potential cancer targets (1): recurrent peptides presented by HLA class I molecules for cancer immunotherapies, and (2) synthetic lethality pairs, which could inform the development of targeted therapies, such as protein inhibitors (e.g., PARP inhibitors).
Figure 2
Figure 2
Gene essentiality for cell lines with (A) APC T1396Nfs*3 mutation, (B) BRAF V600E mutation. On the left selected essential genes for cell lines with (A) APC T1396Nfs*3 mutation (chr5:112840254 G>GA) and (B) BRAF V600E mutation (chr7:140753336 A>T) are shown. The genes that should be considered crucial for cell proliferation are the ones with a mean difference of dependency score below -0.5 or above 0.5. A score below -0.5 indicates genes whose absence negatively affects cell proliferation, whereas a score above 0.5 indicates genes whose knock-out positively impacts cell proliferation. A pie chart on the right shows the number and proportion of CCL lineages with (A) APC T1396Nfs*3 and (B) BRAF V600E mutation.
Figure 3
Figure 3
Two-dimensional UMAP visualization derived from the MVAE model’s representation of multi-omics data. Each point in the plots corresponds to either a single cell or a patient sample. The scatter plot allows to observe patterns and relationships between different samples. (A) Data points are color-coded to distinguish between different data sources, such as cancer cell lines (CCLE) and patient samples (TCGA and CRC). The overlapping colors reflect the creation of a unified representation, aided by MVAE model predictions, and the removal of batch effects. (B) Color encoding is based on cancer types, with the 15 most frequent types selected for better legibility. Additionally, we restricted the embedding space to areas with all CRC patients and zoomed in. Legend labels marked in bold are cancer types with at least 10 data points in the selected area. (C) Each point in the plots corresponds to either a single cell (CCLE) or a patient sample (TCGA and CRC). Data points corresponding to CRC patients from our cohort are color-coded according to their Consensus Molecular Subtype (CMS) classification.
Figure 4
Figure 4
The number of CCLs classified as similar to each patient with cancer lineage discrimination. The stacked bar plot illustrates the number of cancer cell lines (CCLs) similar to each CRC patient with an additional distinction between the 15 most frequent cancer types. Similarity was determined based on the Euclidean distance in the 32-dimensional space obtained via the MVAE model, with a threshold set at the 1st percentile. Each bar represents a CRC patient (x-axis), and the height of the bar indicates the number of similar CCLs (y-axis). Segments in each bar are color-coded according to the cancer type of cancer cell lines they represent. The absence of bars on the plot for patients ARD-25 and ARD-42 is attributed to the lack of closely related CCLs, while for ARD-64 and ARD-65, predictions from the MVAE model were unavailable.
Figure 5
Figure 5
Two-dimensional UMAP visualization derived from the MVAE model’s representation of multi-omics data. Two-dimensional UMAP visualizations derived from MVAE representations of multi-omics data. Each point represents either a single cell line (CCLE) or a patient sample (TCGA and CRC). Additionally, similarities between a specific CRC patient (ARD-44) and various cancer cell lines (CCLs) are depicted on the plot, based on the Euclidean distances in a 32-dimensional space obtained via the MVAE model. This focused visualization provides insights into the similarities between CRC patients and CCLs, particularly in the context of colon cancer.
Figure 6
Figure 6
Gene essentiality for cell lines with CNV on chromosome 18 encompassing VPS4B gene. On the left selected essential genes for cell lines with deletion of more than 100 genes on chromosome 18 including VPS4B a gene known for its synthetic lethality effect in collaboration with VPS4A. The genes that should be considered crucial for cell proliferation are the ones with a mean difference of dependency score below -0.5 or above 0.5. A score below -0.5 indicates genes whose absence negatively affects cell proliferation, whereas a score above 0.5 indicates genes whose knock-out positively impacts cell proliferation. On the right CCLs lineages carrying the deletion.

References

    1. Siegel RL, Miller KD, Goding Sauer A, Fedewa SA, Butterly LF, Anderson JC, et al. . Colorectal cancer statistics, 2020. CA Cancer J Clin. (2020) 70:145–64. doi: 10.3322/caac.21601 - DOI - PubMed
    1. Biller LH, Schrag D. Diagnosis and treatment of metastatic colorectal cancer: A review. JAMA. (2021) 325:669. doi: 10.1001/jama.2021.0106 - DOI - PubMed
    1. Xi Y, Xu P. Global colorectal cancer burden in 2020 and projections to 2040. Transl Oncol. (2021) 14:101174. doi: 10.1016/j.tranon.2021.101174 - DOI - PMC - PubMed
    1. Siegel RL, Miller KD, Fuchs HE, Jemal A. Cancer statistics, 2022. CA Cancer J Clin. (2022) 72:7–33. doi: 10.3322/caac.21708 - DOI - PubMed
    1. Li J, Ma X, Chakravarti D, Shalapour S, DePinho RA. Genetic and biological hallmarks of colorectal cancer. Genes Dev. (2021) 35:787–820. doi: 10.1101/gad.348226.120 - DOI - PMC - PubMed

LinkOut - more resources