. 2024 Sep 17;9(20):e184940.
doi: 10.1172/jci.insight.184940.

Distinct strategies for intravascular triglyceride metabolism in hearts of mammals and lower vertebrate species

Affiliations

Distinct strategies for intravascular triglyceride metabolism in hearts of mammals and lower vertebrate species

Le Phuong Nguyen et al. JCI Insight. .

Abstract

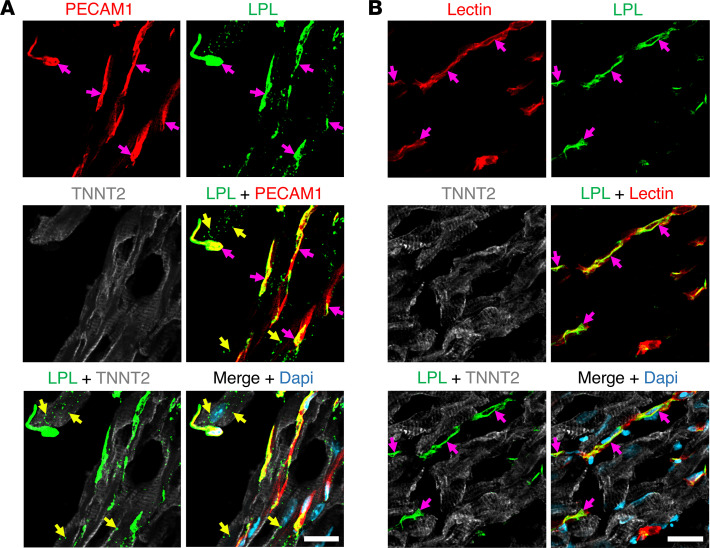
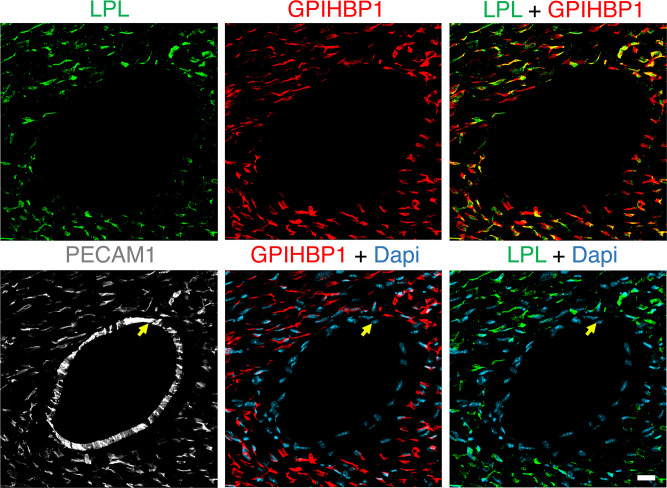
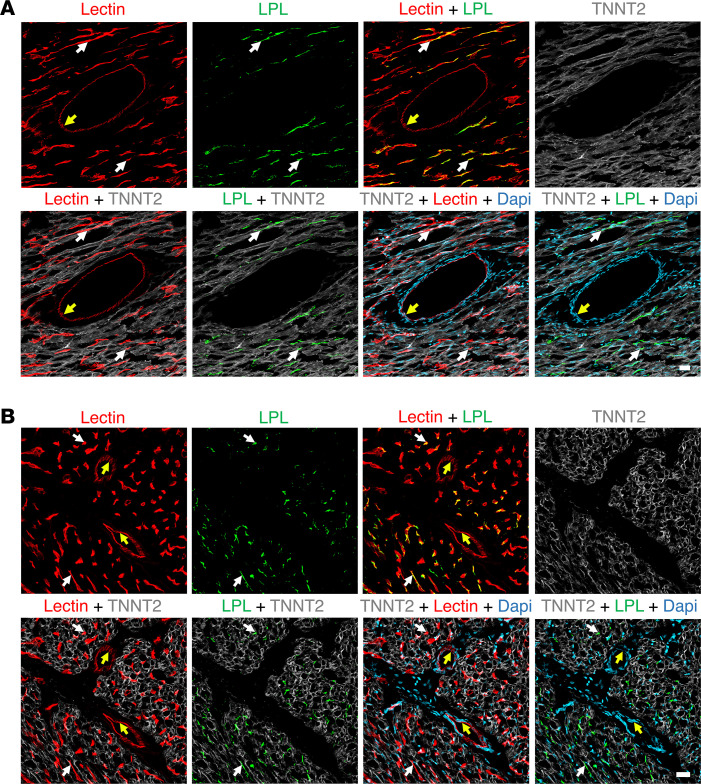
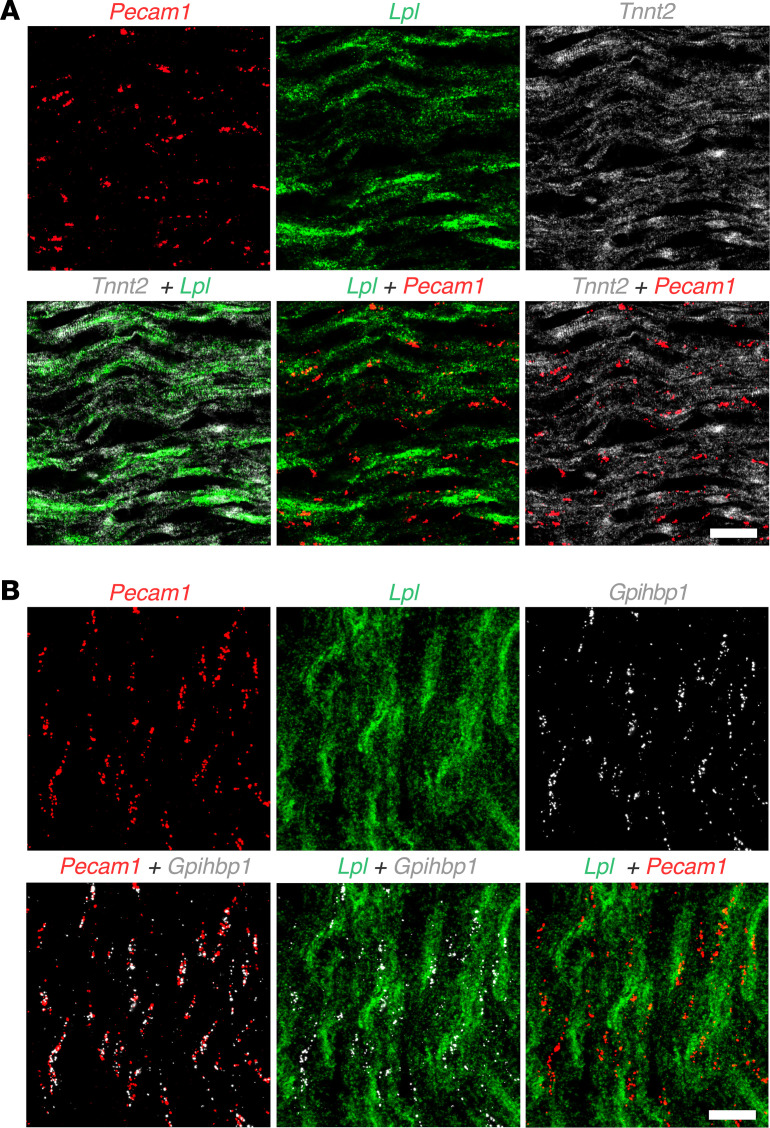
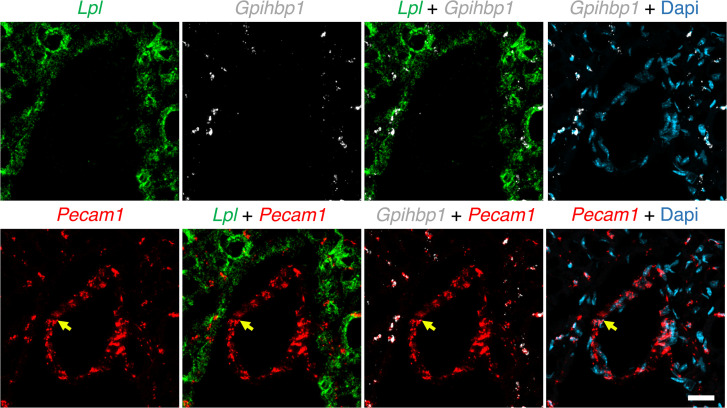
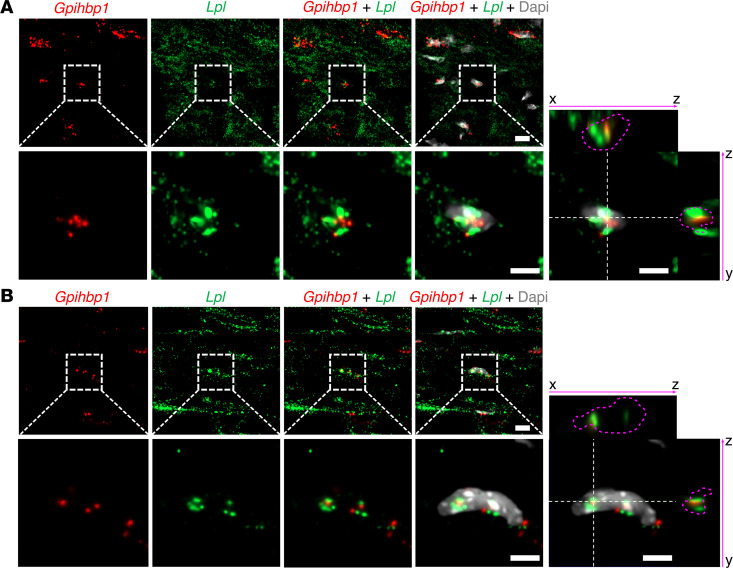
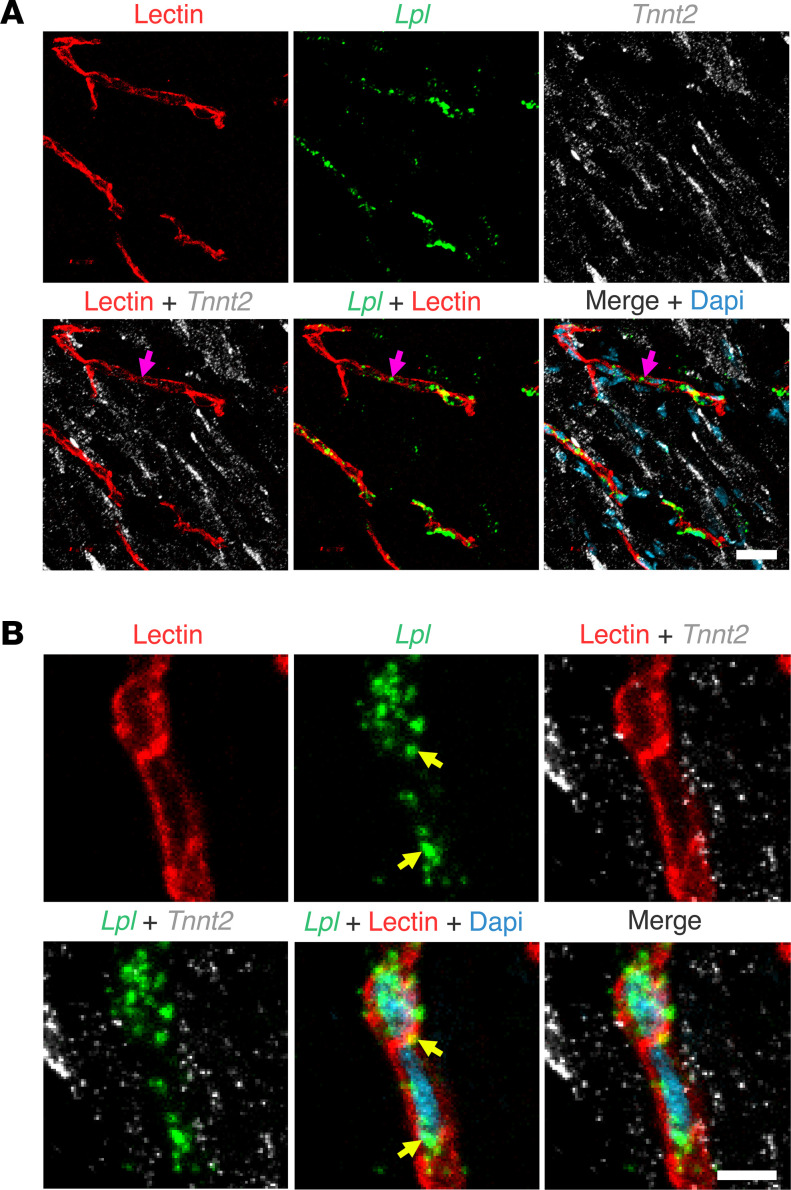
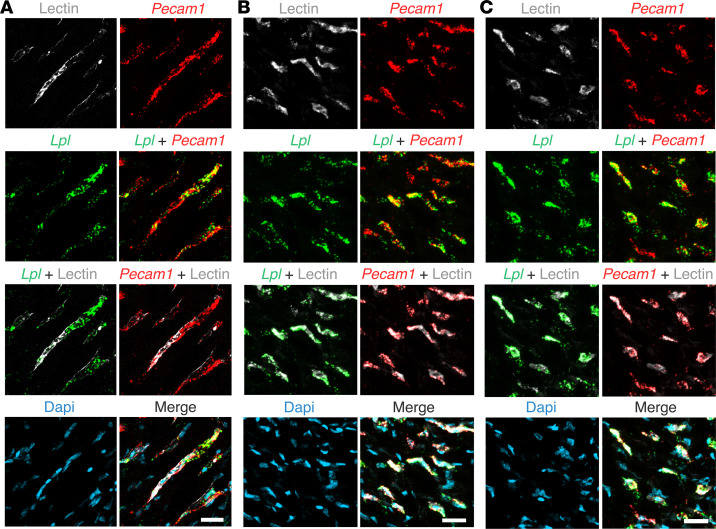
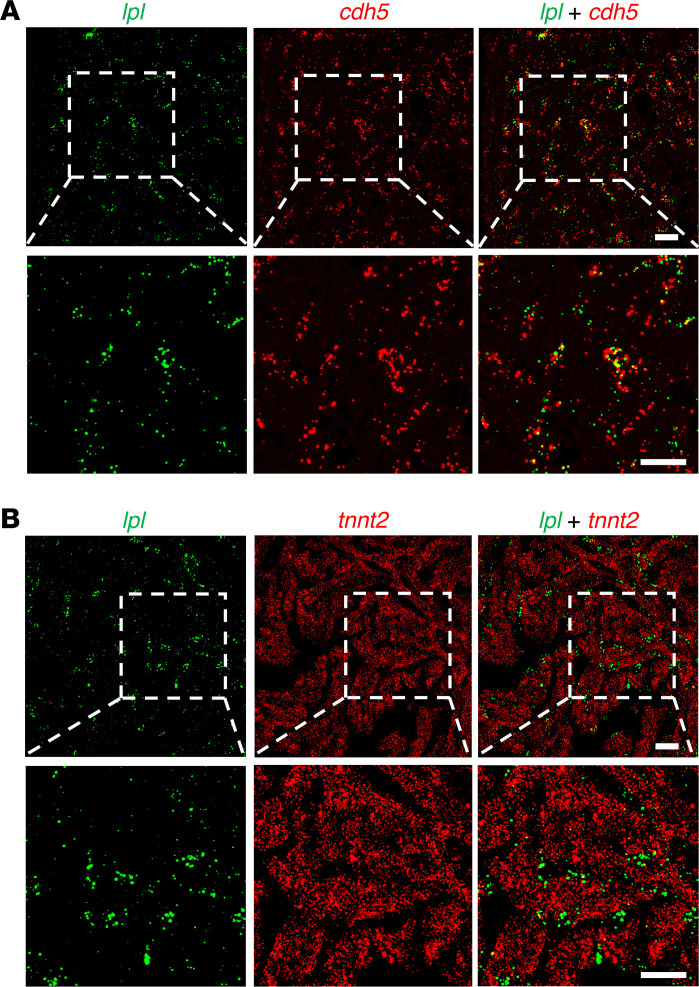
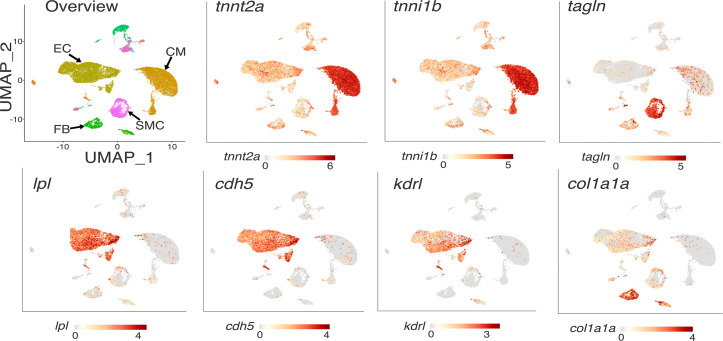
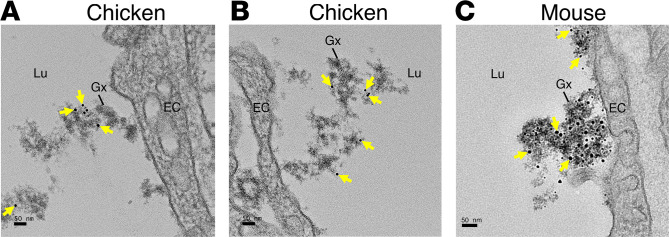
Lipoprotein lipase (LPL) and multiple regulators of LPL activity (e.g., APOC2 and ANGPTL4) are present in all vertebrates, but GPIHBP1-the endothelial cell (EC) protein that captures LPL within the subendothelial spaces and transports it to its site of action in the capillary lumen-is present in mammals but in not chickens or other lower vertebrates. In mammals, GPIHBP1 deficiency causes severe hypertriglyceridemia, but chickens maintain low triglyceride levels despite the absence of GPIHBP1. To understand intravascular lipolysis in lower vertebrates, we examined LPL expression in mouse and chicken hearts. In both species, LPL was abundant on capillaries, but the distribution of Lpl transcripts was strikingly different. In mouse hearts, Lpl transcripts were extremely abundant in cardiomyocytes but were barely detectable in capillary ECs. In chicken hearts, Lpl transcripts were absent in cardiomyocytes but abundant in capillary ECs. In zebrafish hearts, lpl transcripts were also in capillary ECs but not cardiomyocytes. In both mouse and chicken hearts, LPL was present, as judged by immunogold electron microscopy, in the glycocalyx of capillary ECs. Thus, mammals produce LPL in cardiomyocytes and rely on GPIHBP1 to transport the LPL into capillaries, whereas lower vertebrates produce LPL directly in capillary ECs, rendering an LPL transporter unnecessary.

Keywords: Cardiology; Endothelial cells; Lipoproteins; Metabolism.


Conflict of interest statement

Conflict of interest: The authors have declared that no conflict of interest exists.

Figures

Figure 1
Figure 1. IHC studies on the localization of LPL in mouse and chicken hearts.
Mouse and chicken heart cryosections were stained with antibodies against cardiac troponin T (TNNT2, white) and either a mouse LPL–specific rabbit antibody (3174) or a chicken LPL–specific rabbit antibody (4727). Nuclei were stained with Dapi (blue). (A) A heart section from a mouse that had been injected intravenously with an Alexa Fluor 488–labeled PECAM1-specific monoclonal antibody (2H8, red). Mouse LPL (green) was detected on PECAM1-positive capillaries (pink arrows) and inside cardiomyocytes (yellow arrows). (B) Heart section from a chicken that had been injected intravenously with a fluorescein-labeled lectin (Lens culinaris agglutinin, red). Chicken LPL (green) was detected on capillary ECs (pink arrows); amounts of LPL inside chicken cardiomyocytes were negligible or absent. Shown here are representative images from independent experiments with 4 mice and 4 chickens. Scale bar: 20 μm.
Figure 2
Figure 2. Confocal micrographs of LPL, GPIHBP1, and PECAM1 expression in mouse hearts.
Heart sections were stained with antibodies against LPL, GPIHBP1, and PECAM1. Nuclei were stained with Dapi (blue). GPIHBP1 (red) and LPL (green) were detectable on ECs of capillaries but not on ECs of a large blood vessel (yellow arrow); PECAM1 (white) was found on ECs of both capillaries and the large blood vessels. Shown here are representative images from independent experiments with 3 mice. Scale bar: 20 μm.
Figure 3
Figure 3. IHC studies of chicken heart showing that LPL is present on capillaries but not large blood vessels.
(A and B) Heart sections were prepared from a chicken that had been injected intravenously with a fluorescein-labeled lectin (Lens culinaris agglutinin, red), which binds to glycoproteins on the luminal surface of blood vessels. Cryosections were stained with antibodies against chicken LPL (green) and TNNT2 (white). Confocal micrographs revealed LPL on chicken heart capillaries (white arrows) but not in a larger blood vessel (yellow arrow). Nuclei were stained with Dapi (blue). Shown here are representative images from independent experiments with 4 chickens. Scale bar: 20 μm.
Figure 4
Figure 4. ISH studies on mouse heart with RNAscope probes for Lpl, Tnnt2, Pecam1, and Gpihbp1.
(A) ISH studies of mouse heart, revealing abundant amounts of Lpl transcripts (green) and Tnnt2 transcripts (encoding cardiac troponin T, white) in cardiomyocytes; transcripts for Pecam1 (red) were in capillary ECs adjacent to cardiomyocytes. (B) ISH studies of mouse heart revealing abundant amounts of Lpl transcripts (green) in cardiomyocytes; Pecam1 transcripts (red) and Gpihbp1 transcripts (white) were in capillary ECs adjacent to cardiomyocytes. Shown here are representative images from 2 independent experiments. Scale bar: 20 μm.
Figure 5
Figure 5. ISH studies of mouse heart with RNAscope probes for Lpl, Gpihbp1, and Pecam1.
Gpihbp1 (white) and Pecam1 (red) transcripts were in capillary ECs adjacent to cardiomyocytes, which contained abundant Lpl transcripts (green). Pecam1 transcripts, but not Gpihbp1 transcripts, were located in ECs of a larger blood vessel (yellow arrow). Nuclei were stained with Dapi (blue). Shown here are representative images from independent experiments with 3 mice. Scale bar: 20 μm.
Figure 6
Figure 6. ISH studies of mouse heart with RNAscope probes for Lpl and Gpihbp1.
(A and B) ISH studies of mouse heart demonstrated that Lpl (green) transcripts were abundant in cardiomyocytes, whereas Gpihbp1 (red) transcripts were in capillary ECs adjacent to cardiomyocytes. Higher-magnification images of the boxed regions shows that a nucleus of a mouse heart capillary ECs contained both Lpl and Gpihbp1 transcripts. Pink dashed lines indicate the border of the nucleus. Nuclei were stained with Dapi (white). Shown here are representative images from independent experiments with 2 mice. Scale bar: 5 μm.
Figure 7
Figure 7. ISH studies on chicken heart with RNAscope probes for Lpl and Tnnt2.
The chicken had been given an intravenous injection of a fluorescein-labeled lectin (Lens culinaris agglutinin, red) to stain the luminal surface of blood vessels. (A) ISH studies revealed abundant Tnnt2 transcripts (white) in cardiomyocytes; Lpl transcripts (green) were abundant in capillary ECs (pink arrow). Scale bar: 5 μm. (B) Lpl transcripts (green) in chicken heart were found in capillary ECs, including in the cell nucleus (yellow arrows), but were not observed in adjacent Tnnt2-positive cardiomyocytes. Nuclei were stained with Dapi (blue). Shown here are representative images from independent experiments with 2 chickens. Scale bar: 5 μm.
Figure 8
Figure 8. ISH studies of chicken heart with RNAscope probes against Lpl and Pecam1.
The chicken had been given an intravenous injection of a fluorescein-labeled lectin (Lens culinaris agglutinin) to stain the luminal surface of blood vessels. (AC) Lpl transcripts (green) were in capillary ECs, identified both by the fluorescein-labeled lectin (white) and by the presence of Pecam1 transcripts (red). The Lpl signal outside of lectin-positive blood vessels was negligible. Shown are representative images from experiments with 4 chickens. Scale bar: 5 μm.
Figure 9
Figure 9. ISH studies of chicken heart with RNAscope probes against Lpl and Pecam1.
Pecam1 transcripts (red) were present in ECs of a large blood vessels (white arrow) and in a small capillary (yellow arrow). Lpl transcripts (green) were observed only in the capillary. Nuclei were stained with Dapi (blue). Shown is a representative image from experiments with 4 chickens. Scale bar: 50 μm.
Figure 10
Figure 10. ISH studies on zebrafish heart with RNAscope probes.
(A) Confocal micrograph revealing lpl (green) and cdh5 (red) transcripts in ECs. (B) Confocal micrograph demonstrating that the distribution pattern of lpl and tnnt2 transcripts the zebrafish heart is distinct. tnnt2 transcripts are in cardiomyocytes; lpl transcripts are in capillaries adjacent to cardiomyocytes. Boxed regions are shown below at a higher magnification. Shown are representative images from 4 zebrafish (2 males, 2 females). Scale bars: 20 μm.
Figure 11
Figure 11. Single-cell RNA transcriptomic studies on zebrafish hearts, revealing LPL expression in the heart endothelial/endocardial cells.
UMAP plot depicts the cellular composition of the zebrafish heart (n = 4 biologically independent samples), categorized into 4 major cell types. The expression patterns of 4 cell type–specific marker genes are shown (cdh5 and kdrl for endothelial/endocardial cells [EC], tnnt2a and tnni1b for cardiomyocytes [CM], tagln for smooth muscle cells [SMC], col1a1 for fibroblasts [FB]). The pattern of lpl expression resembles that for cdh5 and kdrl.
Figure 12
Figure 12. Transmission electron micrographs of mouse and chicken heart, revealing LPL in the glycocalyx of heart capillary ECs.
(A and B) Electron micrographs of capillaries from a chicken heart that had been perfused with 10 nm gold nanobead–conjugated antibody against chicken LPL. (C) Transmission electron micrograph of a heart capillary from a mouse that had been injected with a 10-nm gold nanobead–conjugated rabbit antibody against mouse LPL. Yellow arrowheads point to gold nanobeads. The glycocalyx (Gx) was stained with LaCl3/DyCl3. Shown are representative images from experiments with 2 chicken hearts. Scale bar: 50 nm. Lu, lumen; EC, endothelial cell.
Figure 13
Figure 13. Recombinant human LPL, when injected intravenously into mice or chickens, binds to the luminal surface of heart capillaries.
In mouse heart (A) and chicken hearts (B and C), recombinant human LPL (hLPL) binds avidly to ECs of capillaries but not larger blood vessels (yellow arrows). Shown are representative images from experiments with 3 chickens and 3 mice. Scale bar: 20 μm.

References

    1. Korn ED. Clearing factor, a heparin-activated lipoprotein lipase. I. Isolation and characterization of the enzyme from normal rat heart. J Biol Chem. 1955;215(1):1–14. doi: 10.1016/S0021-9258(18)66011-9. - DOI - PubMed
    1. Korn ED, et al. Studies on lipoprotein lipase of rat heart and adipose tissue. Biochim Biophys Acta. 1955;18(1):143–145. doi: 10.1016/0006-3002(55)90024-X. - DOI - PubMed
    1. Weinstock PH, et al. Severe hypertriglyceridemia, reduced high density lipoprotein, and neonatal death in lipoprotein lipase knockout mice. Mild hypertriglyceridemia with impaired very low density lipoprotein clearance in heterozygotes. J Clin Invest. 1995;96(6):2555–2568. doi: 10.1172/JCI118319. - DOI - PMC - PubMed
    1. Havel RJ, et al. Idiopathic hyperlipemia: metabolic studies in an affected family. J Clin Invest. 1960;39(12):1777–1790. doi: 10.1172/JCI104202. - DOI - PMC - PubMed
    1. Ginzinger DG, et al. Lipid and lipoprotein analysis of cats with lipoprotein lipase deficiency. Eur J Clin Invest. 1999;29(1):17–26. doi: 10.1046/j.1365-2362.1999.00435.x. - DOI - PubMed