. 2024 Oct 22;9(20):e181309.
doi: 10.1172/jci.insight.181309.

The contribution of neutrophils to bacteriophage clearance and pharmacokinetics in vivo

Affiliations

The contribution of neutrophils to bacteriophage clearance and pharmacokinetics in vivo

Arne Echterhof et al. JCI Insight. .

Abstract

With the increasing prevalence of antimicrobial-resistant bacterial infections, there is interest in using bacteriophages (phages) to treat such infections. However, the factors that govern bacteriophage pharmacokinetics in vivo remain poorly understood. Here, we have examined the contribution of neutrophils, the most abundant phagocytes in the body, to the pharmacokinetics of i.v. administered bacteriophage in uninfected mice. A single dose of LPS-5, a bacteriophage recently used in human clinical trials to treat drug-resistant Pseudomonas aeruginosa, was administered i.v. to both immunocompetent BALB/c and neutropenic CD1 mice. Phage concentrations were assessed in peripheral blood and spleen at 0.25, 1, 2, 4, 8, 12, and 24 hours after administration by plaque assay and qPCR. We observed that the phage clearance was only minimally affected by neutropenia. Indeed, the half-lives of phages in blood in BALB/c and CD1 mice were 3.45 and 3.66 hours, respectively. These data suggest that neutrophil-mediated phagocytosis is not a major determinant of phage clearance. Conversely, we observed a substantial discrepancy in circulating phage levels over time when measured by qPCR versus plaque assay, suggesting that significant inactivation of circulating phages occurs over time. These data indicate that alternative factors, but not neutrophils, inactivate i.v. administered phages.

Keywords: Bacterial infections; Infectious disease.


Figures

Figure 1
Figure 1. LPS-5 is a tailed phage used in the treatment of drug-resistant infections.
(A) A representative transmission electron microscopy image of LPS-5 (original magnification, ×80,000) is shown in extended and contracted states. (B) Lytic plaque morphology for LPS-5 on Pseudomonas aeruginosa strain PAO1.
Figure 2
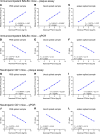
Figure 2. Calibration curves for phage titrations in blood and spleen.
To assess our ability to accurately quantify phages in blood and tissue samples, we performed titration studies using plaque assays and qPCR assays as our readouts. For these studies phages with established, nominal concentrations were added to PBS, blood, or spleen tissue collected from (AF) immunocompetent BALB/c mice or (GL) neutropenic ICR mice. These were then analyzed using (AC and GI) plaque assays or (DF and JL) qPCR. Log-transformed phage titers and Ct values are plotted over log-transformed normal phage titers. A linear regression was performed.
Figure 3
Figure 3. Schematic of biodistribution and pharmacokinetics experiment.
In these studies, phage LPS-5 was administered i.v. as a single dose (0.1 mL/mouse at 1.0 × 10¹¹ PFU/mL) to immunocompetent BALB/c mice or neutropenic CD1 mice. Animals were sacrificed after 0.25 hours, 1 hour, 2 hours, 4 hours, 8 hours, 12 hours, or 24 hours. At every sampling time point, 5 mice were sacrificed, and the phage concentration was measured in whole blood and spleen homogenates by qPCR and plaque assay. Noncompartmental analysis was conducted to estimate pharmacokinetic parameters.
Figure 4
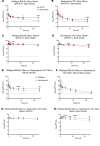
Figure 4. Pharmacokinetics and biodistribution of LPS-5 bacteriophage in blood and spleen tissue over time in BALB/c (immunocompetent) and CD1 (neutropenic) mice.
Mice received 0.1 mL of 1.0 × 10¹¹ PFU/mL LPS-5 phage suspension i.v. by tail vein injection. Five mice were sacrificed at 0.25, 1, 2, 4, 8, 12, and 24 hours for measurement by qPCR and plaque assays of blood and spleen tissue homogenates. 35 immunocompetent mice and 35 neutropenic mice were used. Geometric mean ± SD is plotted over time. (AD) Blood pharmacokinetics (A and B) and spleen biodistribution (C and D) of LPS-5 in immunocompetent BALB/c versus neutropenic CD1 mice, as determined by qPCR (A and C) or spot assay (B and D). (EH) Comparison of PK curves derived from qPCR and spot assay in blood (E and F) and spleen (G and H) in immunocompetent BALB/c (E and G) and neutropenic CD1 mice (F and H). The dotted lines indicate lower limit of detection (LLOD). **P < 0.001, ***P < 0.0001, ****P < 0.00001, t tests adjusted for multiple comparisons using Holm-Šídák method. Statistical analyses were performed on means of log-transformed values due to right-skewness of PK data.

Update of

References

    1. Murray CJL, et al. Global burden of bacterial antimicrobial resistance in 2019: a systematic analysis. Lancet. 2022;399(10325):629–655. doi: 10.1016/S0140-6736(21)02724-0. - DOI - PMC - PubMed
    1. Morales E, et al. Hospital costs of nosocomial multi-drug resistant Pseudomonas aeruginosa acquisition. BMC Health Serv Res. 2012;12(1):122. doi: 10.1186/1472-6963-12-122. - DOI - PMC - PubMed
    1. Emerson J, et al. Pseudomonas aeruginosa and other predictors of mortality and morbidity in young children with cystic fibrosis. Pediatr Pulmonol. 2002;34(2):91–100. doi: 10.1002/ppul.10127. - DOI - PubMed
    1. Malhotra S, et al. Cystic fibrosis and Pseudomonas aeruginosa: the host-microbe interface. Clin Microbiol Rev. 2019;32(3):e00138-18. doi: 10.1128/CMR.00138-18. - DOI - PMC - PubMed
    1. Pang Z, et al. Antibiotic resistance in Pseudomonas aeruginosa: mechanisms and alternative therapeutic strategies. Biotechnol Adv. 2019;37(1):177–192. doi: 10.1016/j.biotechadv.2018.11.013. - DOI - PubMed

LinkOut - more resources