. 2024 Oct 22;9(20):e178373.
doi: 10.1172/jci.insight.178373.

Circulating proteins linked to apoptosis processes and fast development of end-stage kidney disease in diabetes

Affiliations

Circulating proteins linked to apoptosis processes and fast development of end-stage kidney disease in diabetes

Katsuhito Ihara et al. JCI Insight. .

Abstract

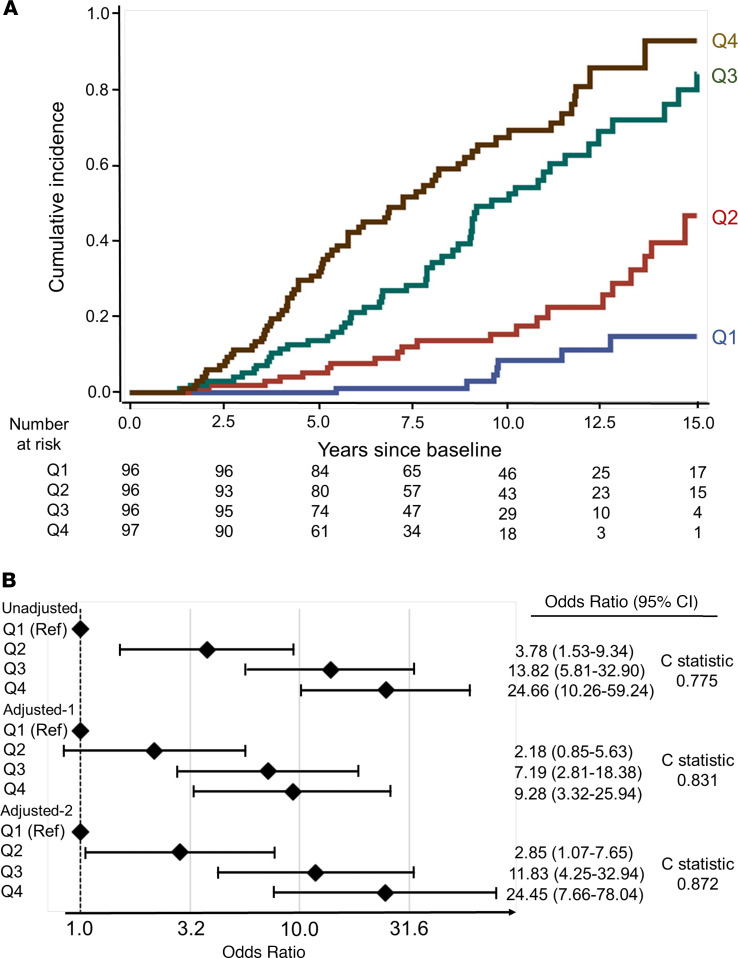
Many circulating proteins are associated with risk of ESKD, but their source and the biological pathways/disease processes they represent are unclear. Using OLINK proteomics platform, concentrations of 455 proteins were measured in plasma specimens obtained at baseline from 399 individuals with diabetes. Elevated concentrations of 46 circulating proteins were associated (P < 1 × 10⁻⁵) with development of ESKD (n = 143) during 7-15 years of follow-up. Twenty of these proteins enriched apoptosis/TNF receptor signaling pathways. A subset of 20 proteins (5-7 proteins), summarized as an apoptosis score, together with clinical variables accurately predicted risk of ESKD. Expression of genes encoding the 46 proteins in peripheral WBCs showed no difference between cells from individuals who did or did not develop ESKD. In contrast, plasma concentration of many of the 46 proteins differed by this outcome. In single-nucleus RNA-Seq analysis of kidney biopsies, the majority of genes encoding for the 20 apoptosis/TNF receptor proteins were overexpressed in injured versus healthy proximal tubule cells. Expression of these 20 genes also correlated with the overall index of apoptosis in these cells. Elevated levels of circulating proteins flagging apoptotic processes/TNF receptor signaling pathways - and likely originating from kidney cells, including injured/apoptotic proximal tubular cells - preceded the development of ESKD.

Keywords: Apoptosis; Diabetes; Nephrology.


Conflict of interest statement

Conflict of interest: The authors have declared that no conflict of interest exists.

Figures

Figure 1
Figure 1. Selection of individuals for the 2 nested case-control studies.
The Joslin Kidney Study (JKS) enrolled 370 individuals with T1D with baseline Macro-albuminuria and eGFR ≥ 45 mL/min/1.73 m2. During 7–15 years of follow-up, 126 of these individuals developed end-stage kidney disease (ESKD) (cases) and 244 did not (controls). For the current study, 103 cases were available and 93 controls were selected randomly. The JKS enrolled 558 individuals with T2D with baseline Micro- and Macro-albuminuria and eGFR ≥ 45 mL/min/1.73 m2. During 7–15 years of follow-up, 44 of these individuals developed ESKD and 514 did not. For the current study, 40 cases were available and 163 controls were selected randomly.
Figure 2
Figure 2. Associations between 455 proteins and development of ESKD.
Volcano plots of OR for the development of ESKD for 455 proteins in T1D study (A) and in T2D study (B). Using Bonferroni-adjusted P values, 46 proteins were statistically significant for association with fast development of ESKD in both T1D and T2D studies. These proteins are shown in red.
Figure 3
Figure 3. Distribution of proteins by functional categories in all examined proteins and proteins associated with development of ESKD.
(A) In total, 455 proteins on the OLINK proteomics platform were used for the analysis. They were categorized based on protein function from literatures sources: TNF receptors, immunoregulatory receptors, other receptors, enzymes, ligands, inhibitors, and others. (B) Similarly, the 46 ESKD risk–associated proteins were categorized based on protein function as above. Proportion of proteins between the 2 sets were compared using a chi-square test.
Figure 4
Figure 4. Results of pathway analysis of 46 ESKD risk–associated proteins.
(A) Clusters of enriched pathways by 46 ESKD risk–associated proteins are shown. The functional annotation clustering in DAVID software (version 6.8) was applied for pathway enrichment analysis using the DAVID databases (e.g., GO, KEGG, REACTOME pathways and UniprotKB keywords). The results were obtained using 455 proteins measured on 5 OLINK panels. Similar results were obtained when all 1,012 proteins included in 11 OLINK panels were used as background (data not shown). The geometric mean (in –log scale) of the Expression Analysis Systemic Explorer (EASE) scores (modified Fisher exact P values) were used to rank their biological significance. Four clusters of pathways or terms with EAS E scores of P < 0.01 are shown in the figure as statistically significant. More detailed results are shown in Supplemental Table 2. Result of similar analysis for SOMAscan data are shown in Supplemental Figure 3. (B) Venn diagrams of 46 ESKD risk–associated proteins grouped according to enriched pathways are shown. Twenty proteins referred to as apoptosis/TNF receptor proteins were enriching pathways in clusters 1, 3, and 4 in A. Twenty-six other proteins did not enrich any known pathway. However, 8 of these proteins and all 20 apoptosis/TNF receptor proteins were enriching pathways included in cluster 2 referred to as receptors and membrane proteins. Asterisks indicate proteins found to be associated with sickle cell related kidney disease (18).
Figure 5
Figure 5. Comparison of expression of 46 genes encoding ESKD risk–associated proteins in circulating WBC and concentration of these proteins in plasma obtained at baseline in individuals who did develop (16 cases) and did not develop ESKD (55 controls) during 7–15 years of follow-up.
Clinical characteristics of cases and controls are shown in Supplemental Table 3. (A) Comparison between cases (triangles) and controls (circles) of mean expression levels of mRNAs in WBC of genes encoding for the 46 ESKD risk–associated proteins. Genes encoding 20 apoptosis/TNF receptor proteins are indicated in red, and genes encoding 26 other proteins are indicated in blue. ND, not detected. (B) Volcano plot of log10 of P value against log2 of fold change of expression of 22,121 genes detected in WBC in cases over controls. No gene was found to be differentially expressed in WBC among these 2 groups following multiple testing correction (Bonferroni-adjusted P < 2.26 × 10⁻⁶). Red triangles indicate genes encoding for apoptosis/TNF receptor proteins. Blue triangles indicate genes encoding for other proteins. (C) Volcano plot of log10 P value against fold change of 46 plasma concentration of ESKD risk–associated proteins in cases over controls. Out of 46 proteins, 10 were significantly upregulated in cases (in red).
Figure 6
Figure 6. snRNA-Seq analysis and enrichment of apoptosis pathways and TNF receptor proteins in injured (PT_VCAM1) and control proximal tubule cells.
Reanalyzed data from previous publication (–21). The gene names for the proteins in the Figure are listed in Supplemental Table 1. (A) Cell-specific expression of gene encoding for 20 apoptosis/TNF receptor proteins and 26 other proteins among kidney cell types. Cell-specific genes were computed using the Seurat FindMarkers function comparing the indicated cell type to all other cell types using a Wilcoxon rank sum test with an adjusted P < 0.05 threshold. The intersection between cell-specific genes and the 20 apoptosis/TNF receptor proteins and 26 other proteins is displayed as a bar plot for each cell type. (B) Differential expression of genes encoding for 46 circulating ESKD risk–associated proteins in PT_VCAM1 versus control proximal tubule cells is shown. The y axis corresponds to a Benjamini-Hochberg adjusted P value and only 14 genes that meet the adjusted P value threshold (P < 0.05) are displayed. Blue circles indicate 11 apoptosis/TNF receptor proteins, and red circle indicate 3 other proteins. For this analysis, we analyzed 9,901 proximal tubule cells and 1,577 PT_VCAM1 cells. (C) Pearson correlation between an aggregate measure of Hallmark 205 apoptosis genes (apoptosis index) and genes encoding the 46 circulating ESKD risk–associated proteins was computed for the PT_VCAM1 cell state. Asterisks indicate genes that are significantly correlated with apoptosis index using an unadjusted P < 0.05. Genes that are filled gray were not detected in the snRNA-Seq dataset in the PT_VCAM1 cell state. Names in red indicate apoptosis/TNF receptor proteins. (D) Pearson correlation between an aggregate measure of hallmark 205 apoptosis genes (apoptosis index) and genes encoding the 46 circulating ESKD risk–associated proteins following imputation. See Supplemental Figures 1 and 2. (E) Escape hypothesis. Healthy proximal tubules express markers like SLC34A1 that mediate normal homeostatic functions. When proximal tubules are injured, they begin to express markers like VCAM1, CD24, and CD133 (21). The injured cells overexpressed genes encoding for the apoptosis/TNF receptor proteins, which are released into circulation. A subset of injured proximal tubule cells ultimately progress to apoptosis.
Figure 7
Figure 7. Risk of ESKD according to apoptosis score determined at baseline examination.
(A) Cumulative incidence of ESKD during 15 years of follow-up according to quartiles of baseline apoptosis score. (B) ORs for 15-year risk of ESKD according to baseline quartiles of apoptosis score (score regarded as a categorical variable) without and with adjustment for relevant covariates: adjusted-1 (eGFR, ACR, HbA1c, and study indicator) and adjusted-2 (eGFR, ACR, HbA1c, age, systolic blood pressure, and study indicator). The ORs are represented on log10 scale.
Figure 8
Figure 8. Venn diagram of overlapping proteins measured by OLINK and SOMAscan platforms.
The small circles feature numbers of ESKD risk–associated proteins. Among 138 proteins measured by both platforms, there were 33 ESKD risk–associated proteins detected by 1 or both platforms. See more details about these proteins in Figure 9 below. Among proteins measured only on OLINK platform, 18 proteins were associated with ESKD risk. Among proteins measured only on SOMAscan platform, 13 proteins were associated with ESKD risk. Previously published results for SOMAscan measurements were used for comparisons (10).
Figure 9
Figure 9. Names of ESKD risk–associated circulating proteins found using OLINK and SOMAscan proteomics platforms.
(A) Proteins measured and associated with ESKD on both platforms. (B) Proteins measured on both platforms but associated with ESKD only on one platform. Asterisk indicates models adjusted for eGFR, ACR, HbA1c, and 2 study indicator. ORs for ESKD risk within 15 years are presented per 1 quartile increase in protein and ACR levels. Results obtained in the current study. Double asterisk indicates models adjusted for eGFR, log2ACR, HbA1c, and cohort indicator. ORs for onset of ESKD within 10 years are presented per 1 quartile increase in protein levels. Reanalyzed results from our previous publications are shown (10). #Circulating proteins enriching apoptosis/TNF receptor signaling pathways. Proteins with orange showed strong association with ESKD risk only for OLINK measurements. Proteins with blue showed association with ESKD risk only for SOMAscan measurements.

References

    1. NIH. United States Renal Data System. https://www.niddk.nih.gov/about-niddk/strategic-plans-reports/usrds Accessed September 4, 2024.
    1. Krolewski AS, et al. Fast renal decline to end-stage renal disease: an unrecognized feature of nephropathy in diabetes. Kidney Int. 2017;91(6):1300–1311. doi: 10.1016/j.kint.2016.10.046. - DOI - PMC - PubMed
    1. Fujii M, et al. Current status of the rapid decline in renal function due to diabetes mellitus and its associated factors: analysis using the National Database of Health Checkups in Japan. Hypertens Res. 2023;46(5):1075–1089. doi: 10.1038/s41440-023-01185-2. - DOI - PMC - PubMed
    1. Thomas MC, et al. Diabetic kidney disease. Nat Rev Dis Primers. 2015;1:15018. doi: 10.1038/nrdp.2015.18. - DOI - PMC - PubMed
    1. Gold L, et al. Aptamer-based multiplexed proteomic technology for biomarker discovery. PLoS One. 2010;5(12):e15004. doi: 10.1371/journal.pone.0015004. - DOI - PMC - PubMed