. 2024 Dec;11(46):e2410927.
doi: 10.1002/advs.202410927. Epub 2024 Oct 22.

Enriched Environment Reduces Seizure Susceptibility via Entorhinal Cortex Circuit Augmented Adult Neurogenesis

Affiliations

Enriched Environment Reduces Seizure Susceptibility via Entorhinal Cortex Circuit Augmented Adult Neurogenesis

Zhongxia Li et al. Adv Sci (Weinh). 2024 Dec.

Abstract

Enriched environment (EE), characterized by multi-sensory stimulation, represents a non-invasive alternative for alleviating epileptic seizures. However, the mechanism by which EE exerts its therapeutic impact remains incompletely understood. Here, it is elucidated that EE mitigates seizure susceptibility through the augmentation of adult neurogenesis within the entorhinal cortex (EC) circuit. A substantial upregulation of adult hippocampal neurogenesis concomitant with a notable reduction in seizure susceptibility has been found following exposure to EE. EE-enhanced adult-born dentate granule cells (abDGCs) are functionally activated during seizure events. Importantly, the selective activation of abDGCs mimics the anti-seizure effects observed with EE, while their inhibition negates these effects. Further, whole-brain c-Fos mapping demonstrates increased activity in DG-projecting EC CaMKIIα+ neurons in response to EE. Crucially, EC CaMKIIα+ neurons exert bidirectional modulation over the proliferation and maturation of abDGCs that can activate local GABAergic interneurons; thus, they are essential components for the anti-seizure effects mediated by EE. Collectively, this study provides compelling evidence regarding the circuit mechanisms underlying the effects of EE treatment on epileptic seizures, shedding light on the involvement of the EC-DG circuit in augmenting the functionality of abDGCs. This may help for the translational application of EE for epilepsy management.

Keywords: EC‐DG pathway; enriched environment; epilepsy; neurogenesis.


Conflict of interest statement

The authors declare no conflict of interest.

Figures

Figure 1
Figure 1
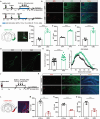
EE enhances AHN and reduces seizure susceptibility. A) Experiment scheme of using BrdU and DCX to label neuron proliferation in adult subgranular zone (SGZ) in the EE condition. BrdU was administered at the last 3 days of EE treatment. Perfusion was conducted 3 days post the last injection of BrdU and immunohistochemistry was then carried out. B) Representative images of BrdU and DCX labeling of EE treatment (bar = 100 µm). C–E) Proliferative activity in the SGZ was significantly increased for mice after EE treatment compared with housed in home cage (HC). n = 4 for each group, *p<0.05, compared with control; Mann Whitney test. F) Experiment scheme for examining the effect of EE on seizures susceptibility in a PTZ‐induced seizure model. G) Typical EEGs and power spectrograms recorded from the cortex in a PTZ induced seizure model. H–K) Effects of EE treatment on seizure susceptibility in a PTZ‐induced seizure model; H) latency to onset, stage 4, and stage 6; I) number of doses of PTZ required to reach stage 4 and stage 6; J) percent of mice reaching GS with increasing number of doses; K) percent of death with increasing number of doses. n = 11 for each group, *p<0.05, **p<0.01, ***p<0.001; for H, I Two‐way ANOVA followed by Sidak's test; for J, K, Log‐rank (Mantel‐Cox) tests were used to compare whole curves.
Figure 2
Figure 2
Chemogenetic activation of abDGCs reduces seizure susceptibility. A) Schematic diagram of the Ca2+ fiber photometry experiment. Fluorometric monitoring was carried out 4 weeks after the virus being injected to label abDGCs. Representative images of labelled abDGCs when they were 3d, 1w, 2w were shown separately. B) Configuration for fluorometric monitoring of Ca2+ signaling of abDGCs and simultaneous EEG recording during seizures. C) Representative trace showed the responses of GCaMP signals aligning with EEG recordings during seizures. D) The statistical value of △F/F0 was shown separately for each mouse (n = 8, *p<0.05, Paired t‐tests). E) Experiment scheme for chemogenetic activation of the abDGCs in a PTZ‐induced seizure model. 4 weeks after the injection of AAV‐EF1a‐DIO‐hM3Dq‐mCherry (at physiological states) to label newborn abDGCs, the first injection of PTZ was given to induce seizures. CNO was injected (1.0 mg kg−1, i.p.) 30 min before the first injection of PTZ to silence abDGCs. AAV‐EF1a‐DIO‐mCherry was used as control virus. A representative image of mCherry‐labelled abDGCs was shown, white arrows point to the labelled abDGCs. F–I) Effects of chemogenetic activation of abDGCs on seizures susceptibility in a PTZ‐induced seizure model; F) latency to onset, stage 4, and stage 6; G) percent of mice reaching GS with increasing number of doses; H) percent of death with increasing number of doses; I) number of doses of PTZ required to reach stage 4 and stage 6. n = 9 for mCherry, n = 11 for hM3Dq, *p<0.05, **p<0.01, ***p<0.001, ****p<0.0001; for F, I Two‐way ANOVA followed by Sidak's test; for G, H Log‐rank (Mantel‐Cox) tests were used to compare whole curves. J) Typical EEGs and power spectrograms recorded from the cortex during seizures in a PTZ‐induced seizure model.
Figure 3
Figure 3
Inhibition of abDGCs abolishes the anti‐seizure effect of EE treatment. A) Experiment scheme for evaluating the effects of chemogenetically inhibiting the abDGCs generated during EE treatment on seizure susceptibility in a PTZ‐induced seizure model. Virus was injected at the last day of EE to label newborn abDGCs in response to EE. 4 weeks after the injection of AAV‐EF1a‐DIO‐hM4Di‐mCherry to label newborn abDGCs, the first injection of PTZ was given to induce seizures. CNO was injected (1.0 mg kg−1, i.p.) 30 min before the first injection of PTZ. A representative image of mCherry‐labelled abDGCs was shown, white arrows point to the labelled abDGCs. B–E) Effects of chemogenetic inhibition of abDGCs in EE on seizure susceptibility in a PTZ‐induced seizure model; B) latency to onset, stage 4 and stage 6; C) percent of mice reaching GS with increasing number of doses; D) percent of death with increasing number of doses; E) number of doses of PTZ required to stage 4 and stage 6. n = 10 for each group, *p<0.05, **p<0.01, ***p<0.001, ****p<0.0001, for B, E Two‐way ANOVA followed by Tukey's test; for C, D Log‐rank (Mantel‐Cox) tests were used to compare whole curves. F) Typical EEGs and power spectrograms recorded from the cortex during seizures in a PTZ induced seizure model.
Figure 4
Figure 4
EE increases neural excitability of DG‐projecting EC CaMKIIα+ neurons. A) Experiment scheme of whole‐brain c‐Fos mapping in response to EE treatment. Mice were perfused 1.5 h post the termination of EE treatment. B) Representative images indicating the distribution of c‐Fos+ neurons in EC and CA3 (bar = 100 µm). C) The number of c‐Fos+ neurons in relevant brain regions of mice housed in HC (control) and after EE treatment. (n = 3 for each group ***p<0.001, ****p<0.0001, compared with control; Two‐way ANOVA followed by Sidak's test). D) Most (51%) of the c‐Fos+ neurons we identified were distributed in EC. E) Experiment scheme of c‐Fos labeling in response to EE in DG‐projecting EC neurons. CTB‐555 was injected into DG (bar = 100 µm) to visualize DG‐projecting neurons. F) The percentage of c‐Fos+ in DG‐projecting EC neurons (n = 4). G) Representative images indicating the distribution of c‐Fos+ DG‐projecting CaMKIIα+ neurons in EC (bar = 100 µm). H) The percentage of CaMKIIα+ in DG‐projecting EC c‐Fos+ neurons (n = 4). I) Diagram of fiber photometry recording of free‐moving mice in HC and EE for 10 min. J) Left: Diagram of calcium recording of DG‐projecting EC neurons. AAV2/2Retro‐DIO‐GCaMP6m‐WPRE‐pA was injected into the DG in CaMKIIα‐Cre mice to express GCaMP6 onto DG‐projecting CaMKIIα+ neurons and optical fiber was inserted into EC to collect calcium signals. Right: Representative image of GCaMP6m expression in EC neurons (bar = 100 µm). K) Mean fluorescence values of population activity of DG‐projecting EC neurons in the HC and EE. L) Heatmaps showing change of calcium signals. M) The statistical value of △F/F0 was shown for each mouse (n = 11, ***p<0.001, Paired t‐tests).
Figure 5
Figure 5
Chronic patterned optogenetic activation of EC CaMKIIα+ neurons increases proliferating abDGCs with improved developmental properties. A) Experiment scheme for optogenetic stimulation of EC CaMKIIα+ neurons. Blue light stimulation was given daily for 7 continuous days and the parameter was: 473 nm, 20 Hz, 10 ms pulse−1, 10s on/ 20s off, 5 mW and 15 min. Upper: using BrdU and DCX to label neuron proliferation in adult SGZ and perfusion was performed 3 days post the optogenetic stimulation. Lower: using pUX‐GFP virus to visualize abDGCs morphology in adult SGZ. Perfusion was performed 4w post the optogenetic stimulation to allow the morphological maturation of abDGCs. B) Representative images of BrdU+ DCX+ cells in the DG (bar = 100 µm). C) Histochemical verification of ChR2 (green) expression in the EC (bar = 100 µm). D–F) Proliferative activity in the SGZ was significantly increased after optogenetic stimulation of EC CaMKIIα+ neurons (n = 5 for each group **** p<0.0001, compared with control; Paired t‐tests). G) Representative confocal images of GFP‐immunoreactive cells (bar = 100 µm). H) abDGCs showed longer total dendritic length after optogenetic stimulation of EC CaMKIIα+ neurons (n = 4 for each group with 4 typical neurons considered for each animal, ****p<0.0001, compared with control; Student's t‐tests). I) Sholl analysis of abDGCs (n = 4 for each group ***p<0.001, compared with control; Student's t tests). J) Experiment scheme for chemogenetic inhibition of EC CaMKIIα+ neurons in mice for 7 continuous days. 4 weeks after virus injection, CNO (i.p. 1.0 mg kg−1) was given daily with BrdU (i.p. 100 mg kg−1) infused 30 min later. Perfusion was performed 3 days post the completion of chemogenetic inhibition. K) Representative images of BrdU+ DCX+ cells in the DG (bar = 100 µm). L) Immunostaining of hM4Di (red) expression in the EC (bar = 100 µm). M–O) Proliferative activity in the SGZ was significantly decreased after chemogenetic inhibition of EC CaMKIIα+ neurons (n = 4 for mCherry, n = 3 for hM4Di, **p<0.01, *** p<0.001, Student's t‐tests).
Figure 6
Figure 6
Inhibition of EC abolishes the effect of EE treatment in enhancing AHN and reducing seizure susceptibility. A) Experiment scheme for examining the effect of chemogenetically inhibiting EC CaMKIIα+ neurons on AHN during EE treatment. The treatment of EE was initiated 4 weeks after the virus injection to allow sufficient expression of pAAV2/8‐CaMKIIα‐hM4D(Gi)‐mCherry‐3xFlag‐WPRE. BrdU (i.p. 100 mg kg−1, daily) was administered at the last three days of EE treatment and CNO (i.p. 1.0 mg kg−1, daily) was infused 30 min before everyday EE for 14 consecutive days. B) Representative images of BrdU+ DCX+ cells in the DG (bar = 100 µm). C) Immunostaining of hM4Di (red) expression in the EC (bar = 100 µm). D–F) Effects of chemogenetic inhibition of EC CaMKIIα+ neurons in EE on AHN (n = 6 for each group *p<0.05, ****p<0.0001, compared with control; Student's t‐tests). G) Experiment scheme for chemogenetic inhibition of EC CaMKIIα+ neurons during EE treatment in a PTZ‐induced seizure model. CNO was administrated for 14 days during EE treatment (30 min before EE, i.p. 1.0 mg kg−1, daily). Immunostaining of hM4Di (red) expression in the EC (bar = 100 µm). H–K) Effects of chemogenetic inhibition of EC CaMKIIα+ neurons in EE on seizure susceptibility in a PTZ‐induced seizure model; H) latency to onset, stage 4 and stage 6; I) percent of mice reaching GS with increasing number of doses; J) percent of death with increasing number of doses; K) number of doses to stage 4 and stage 6. n = 10 for each group; for H,K Two‐way ANOVA followed by Tukey's test; for I, J Log‐rank (Mantel‐Cox) tests were used to compare whole curves. L) Typical EEGs and power spectrograms recorded from the cortex during seizures in a PTZ‐induced seizure model.
Figure 7
Figure 7
The abDGCs activate local anti‐seizure GABAergic neurons. A) Diagram of calcium recording of GABAergic neurons. AAV2/9‐mDlx‐GCaMP6s‐WPRE‐pA, AAV2/9‐FLEX‐ChrimsonR and pUX‐Cre cocktail virus were injected into DG. The parameter of red‐light stimulation is: 635 nm, 20 Hz, 10s on/off, 5 mW. B) Histochemical verification of GCaMP6m (green) and ChrimsonR (red) expression in the DG (bar = 100 µm). C) Configuration for fluorometric monitoring of Ca2+ signaling of GABAergic neurons. D) Mean fluorescence values showed that optogenetic activation of abDGCs (10s on‐off, 635 nm) increased Ca2+ level in local GABAergic neurons reliably. E) Heatmaps showing calcium signals. F) The statistical value of △F/F0 was shown for each mouse (n = 10, ****p<0.0001, Paired t‐tests). G) Experiment scheme for chemogenetic activation of GABAergic neurons in a PTZ‐induced seizure model. CNO was injected (1.0 mg kg−1, i.p.) 30 min before the first injection of PTZ. Histochemical verification of hM3D‐expressing GABAergic interneurons and double immunostaining of GABA (green) and hM3D (red) was shown (bar = 100 µm). H) Typical EEGs and power spectrograms recorded from the cortex during seizures in a PTZ induced seizure model. I–L) Effects of chemogenetic activation of GABAergic interneurons on seizure susceptibility; I) latency to onset, stage 4 and stage 6; J) number of doses to stage 4 and stage 6; K) percent of mice reaching GS with increasing number of doses; L) percent of death with increasing number of doses. n = 15 for each group, *p<0.05, **p<0.01; for I, J Two‐way ANOVA followed by Sidak's test were used; for K, L Log‐rank (Mantel‐Cox) tests were used to compare whole curves.

References

    1. a) Devinsky O., Vezzani A., O'Brien T. J., Jette N., Scheffer I. E., de Curtis M., Perucca P., Nat. Rev. Dis. Primers. 2018, 4, 18024; - PubMed
    2. b) Thijs R. D., Surges R., O'Brien T. J., Sander J. W., Lancet. 2019, 393, 689. - PubMed
    1. a) Loscher W., Klitgaard H., Twyman R. E., Schmidt D., Nat. Rev. Drug Discov. 2013, 12, 757; - PubMed
    2. b) Wang Y., Chen Z., Pharmacol. Ther. 2019, 201, 77. - PubMed
    1. a) Jetté N., Sander J. W., Keezer M. R., Lancet Neurol. 2016, 15, 982; - PubMed
    2. b) Chen J., Li Z., Chen L., Acta Epileptologica. 2022, 4, 35.
    1. a) Kempermann G., Kuhn H. G., Gage F. H., Nature. 1997, 386, 493; - PubMed
    2. b) Vrinda M., Sasidharan A., Aparna S., Srikumar B. N., Kutty B. M., Shankaranarayana Rao B. S., Epilepsia. 2017, 58, 1148; - PubMed
    3. c) Gorantla V. R., Thomas S. E., Millis R. M., J. Epilepsy Res. 2019, 9, 51. - PMC - PubMed
    1. a) Cutuli D., Landolfo E., Petrosini L., Gelfo F., J. Alzheimer's Dis.: JAD. 2022, 85, 975; - PubMed
    2. b) Miller L. S., Colella B., Mikulis D., Maller J., Green R. E., Front. Hum. Neurosci. 2013, 7, 506. - PMC - PubMed

Substances

LinkOut - more resources