. 2024 Nov 6;15(21):3915-3931.
doi: 10.1021/acschemneuro.4c00282. Epub 2024 Oct 22.

Evaluation of Alpha-Synuclein and Tau Antiaggregation Activity of Urea and Thiourea-Based Small Molecules for Neurodegenerative Disease Therapeutics

Affiliations

Evaluation of Alpha-Synuclein and Tau Antiaggregation Activity of Urea and Thiourea-Based Small Molecules for Neurodegenerative Disease Therapeutics

Susantha K Ganegamage et al. ACS Chem Neurosci. .

Abstract

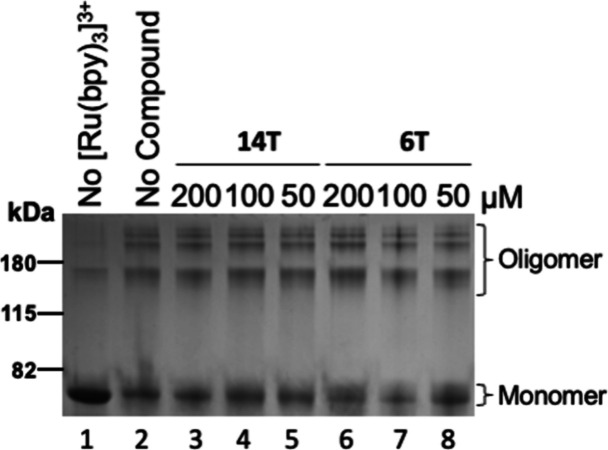
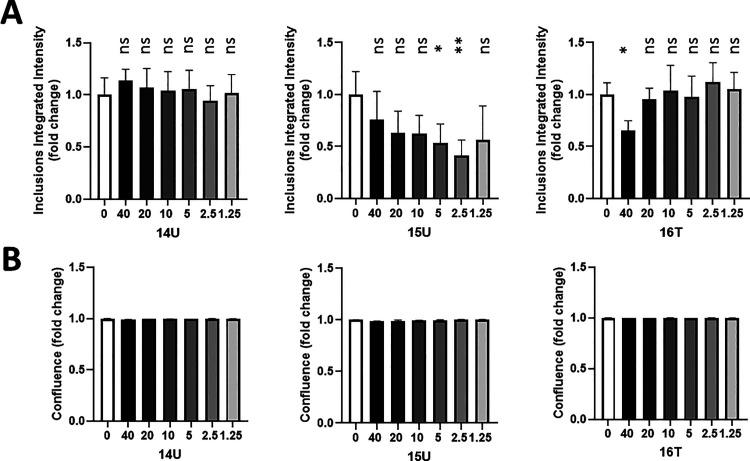
Alzheimer's disease (AD) and Parkinson's disease (PD) are multifactorial, chronic diseases involving neurodegeneration. According to recent studies, it is hypothesized that the intraneuronal and postsynaptic accumulation of misfolded proteins such as α-synuclein (α-syn) and tau, responsible for Lewy bodies (LB) and tangles, respectively, disrupts neuron functions. Considering the co-occurrence of α-syn and tau inclusions in the brains of patients afflicted with subtypes of dementia and LB disorders, the discovery and development of small molecules for the inhibition of α-syn and tau aggregation can be a potentially effective strategy to delay neurodegeneration. Urea is a chaotropic agent that alters protein solubilization and hydrophobic interactions and inhibits protein aggregation and precipitation. The presence of three hetero atoms (O/S and N) in proximity can coordinate with neutral, mono, or dianionic groups to form stable complexes in the biological system. Therefore, in this study, we evaluated urea and thiourea linkers with various substitutions on either side of the carbamide or thiocarbamide functionality to compare the aggregation inhibition of α-syn and tau. A thioflavin-T (ThT) fluorescence assay was used to evaluate the level of fibril formation and monitor the anti-aggregation effect of the different compounds. We opted for transmission electron microscopy (TEM) as a direct means to confirm the anti-fibrillar effect. The oligomer formation was monitored via the photoinduced cross-linking of unmodified proteins (PICUP). The anti-inclusion and anti-seeding activities of the best compounds were evaluated using M17D intracellular inclusion and biosensor cell-based assays, respectively. Disaggregation experiments were performed with amyloid plaques extracted from AD brains. The analogues with indole, benzothiazole, or N,N-dimethylphenyl on one side with halo-substituted aromatic moieties had shown less than 15% cutoff fluorescence obtained with the ThT assay. Our lead molecules 6T and 14T reduced α-syn oligomerization dose-dependently based on the PICUP assays but failed at inhibiting tau oligomer formation. The anti-inclusion effect of our lead compounds was confirmed using the M17D neuroblastoma cell model. Compounds 6T and 14T exhibited an anti-seeding effect on tau using biosensor cells. In contrast to the control, disaggregation experiments showed fewer Aβ plaques with our lead molecules (compounds 6T and 14T). Pharmacokinetics (PK) mice studies demonstrated that these two thiourea-based small molecules have the potential to cross the blood-brain barrier in rodents. Urea and thiourea linkers could be further improved for their PK parameters and studied for the anti-inclusion, anti-seeding, and disaggregation effects using transgenic mice models of neurodegenerative diseases.

Keywords: Alzheimer’s disease; Parkinson’s disease; anti-aggregation; neurodegeneration; thiourea; urea.


Conflict of interest statement

The authors declare no competing financial interest.

Figures

Scheme 1
Scheme 1. Synthesis of Urea (U) and Thiourea (T) Analogues Using Respective Isocyanate and Isothiocyanate Reacting with Amines (R1 = H, Me, Et, or i-Pr and R2 = H)
Figure 1
Figure 1
Kinetics of α-syn aggregation showed a delay in the lag time (time for the elevation in fluorescence intensity) in the presence of compounds 14T and 6T, indicative of inhibition of oligomer formation. Compound 14T inhibited the α-syn aggregation in a dose-dependent manner. The ThT fluorescence assay was employed to analyze the kinetic curves of compounds 14T and 6T at a concentration of 100 μM with (A) α-syn (6 μM) and (B) compound 14T dose-dependent inhibition at varying concentrations (3.125, 6.25, 12.5, 25, 50, and 100 μM) against α-syn (6 μM) fibril formation. Data were collected in triplicate for each concentration at the plateau phase over the course of five consecutive time points. The error bars indicate the SEM for each condition.
Figure 2
Figure 2
ThT kinetic curve showing the effect of the best anti-fibrillary compound (14T and 6T) when assessed with different tau isoforms. The compounds were tested at a concentration of 100 μM along with 10 μM (10:1), including (A) tau 0N3R, (B) tau 2N3R, and (C) tau 2N4R. Several compounds were tested for their anti-fibrillary effect on tau 2N3R. The best anti-fibrillary compounds were 14T and 6T when assessed with tau 0N3R and 2N4R. The kinetics were performed in the presence of 2.5 μM heparin, 1 mM dithiothreitol (DTT), 1 mM 4-(2-aminoethyl) benzenesulfonyl fluoride hydrochloride, and 30 μM ThT in a buffer solution containing 50 mM Tris and 25 mM NaCl, at pH 7.4. The positive control was the tau isoform without compound treatment. The background (BG) signal was obtained with all components in the absence of tau proteins and compounds. The depicted curves represent the average data obtained from three technical replicates.
Figure 3
Figure 3
Compounds 6T and 14T stopped the formation of α-syn-induced oligomer formation resulting from the exposure of Tris(2,2′-bipyridyl)ruthenium(II) chloride (Ru(bpy)3) and APS to light (1 s) through the PICUP cross-linking assay. At 60 μM, α-syn was subjected to cross-linking (PICUP assay) with 6T, 14U, 14T, 15U, and 16T at 100 μM. Compounds 6T and 14T effectively prevented the formation of oligomers observed between 35 and 40 kDa. The high molecular weight α-syn oligomer was observed in the Coomassie blue-stained polyacrylamide gels with the control (0.125% DMSO). Other controls include no light and no cross-linking agent (Ru(bpy)3), which yielded no cross-linked products. The numbers indicated below the gels represent the ratio of the oligomer and monomer. The pixel density of bands was acquired by using ImageJ software.
Figure 4
Figure 4
Dosage-dependent ability of compounds (A) 14T and (B) 6T to inhibit α-syn oligomerization. In the oligomer induction experiment, α-syn (60 μM) was cross-linked with different concentrations (50, 25, 12.5, 6.25, and 3.13 μM) of compounds 14T and 6T. Both compounds showed a dose-dependent ability to stop the oligomerization of α-syn. The control consisted of DMSO (0.125%). The pixel density of monomer and oligomer bands presented in the table was measured for each lane using ImageJ.
Figure 5
Figure 5
Using the PICUP assay, the anti-oligomerization activity of the most promising compounds against tau 0N4R was evaluated in a dose–response manner. In this assay, compounds 14T and 6T at varying concentrations, 50, 100, and 200 μM, were incubated with the protein (12 μM). Bands indicating higher molecular weights appeared in the control condition, which lacked both light exposure and the cross-linking agent, Ru(bpy)3. The anti-oligomer effect was observed for compound 6T at 100 μM and 200 μM. The pixel density of monomer and oligomer bands presented in the table was measured for each lane using ImageJ.
Figure 6
Figure 6
Dose-dependent inhibitory effect of compounds 14T and 6T on tau 2N4R (6 μM) oligomerization via PICUP. Both compounds did not demonstrate dose-dependent inhibition of tau 2N4R oligomerization. The control conditions (no compound treatment and Ru(bpy)3) exhibited high molecular weight tau 2N4R oligomers.
Figure 7
Figure 7
Effectiveness of compound 6T (50 μM) in preventing tau 0N3R oligomerization was tested at 10 μM through the PICUP assay. The control groups that did not contain Ru(bpy)3 and had no light exposure showed no higher molecular weights.
Figure 8
Figure 8
Effect of compounds 6T and 14T on preventing the formation of α-syn mature fibrils was examined by TEM. (A) α-Syn (2 μM) was exposed to DMSO (0.25%; “CTRL”). (B) α-Syn (2 μM) received treatment with compound 6T at 100 μM. (C) α-Syn (2 μM) underwent treatment with compound 14T at 100 μM. All samples were incubated for approximately 22 h before TEM visualization. Scale bars represent 200 nm.
Figure 9
Figure 9
TEM evaluation of the dose-dependent effect of compounds 6T and 14T on preventing the formation of α-syn mature fibrils. The protein α-syn (6 μM) was exposed to DMSO (0.25%; “CTRL”), and the compounds were tested at 6.25 or 12.5, 25, and 100 μM. The samples were left to incubate for approximately 22 h at 37 °C before being visualized. Scale bars represent 200 nm.
Figure 10
Figure 10
Treatment with compounds 6T and 14T led to a reduction in tau 2N4R (10 μM) fibrils, as observed through TEM. Unfolded tau 2N4R was incubated with DMSO at 0.25% (CTRL, control), compound 6T at 100 μM, and compound 14T at 100 μM. TEM images were taken at 40k magnification. Scale bars represent 200 nm.
Figure 11
Figure 11
Compound 14T delayed the conversion of α-syn into the beta-sheet conformation at 48 h by CD analysis. CD spectra were recorded to provide structural information after the treatment of α-syn (at 15 μM) with 0.25% DMSO (control) or 100 μM compounds 14T for 0, 48, and 72 h. The buffer consisted of 10 mM PBS supplemented with 0.5 mM SDS and 300 mM NaCl. Samples were incubated for 48 and 72 h at 37 °C before the analysis. CD spectra were recorded. The BG signal (buffer alone) was subtracted.
Figure 12
Figure 12
Compound 6T demonstrated a reduction in Aβ plaques, as confirmed through TEM. Aβ (0.217 ± 0.042 mg/mL) obtained from the brain of an AD patient underwent incubation with DMSO (0.25%; referred to as control), compound 6T (at 50 μM), or compound 14T (at 50 μM) for 5 days before TEM visualization. Scale bars represent 200 nm.
Figure 13
Figure 13
Compound 6T reduced the formation of oligomer following the disaggregation experiment performed with α-syn fibrils. Mature α-syn fibrils were incubated with 100 μM compound 6T for 4 days at 37 °C and then loaded in 16% SDS–PAGE gel. The Western blot was assessed using anti-alpha-syn 33 to recognize the oligomers (bands higher than 35 kDa). The control consisted of the vehicle (0.25% DMSO).
Figure 14
Figure 14
Compounds 14U, 15U, and 16T did not prevent substantially α-syn inclusion formation at a low micromolar concentration. (A) M17D cells expressing the inclusion-prone αS-3K::YFP fusion protein (dox-inducible) were treated with 0.1% DMSO (vehicle; “0 μM”) as well as 1.25, 2.5, 5, 10, 20, and 40 μM of compounds 14U, 15U, and 16T at t = 24 h after plating. Cells were induced with dox at t = 48 h. Incucyte-based analysis of punctate YFP signals relative to 0.1% DMSO was done at t = 96 h (N = 2 independent experiments, n = 6–12 individual wells total 0 μM, n = 12; 40, 20, and 10 μM, n = 6; all other concentrations, n = 12). (B) Plot of confluence fold changes relative to the DMSO vehicle (0 μM). All data are presented as fold changes relative to DMSO control +/– standard deviation. One-way ANOVA, Dunnett’s post hoc test; ∗p < 0.05; ∗∗p < 0.01; ∗∗∗p < 0.001; ****p < 0.0001; ns, non-significant.
Figure 15
Figure 15
Compound 14T mainly prevents α-syn inclusion formation. M17D cells expressing the inclusion-prone αS-3K::YFP fusion protein (dox-inducible) were treated with 0.1% DMSO (vehicle; “0 μM”) as well as 1.25, 2.5, 5, 10, 20, and 40 μM of compounds 6T and 14T at t = 24 h after plating. Cells were induced with dox at t = 48 h. (A) Incucyte-based analysis of punctate YFP signals relative to 0.1% DMSO was done at t = 96 h in N = 4 (compound 6T) or N = 3 (compound 14T) independent experiments, n = 9–24 individual wells total. For compound 6T: 0 μM, n = 18; 40, 20, and 10 μM, n = 9; all other concentrations, n = 18. For compound 14T: 0 μM, n = 24; 40, 20, and 10 μM, n = 11; all other concentrations, n = 24. (B) Same as panel (A), but confluence fold changes relative to the DMSO vehicle (0 μM) were plotted. (C) Representative Incucyte images of reporter cells treated with the vehicle vs 40 μM compounds 6T and 14T (t = 96 h), phase and green channel. Arrows indicate αS-rich and YFP-positive inclusions. Scale bar represents 50 μM. All data are presented as fold changes relative to DMSO control +/– standard deviation. Kruskal–Wallis tests plus Dunn’s multiple comparisons test; ∗p < 0.05; ∗∗∗p < 0.001; ∗∗∗∗p < 0.0001, ns, non-significant.
Figure 16
Figure 16
Compounds 6T and 14T reduce the tau seeding activity in vitro. (A) Schematic of the experimental setup to test the effect of compounds on tau seeding activity. The htauP301S plasmid was transfected to overexpress tau in HEK 293T cells, and the cells were treated with the compounds 24 h later. Cell viability and tau seeding activity were assessed 48 h after treatment with compounds. (B) Viability of HEK cells after treatment with the compounds. The compound treatments in HEK 293T were performed in 3 biological replicates (N = 3 per condition). (C) Representative images of the FRET signal from biosensor cells after transfection with HEK cell lysates. (D) Seeding activity of cells overexpressing htauP301S and after treatment with the compounds. Values are given as the means ± SEM of two technical replicates of the N = 3 treated HEK 293T cells (B). Significance was determined by unpaired one-way analysis of variance (ANOVA).
Figure 17
Figure 17
Mean plasma and brain concentration–time curve of compounds (A) 6T, (B) 14T, and (C) 19U in CD1 male mouse after intravenous administration of 1 mg/kg. Data are expressed as mean with the standard deviation.

References

    1. Knopman D. S.; Amieva H.; Petersen R. C.; Chetelat G.; Holtzman D. M.; Hyman B. T.; Nixon R. A.; Jones D. T. Alzheimer disease. Nat. Rev. Dis. Primers 2021, 7 (1), 33.10.1038/s41572-021-00269-y. - DOI - PMC - PubMed
    1. Breijyeh Z.; Karaman R. Comprehensive Review on Alzheimer’s Disease: Causes and Treatment. Molecules 2020, 25 (24), 5789.10.3390/molecules25245789. - DOI - PMC - PubMed
    1. Brandt R.; Hundelt M.; Shahani N. Tau alteration and neuronal degeneration in tauopathies: mechanisms and models. Biochim. Biophys. Acta 2005, 1739 (2–3), 331–354. 10.1016/j.bbadis.2004.06.018. - DOI - PubMed
    1. Mandelkow E.; von Bergen M.; Biernat J.; Mandelkow E. M. Structural principles of tau and the paired helical filaments of Alzheimer’s disease. Brain Pathol. 2007, 17 (1), 83–90. 10.1111/j.1750-3639.2007.00053.x. - DOI - PMC - PubMed
    1. Guo T.; Noble W.; Hanger D. P. Roles of tau protein in health and disease. Acta Neuropathol 2017, 133 (5), 665–704. 10.1007/s00401-017-1707-9. - DOI - PMC - PubMed

Publication types

MeSH terms