. 2024 Nov 27;52(21):13073-13093.
doi: 10.1093/nar/gkae871.

Intra-host genomic diversity and integration landscape of human tissue-resident DNA virome

Affiliations

Intra-host genomic diversity and integration landscape of human tissue-resident DNA virome

Lari Pyöriä et al. Nucleic Acids Res. .

Abstract

The viral intra-host genetic diversities and interactions with the human genome during decades of persistence remain poorly characterized. In this study, we analyzed the variability and integration sites of persisting viruses in nine organs from thirteen individuals who died suddenly from non-viral causes. The viruses studied included parvovirus B19, six herpesviruses, Merkel cell (MCPyV) and JC polyomaviruses, totaling 127 genomes. The viral sequences across organs were remarkably conserved within each individual, suggesting that persistence stems from single dominant strains. This indicates that intra-host viral evolution, thus far inferred primarily from immunocompromised patients, is likely overestimated in healthy subjects. Indeed, we detected increased viral subpopulations in two individuals with putative reactivations, suggesting that replication status influences diversity. Furthermore, we identified asymmetrical mutation patterns reflecting selective pressures exerted by the host. Strikingly, our analysis revealed non-clonal viral integrations even in individuals without cancer. These included MCPyV integrations and truncations resembling clonally expanded variants in Merkel cell carcinomas, as well as novel junctions between herpesvirus 6B and mitochondrial sequences, the significance of which remains to be evaluated. Our work systematically characterizes the genomic landscape of the tissue-resident virome, highlighting potential deviations occurring during disease.


Figures

Graphical Abstract
Graphical Abstract
Figure 1.
Figure 1.
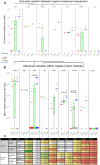
Intra-host genetic diversity of persistent DNA viruses in tissues. (A) Number of consensus mutations per site (M) when comparing organs within an individual. Each datapoint represents intra-host diversity in one individual. (B) Number of MVs (minor variant positions per site, PS), with each datapoint representing one sample. Different viruses are divided into separate panels, each containing a separate plot for CDS (red), whole genome (green) and non-CDS (blue). Horizontal lines illustrate the mean values. For the whole genome, a boxplot is shown. Datapoints at the bottom represent zero-diversity. CDS and non-CDS values within each virus species were compared with a permutation test of the means, with significant results shown in the figure. Whole genome diversity values were compared between each virus with the permutations test of the means, with Bonferroni correction for multiple comparisons. The brackets indicate a comparison of B19V or MCPyV to herpesviruses as a single group. *P< 0.05, **P< 0.01. Alternative metrics for inter-organ diversity (nucleotide diversity) and intra-organ diversity (mean site-wise Shannon index) are shown in Supplementary Figure S1. (C) Table with exact values of all the metrics of diversity (mutation/site, nucleotide diversity, polymorphic positions/site and mean site-wise Shannon index). Higher values are in shades of green and lower in yellow and red. B19V, human parvovirus B19; EBV, Epstein-Barr virus; HCMV, human cytomegalovirus; HHV-6B, human herpesvirus 6B, HHV-7, human herpesvirus 7; HSV-1, herpes simplex virus 1; JCPyV, JC polyomavirus; MCPyV, Merkel cell polyomavirus; VZV, varicella-zoster virus.
Figure 2.
Figure 2.
Intra-host variation of parvovirus B19. (A) Comparison of viral consensus sequences between different organs within an individual. Each circos plot track (numbered from 1 to 6) represents diversity in one individual, and the area illustrates an average depth coverage of the virus genomes (scale from 0 to 50×). (B) MV positions in each B19V genome. Each track (numbered from 1 to 9) represents one sample with unique individual color coding concordant with (A). The areas within tracks illustrate the depth coverage of the viral genome (scale from 0 to 100×). Both circos figures are plotted against reference genome AB550331.1. The black bars in the outer edge represent ITRs and the green bars genes. SNVs are marked with red (non-synonymous), green (synonymous) and blue (non-coding region) dots and indels with blue lines. Details of the samples are shown in both respective tables.
Figure 3.
Figure 3.
Intra-host variation of MCPyV. (A) Comparison of viral consensus sequences between hair and colon of a single individual. The area illustrates an average depth coverage of the virus genomes (scale from 0 to 500×). (B) MV positions in each MCPyV genome from plucked hair samples. Each track (numbered from 1 to 4) represents one sample with unique individual color coding concordant with (A). The areas within tracks illustrate the depth coverage of the viral genome (scale from 0 to 100–500×). Both circos figures are plotted against reference genome HM011544.1. Green bars in the outer edge represent genes. SNVs are marked with red (non-synonymous), green (synonymous) and blue (non-coding region) dots and indels with blue (non-CDS), red (CDS) or gray (frameshift) lines. Details of the samples are shown in the corresponding tables.
Figure 4.
Figure 4.
Intra-host variation of HHV-6B. (A) Comparison of viral consensus sequences between different organs within an individual. Each circos plot track (numbered from 1 to 5) represents diversity in one individual, and the area illustrates an average depth coverage of the virus genomes (scale from 0 to 200×). (B) MV positions in each HHV-6B genome. Each track (numbered from 1 to 6) represents one sample with unique individual color coding concordant with (A). The areas within tracks illustrate the depth coverage of the viral genome (scale from 0 to 200×). Both circos figures are plotted against reference genome MH698401.1. The black bars in the outer edge represent repeat regions masked from the analysis and the green bars genes. SNVs are marked with red (non-synonymous), green (synonymous) and blue (non-coding region) dots and indels with vertical lines. Details of the samples are shown in both respective tables.
Figure 5.
Figure 5.
Intra-host diversity of EBV and VZV reconstructed from a skin sample of individual with relapsed MCL. MV positions in (A) EBV genome and in (B) VZV genome. Each track represents one sample, and the areas within tracks illustrate the depth coverage of the viral genome (scale from 0 to 250× or 0 to 75×). Circos figures are plotted against reference genome MG298924.1 (EBV) or AJ871403.1 (VZV). Black bars in the outer edge represent masked repetitive regions and green bars genes. SNVs are marked with red (non-synonymous), green (synonymous) and blue (non-coding region) dots. Indels are marked with straight line. Details of the samples are shown in the corresponding tables.
Figure 6.
Figure 6.
Intra-host diversity of HCMV in an individual with metastatic pulmonary carcinoma. (A) Comparison of viral consensus sequences between different organs of an individual. Circos plot track represents diversity in one individual, and the area illustrates the average depth coverage of the virus genomes (scale from 0 to 25×). (B) MV positions in each HCMV genome. Each track (numbered from 1 to 4) represents one sample, and the areas within tracks illustrate the depth coverage of the viral genome (scale from 0 to 25×). Both circos figures are plotted against the reference genome KJ361955.1. The black bars in the outer edge represent repeat regions masked from the analysis and the green bars genes. SNVs are marked with red (non-synonymous), green (synonymous) and blue (non-coding region) dots and indels with vertical lines. Details of the samples are shown in both respective tables.
Figure 7.
Figure 7.
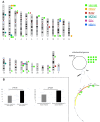
Karyogram illustrating all virus integrations reported by SurVirus. (A) On the top are all the human chromosomes accompanied by colored circles representing different virus species and their respective junctions. Triangles indicate integrations aligning equally to multiple chromosomes. At the bottom right is a mitochondrial genome with corresponding locations of HHV-6B junctions. (B) Comparison of expected (gray) and observed (black) number of integrations within genes (left) and in repeat regions (right). The P-value was calculated with chi-square test. Expected numbers were calculated assuming uniform random distribution of integrations based on the total length of genes and repeat regions in the human genome. B19V, human parvovirus B19; EBV, Epstein-Barr virus; HHV-6B, human herpesvirus 6B; HHV-7, human herpesvirus 7; HSV-1, herpes simplex virus 1; MCPyV, Merkel cell polyomavirus.

References

    1. Thomson E., Ip C.L.C., Badhan A., Christiansen M.T., Adamson W., Ansari M.A., Bibby D., Breuer J., Brown A., Bowden R.et al. .. Comparison of next-generation sequencing technologies for comprehensive assessment of full-length hepatitis C viral genomes. J. Clin. Microbiol. 2016; 54:2470–2484. - PMC - PubMed
    1. Houldcroft C.J., Beale M.A., Breuer J.. Clinical and biological insights from viral genome sequencing. Nat. Rev. Micro. 2017; 15:183. - PMC - PubMed
    1. Pyöriä L., Pratas D., Toppinen M., Hedman K., Sajantila A., Perdomo M.F.. Unmasking the tissue-resident eukaryotic DNA virome in humans. Nucleic Acids Res. 2023; 51:3223–3239. - PMC - PubMed
    1. Zapatka M., Borozan I., Brewer D.S., Iskar M., Grundhoff A., Alawi M., Desai N., Sültmann H., Moch H., Cooper C.S.et al. .. The landscape of viral associations in human cancers. Nat. Genet. 2020; 52:320–330. - PMC - PubMed
    1. Sijmons S., Thys K., Corthout M., Van Damme E., Van Loock M., Bollen S., Baguet S., Aerssens J., Van Ranst M., Maes P.. A method enabling high-throughput sequencing of human cytomegalovirus complete genomes from clinical isolates. PLoS One. 2014; 9:e95501. - PMC - PubMed

LinkOut - more resources