. 2024 Oct 22:12:RP88318.
doi: 10.7554/eLife.88318.

DYRK1A interacts with the tuberous sclerosis complex and promotes mTORC1 activity

Affiliations

DYRK1A interacts with the tuberous sclerosis complex and promotes mTORC1 activity

Pinhua Wang et al. Elife. .

Abstract

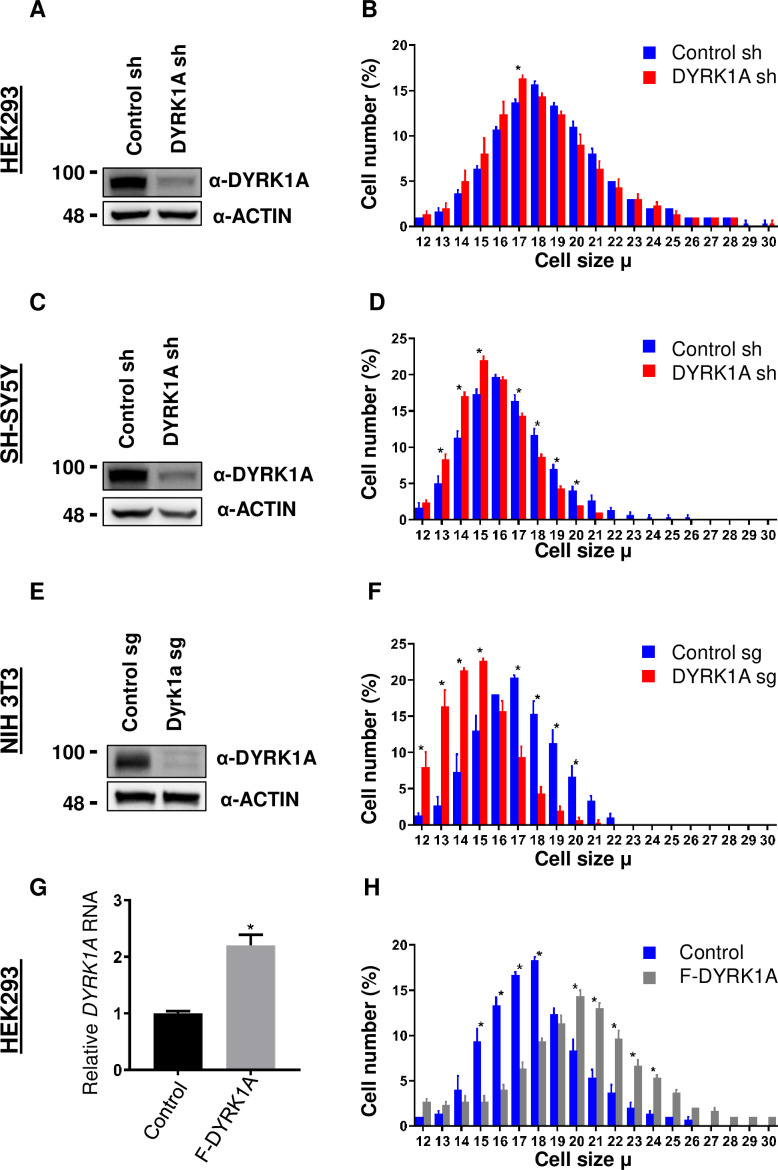
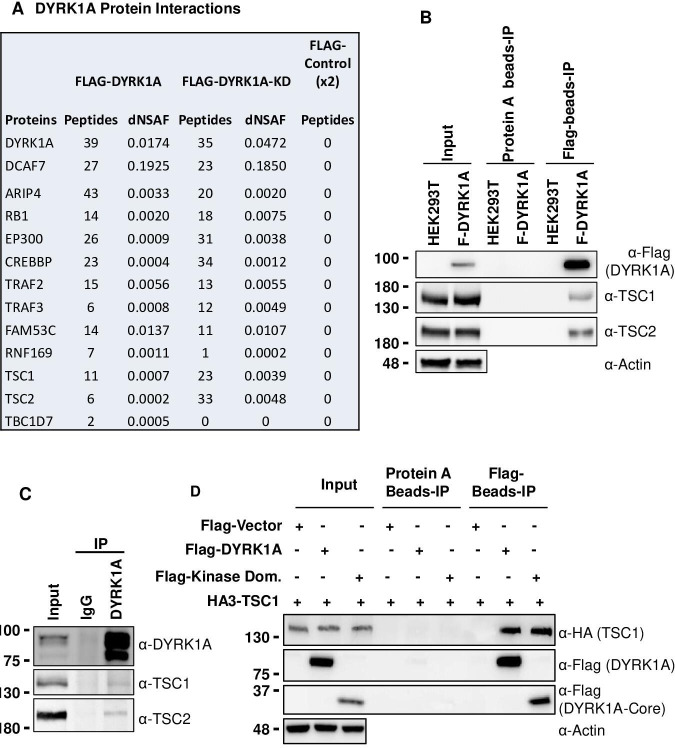
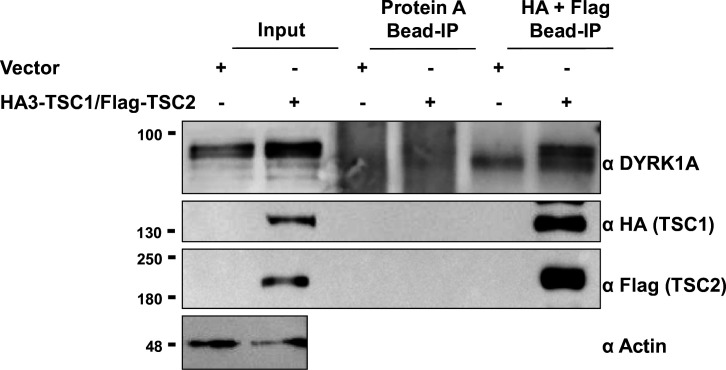
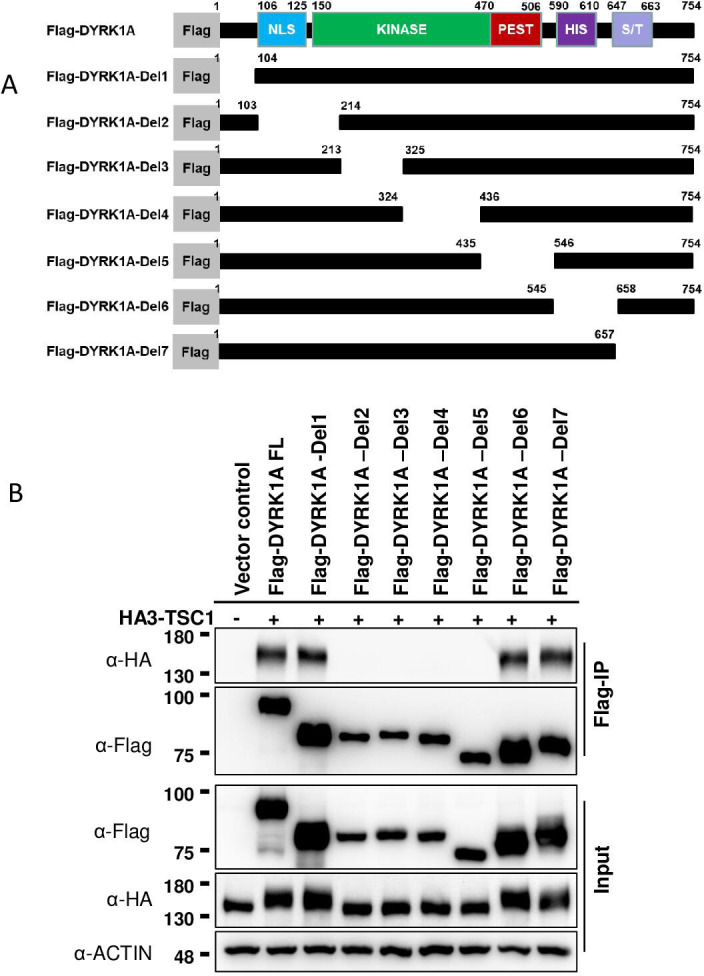
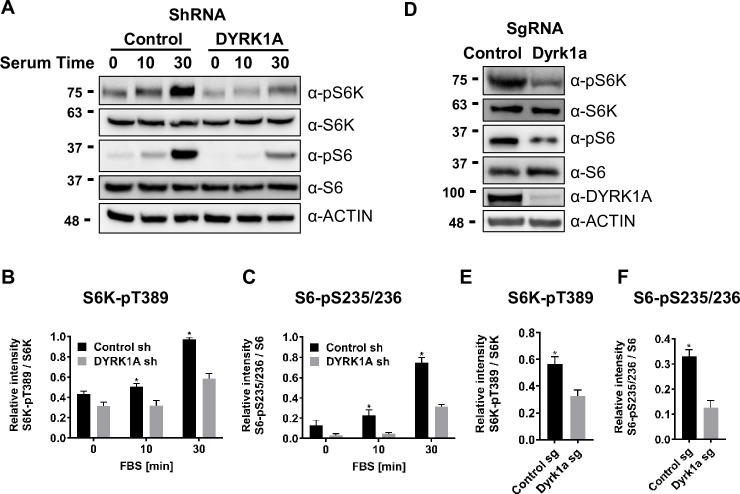
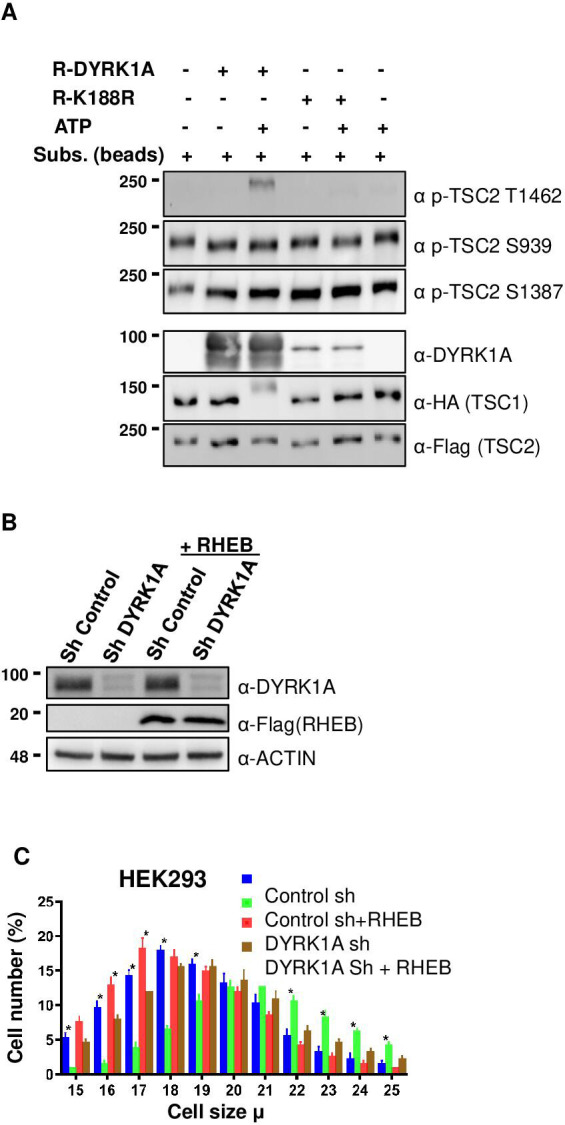
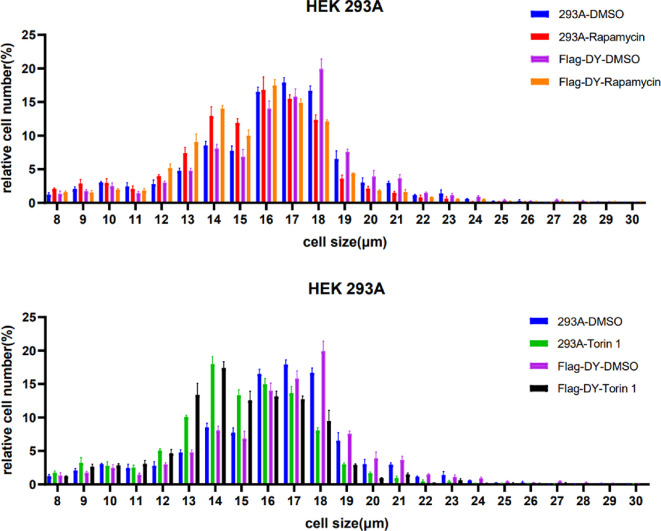
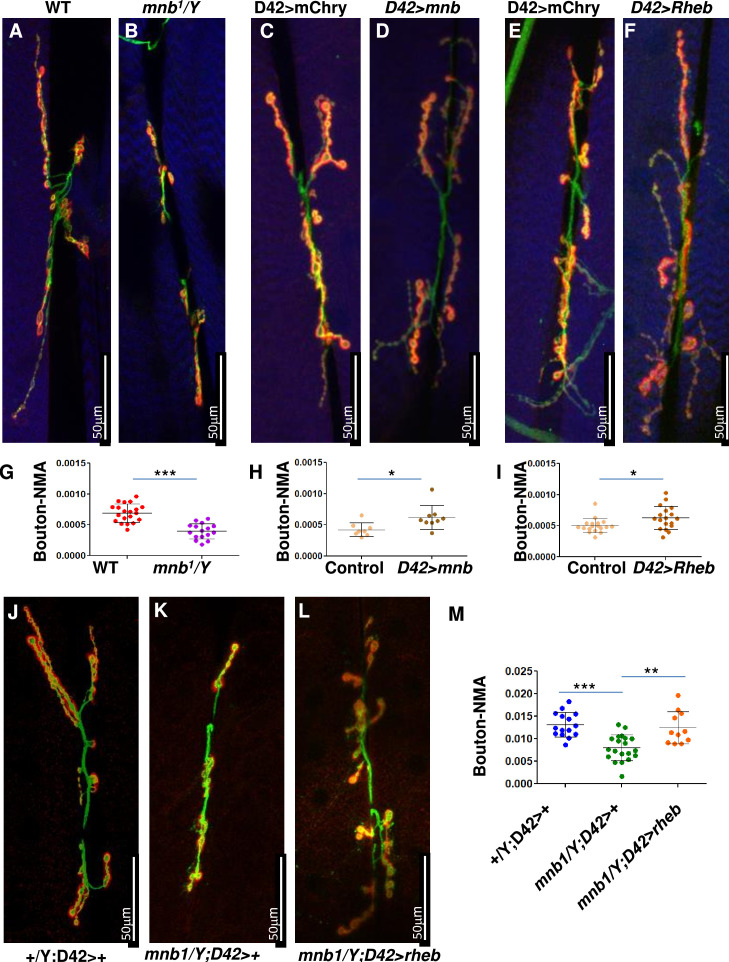
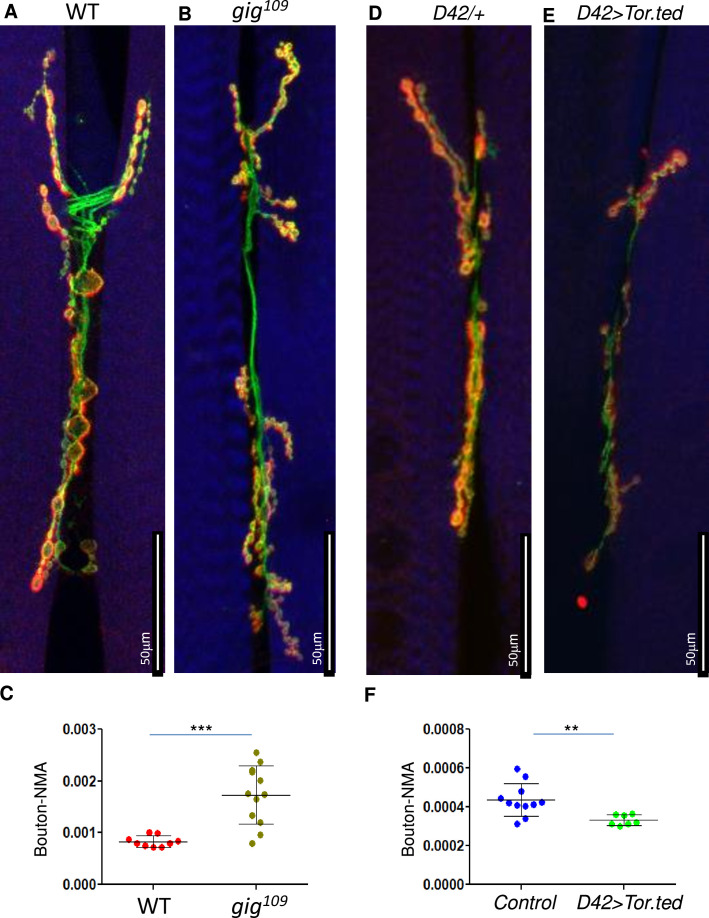
DYRK1A, a ubiquitously expressed kinase, is linked to the dominant intellectual developmental disorder, microcephaly, and Down syndrome in humans. It regulates numerous cellular processes such as cell cycle, vesicle trafficking, and microtubule assembly. DYRK1A is a critical regulator of organ growth; however, how it regulates organ growth is not fully understood. Here, we show that the knockdown of DYRK1A in mammalian cells results in reduced cell size, which depends on mTORC1. Using proteomic approaches, we found that DYRK1A interacts with the tuberous sclerosis complex (TSC) proteins, namely TSC1 and TSC2, which negatively regulate mTORC1 activation. Furthermore, we show that DYRK1A phosphorylates TSC2 at T1462, a modification known to inhibit TSC activity and promote mTORC1 activity. We also found that the reduced cell growth upon knockdown of DYRK1A can be rescued by overexpression of RHEB, an activator of mTORC1. Our findings suggest that DYRK1A inhibits TSC complex activity through inhibitory phosphorylation on TSC2, thereby promoting mTORC1 activity. Furthermore, using the Drosophila neuromuscular junction as a model, we show that the mnb, the fly homologs of DYRK1A, is rescued by RHEB overexpression, suggesting a conserved role of DYRK1A in TORC1 regulation.

Keywords: D. melanogaster; DYRK1A; Drosophila melanogaster; biochemistry; cell biology; cell growth; chemical biology; microcephaly.


Conflict of interest statement

PW, SS, MZ, TX, FK, ZZ, DB, NJ, SD, RH, PW, PC, YZ, MW, LF, SN, MJ, MM No competing interests declared

Figures

Figure 1.
Figure 1.. Dual-specificity tyrosine phosphorylation-regulated kinase 1A (DYRK1A) regulates cell size.
shRNA-mediated knockdown of DYRK1A was performed in (A, B) HEK293 and (C, D) SH-SY5Y cells using lentivirus. Transduced cells were selected for four days before analysis. Western blot shows the efficiency of DYRK1A knockdown. (E, F) NIH3T3 cells were treated with Dyrk1a-targeting sgRNA expressing lentivirus and selected for four days before analysis. Western blot shows the efficiency of DYRK1A knockdown. (G, H) HEK293 cells expressing Flag-DYRK1A and the parental cells were treated with 40ng/ml Doxycycline for 48hr and analyzed for cell size. (G) Overexpression was analyzed by qRT-PCR. GAPDH mRNA was used to normalize RNA in q-RT-PCR samples. Data represent the mean ± SD (n=3 biological replicates).
Figure 1—figure supplement 1.
Figure 1—figure supplement 1.. Analysis of cell size after induction of dual-specificity tyrosine phosphorylation-regulated kinase 1A (DYRK1A) expression with increasing dosage of Doxycycline.
Figure 2.
Figure 2.. Dual-specificity tyrosine phosphorylation-regulated kinase 1A (DYRK1A) interacts with the tuberous sclerosis complex (TSC).
(A) The tandem mass spectrometry (MS/MS) datasets previously acquired by MudPIT analyses of FLAG-DYRK1A affinity purifications and negative FLAG controls (Li et al., 2018) were searched against the most recent releases of the human protein sequence databases (built by collating and removing redundant entries from NCBI Homo sapiens RefSeq GCF_000001405.40_GRCh38.p14 and GCF_009914755.1_T2T-CHM13v2.0). Highly enriched proteins include known and novel DYRK1A-interacting partners and are reported with their peptide counts and distributed normalized spectral abundance factor (dNSAF) values, which reflect their relative abundance in the samples (Zhang et al., 2010). (B) Flag beads were used to pull down Flag-DYRK1A from whole cell extracts of HEK293 transfected with Flag-DYRK1A, and Protein A beads were used as a control. The blots were probed with TSC1 and TSC2 antibodies. Actin was used to normalize the lysate inputs. (C) Endogenous DYRK1A was immunoprecipitated with DYRK1A antibody from HEK293 cytoplasmic fraction generated using the Dignam protocol (Li et al., 2018) and probed with antibodies against endogenous DYRK1A, TSC1, and TSC2. Rabbit IgG was used as the IP control (D) Flag-DYRK1A and Flag-DYRK1A kinase domain constructs were affinity purified using Flag-beads from HEK293 cells co-transfected with HA3-TSC1 and probed with α-HA and α-Flag antibodies. Actin was used as the loading control.
Figure 2—figure supplement 1.
Figure 2—figure supplement 1.. TSC1/TSC2 interact with dual-specificity tyrosine phosphorylation-regulated kinase 1A (DYRK1A).
Flag and HA beads were used to pull down HA3-TSC1 and Flag-TSC2 from whole cell extracts of HEK293 transfected with HA3-TSC1 and Flag-TSC2. Blots were probed with Flag, HA, and DYRK1A antibodies. Actin was used as the loading control.
Figure 2—figure supplement 2.
Figure 2—figure supplement 2.. Dual-specificity tyrosine phosphorylation-regulated kinase 1A (DYRK1A) kinase domain interacts with TSC1.
(A) Schematic of DYRK1A truncated constructs. All the truncated DYRK1A forms carry a Flag tag at the N-terminus. (B) Flag-DYRK1A and Flag-DYRK1A truncated constructs were affinity purified using Flag-beads from HEK293 cells co-transfected with HA3-TSC1 and probed with α-HA and α-Flag antibodies. All DYRK1A constructs, except with deletions in the kinase domain, immunoprecipitated HA3-TSC1. Note that Flag-DYRK1A kinase domain deletion constructs were expressed at lower levels than other constructs. Actin was used as lysate control.
Figure 3.
Figure 3.. Dual-specificity tyrosine phosphorylation-regulated kinase 1A (DYRK1A) promotes the activation of mTORC1 pathway in human and mouse cells.
(A) HEK293 cells treated with DYRK1A short hairpin RNA (shRNA) or control shRNA were serum starved for 12 hr before being activated with serum for the indicated times. Cells were then harvested, lysates, and probed with the indicated antibodies. Actin was used as the loading control. (B, C) Quantification of proteins in (A), levels of pS6K (T389), S6K, pS6 (pS235/236), and S6 were quantified using Image J software and the ratio of pS6K/S6K and pS6/S6 were plotted (n=3 biological replicates). (D) NIH3T3 cells were treated with sgRNA-targeting Dyrk1a or non-targeting control and selected for four days with Puromycin before harvesting. Lysates were probed with indicated antibodies. (E, F) Quantification of proteins in (D), levels of pS6K (T389), S6K, pS6 (pS235/236), and S6 were quantified (as described for B and C) and ratios were plotted (n=3 biological replicates). Student’s t-tests were done to compare samples. p-value = *p<0.05.
Figure 4.
Figure 4.. Dual-specificity tyrosine phosphorylation-regulated kinase 1A (DYRK1A) phosphorylates TSC2 at T1462 in vitro, and Ras Homolog Enriched in Brain (RHEB) overexpression rescues mTORC1 activity in cells.
(A) An in-vitro kinase assay was performed using DYRK1A and kinase-dead DYRK1A (K188R) that were purified from bacteria. Flag-TSC2 and HA3-TSC1 were co-expressed in HEK293 cells and purified using a combination of (1:1) of HA and Flag beads. Beads were equilibrated with kinase assay buffer before the reactions were initiated on beads. After incubation for 30 min at 30°C, reactions were stopped by the addition of SDS loading buffer. Since bacterially purified DYRK1A is autophosphorylated, it exhibits a fuzzier signal, whereas kinase-dead DYRK1A is incapable of phosphorylation and appears as a sharp signal. (B, C) RHEB overexpression partially rescues the size of HEK293 cells. HEK293 cells were first transduced with short hairpin RNA (shRNA) lentivirus targeting DYRK1A or control and selected with 1 ug/ml Puromycin for three days, after which they were re-transduced with lentivirus expressing Flag-RHEB. The concentration of Puromycin was raised to 2 ug/ml for the next 48 hr in order to select for the second round of transduction. (B) Panel shows knockdown efficiency of DYRK1A and overexpression of RHEB. (C) Lower panel shows cell size analysis. Data represent the mean ± SD (n=3 biological replicates). Student’s t-test was done to compare samples. Significant difference in p-value = *p<0.05.
Figure 4—figure supplement 1.
Figure 4—figure supplement 1.. mTORC1 inhibitors block the increase in cell size mediated by dual-specificity tyrosine phosphorylation-regulated kinase 1A (DYRK1A).
HEK293 cells expressing Flag-DYRK1A and the parental cells were treated with 40ng/ml Doxycycline. At 24hr mTOR inhibitors Torin1/Rapamycin were added and the cells were further incubated for 24hr. Data represent the mean ± SD (n=3 biological replicates).
Figure 5.
Figure 5.. mnb mutant phenotype can be rescued by TOR activation in flies.
(A–F and J–L) Third instar larval neuromuscular junction (NMJ) (muscles 6/7) were stained using anti-HRP (Green) and anti-Dlg (Red). Muscles are stained with phalloidin (Blue, A–F). HRP (green) stains the entire neuron and Dlg (red) stains only boutons (Red + Green). (G–I, M) Quantification of bouton numbers, normalized to muscle area (Bouton-NMA). Error bars represent standard deviation. Statistical significance (p-values: ***<0.001; **<0.01; *<0.05) is calculated by unpaired student’s t-test. (A, B, G) mnb1 alleles show fewer boutons numbers as compared to wild-type (WT, Canton S) control (B). Data are quantified in G. (C, D, H) mnb overexpression (D42-Gal4>UAS mnb, D) increases bouton numbers as compared with mCherry overexpression (D42-Gal4>UAS-mCherry, Control, C). D42-Gal4 is a motor-neuron-specific driver. Data are quantified in H. (E, F, I) Rheb overexpression (D42-Gal4>UAS Rheb, F) increases bouton numbers as compared with mCherry overexpression (D42-Gal4>UAS-mCherry, Control, E). Data are quantified in I. (J–M) Rheb overexpression in mnb mutant (mnb1/Y D42-Gal4>UASRheb, L) suppressed bouton phenotype as compared to mnb mutant (mnb1/Y D42-Gal4/+, K). Wild-type is heterozygous D42-Gal4 (+/Y; D42-Gal4/+, J). Data is quantified in (M).
Figure 5—figure supplement 1.
Figure 5—figure supplement 1.. Neuromuscular junction (NMJ) phenotypes due to TOR gain or loss.
NMJ (muscles 6/7) are stained using anti-HRP (Green) and anti-Dlg (Red). Muscles are stained with phalloidin (Blue, A–F). HRP (green) stains the entire neuron and Dlg (red) stains only boutons (Red + Green). (G–I, M) Quantification of bouton numbers - normalized to muscle area (Bouton-NMA). Error bars represent standard deviation. Statistical significance (p-values: ***<0.001; **<0.01; *<0.05) is calculated by unpaired student’s t-test. (A–C) gig109 alleles show increased bouton numbers (B) as compared to wild-type (WT, Canton S) control (B). Data is quantified in C. (D–F) Expression of dominant negative TOR (D42-Gal4>UAS TOR.ted, E) decreases bouton numbers as compared to control (D42-Gal4/+, D). D42-Gal4 is a motor neuron-specific driver. Data is quantified in F.

Update of

  • doi: 10.1101/2023.01.18.524493
  • doi: 10.7554/eLife.88318.1
  • doi: 10.7554/eLife.88318.2

References

    1. Antonarakis SE. Down syndrome and the complexity of genome dosage imbalance. Nature Reviews. Genetics. 2017;18:147–163. doi: 10.1038/nrg.2016.154. - DOI - PubMed
    1. Arbones ML, Thomazeau A, Nakano-Kobayashi A, Hagiwara M, Delabar JM. DYRK1A and cognition: A lifelong relationship. Pharmacology & Therapeutics. 2019;194:199–221. doi: 10.1016/j.pharmthera.2018.09.010. - DOI - PubMed
    1. Astrinidis A, Cash TP, Hunter DS, Walker CL, Chernoff J, Henske EP. Tuberin, the tuberous sclerosis complex 2 tumor suppressor gene product, regulates Rho activation, cell adhesion and migration. Oncogene. 2002;21:8470–8476. doi: 10.1038/sj.onc.1205962. - DOI - PubMed
    1. Barrada A, Djendli M, Desnos T, Mercier R, Robaglia C, Montané MH, Menand B. A TOR-YAK1 signaling axis controls cell cycle, meristem activity and plant growth in Arabidopsis. Development. 2019;146:dev171298. doi: 10.1242/dev.171298. - DOI - PubMed
    1. Ben-Sahra I, Manning BD. mTORC1 signaling and the metabolic control of cell growth. Current Opinion in Cell Biology. 2017;45:72–82. doi: 10.1016/j.ceb.2017.02.012. - DOI - PMC - PubMed

MeSH terms

LinkOut - more resources