Clinical Trial
. 2024 Oct 22;134(24):e183984.
doi: 10.1172/JCI183984.

Attenuated kidney oxidative metabolism in young adults with type 1 diabetes

Affiliations
Clinical Trial

Attenuated kidney oxidative metabolism in young adults with type 1 diabetes

Ye Ji Choi et al. J Clin Invest. .

Abstract

BACKGROUNDIn type 1 diabetes (T1D), impaired insulin sensitivity may contribute to the development of diabetic kidney disease (DKD) through alterations in kidney oxidative metabolism.METHODSYoung adults with T1D (n = 30) and healthy controls (HCs) (n = 20) underwent hyperinsulinemic-euglycemic clamp studies, MRI, 11C-acetate PET, kidney biopsies, single-cell RNA-Seq, and spatial metabolomics to assess this relationship.RESULTSParticipants with T1D had significantly higher glomerular basement membrane (GBM) thickness compared with HCs. T1D participants exhibited lower insulin sensitivity and cortical oxidative metabolism, correlating with higher insulin sensitivity. Proximal tubular transcripts of TCA cycle and oxidative phosphorylation enzymes were lower in T1D. Spatial metabolomics showed reductions in tubular TCA cycle intermediates, indicating mitochondrial dysfunction. The Slingshot algorithm identified a lineage of proximal tubular cells progressing from stable to adaptive/maladaptive subtypes, using pseudotime trajectory analysis, which computationally orders cells along a continuum of states. This analysis revealed distinct distribution patterns between T1D and HCs, with attenuated oxidative metabolism in T1D attributed to a greater proportion of adaptive/maladaptive subtypes with low expression of TCA cycle and oxidative phosphorylation transcripts. Pseudotime progression associated with higher HbA1c, BMI, and GBM, and lower insulin sensitivity and cortical oxidative metabolism.CONCLUSIONThese early structural and metabolic changes in T1D kidneys may precede clinical DKD.TRIAL REGISTRATIONClinicalTrials.gov NCT04074668.FUNDINGUniversity of Michigan O'Brien Kidney Translational Core Center grant (P30 DK081943); CROCODILE studies by National Institute of Diabetes and Digestive and Kidney Diseases (NIDDK) (P30 DK116073), Juvenile Diabetes Research Foundation (JDRF) (2-SRA-2019-845-S-B), Boettcher Foundation, Intramural Research Program at NIDDK and Centers for Disease Control and Prevention (CKD Initiative) under Inter-Agency Agreement #21FED2100157DPG.

Keywords: Diabetes; Endocrinology; Metabolism.


Figures

Figure 1
Figure 1. 11C acetate PET scanning to assess kidney oxidative metabolism.
Visual illustration of K1 and k2 in the context of TCA cycle. Refer to Table 2 for results. t Tests were performed to compare means of K1 and k2 between HC and T1D. HC and T1D had similar 11C-acetate uptake (K1), but T1D had a lower rate of tracer clearance, estimated by the rate of CO2 production (k2).
Figure 2
Figure 2. Heatmap of correlations between GBM thickness and M-value with PET parameters.
The color gradient in the figure represents the direction of correlation, with negative correlations depicted in red and positive correlations in blue. Spearman’s correlation analysis was performed and the correlation coefficient is presented as numerical text in the boxes. Significant correlation coefficients (P < 0.05) are denoted by asterisks. GC, glucose corrected; F, perfusion; k2, tracer clearance rate.
Figure 3
Figure 3. PT transcripts catalyzing the steps of TCA cycle and oxidative phosphorylation and intrarenal TCA metabolites.
Visual illustration of PT transcripts and kidney tissue metabolites involved in the TCA cycle and oxidative phosphorylation. Refer to Table 4 and Table 5 for results from analyses. Transcripts and metabolites are shaded in blue (or purple for cytosolic transcripts) when T1D has lower expression/relative abundance relative to HC. Succinyl CoA was not measured in the kidney tissue metabolomics and is shown in a dotted bordered box.
Figure 4
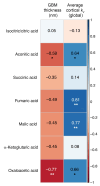
Figure 4. Heatmap of correlations between GBM thickness and cortical k2 with kidney tissue metabolites.
The color gradient in the figure represents the direction of correlation, with negative correlations depicted in red and positive correlations in blue. Spearman’s correlation analysis was performed and the correlation coefficient is presented in black text. Significant correlation coefficients (P < 0.05) are denoted by asterisks.
Figure 5
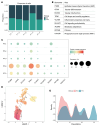
Figure 5. Proportion and expression of proximal tubular cell subtypes with adaptive/maladaptive markers and trajectory analysis.
(A) Proportion of cells from HC and T1D in each PT cell subtype is shown. The highest proportion of T1D cells was in the PT-4 subtype, and the lowest proportion of T1D cells was in the PT-3 subtype. (B) Definition of each adaptive/maladaptive biomarkers as shown in C. (C) Average expression of adaptive/maladaptive markers (ITGB8, CDH6, DCDC2, TPM1, VCAM1, DLGAP1, ACSM3, KIF26B, and HAVCR1) were higher in PT-4 and PT-5 subtypes compared with PT1-3 subtypes. Higher expression is presented by bigger circles and color closer to red. (D) UMAP of PT cells with 2 lineages identified by Slingshot. The first lineage inferred trajectory progressed from PT-3, -2, -5, and -4 (longer lineage), and the other from PT-3, -2, and -1. The first lineage was the main focus for this study. (E) Density plot of cell expression across pseudotime revealing differential progression between T1D and HC. PT, proximal tubular.
Figure 6
Figure 6. Clinical measures along pseudotime.
(AE) HbA1c, BMI, M-value, log (GBM thickness), and average cortical k2 are plotted along the trajectory of pseudotime. (F) Spearman’s correlations were calculated for each clinical measure with pseudotime, revealing positive correlations with HbA1c, BMI, and GBM thickness and negative correlations with M-value and cortical k2. HbA1c, glycated hemoglobin; k2, cortical oxidative metabolism.
Figure 7
Figure 7. Proportion of PT cell subtypes in categories of clinical measures.
Proportion of PT-4 cells is higher for higher categories of HbA1c (A), BMI (kg/m2, B), and GBM thickness (D), and lower for higher categories of M-value (C) and average cortical k2 (E). HbA1c cutoffs were based on the American Diabetes Association guidelines. Tertiles were used for M-values (t1: [3.1, 7.7%]; t2: (7.7, 11.3%]; t3: (11.3, 25.5%]), GBM thickness (t1: [300.0, 488.5 nm]; (488.5, 582.2nm]; (582.2, 1026 nm]), and average cortical k2 (t1: [0.119, 0.153]; t2: (0.153, 0.187]; t3: (0.187, 0.219] min–1). k2, cortical oxidative metabolism.
Figure 8
Figure 8. Study design and consort diagram.
Figure 9
Figure 9. Illustration of the pseudotime analysis concept using Slingshot.
Illustration of the pseudotime analysis concept. Cells were collected from independent participants with varying health progression (e.g., diabetes duration and progression). Pseudotime was inferred using the minimal spanning tree method in Slingshot from UMAP. Healthy PTs are indicated in orange, transitioning to adaptive/maladaptive PTs shown in brown.

References

    1. Rapaport R, Sills IN. Implications of the DCCT for children and adolescents with IDDM. N J Med. 1994;91(4):227–228. - PubMed
    1. Purnell JQ, et al. Effect of excessive weight gain with intensive therapy of type 1 diabetes on lipid levels and blood pressure: results from the DCCT. Diabetes Control and Complications Trial. JAMA. 1998;280(2):140–146. doi: 10.1001/jama.280.2.140. - DOI - PMC - PubMed
    1. Purnell JQ, et al. Impact of excessive weight gain on cardiovascular outcomes in type 1 diabetes: results from the diabetes control and complications trial/epidemiology of diabetes interventions and complications (DCCT/EDIC) Study. Diabetes Care. 2017;40(12):1756–1762. doi: 10.2337/dc16-2523. - DOI - PMC - PubMed
    1. de Boer IH, et al. Central obesity, incident microalbuminuria, and change in creatinine clearance in the epidemiology of diabetes interventions and complications study. J Am Soc Nephrol. 2007;18(1):235–243. doi: 10.1681/ASN.2006040394. - DOI - PMC - PubMed
    1. Gubitosi-Klug R, et al. Associations of microvascular complications with the risk of cardiovascular disease in type 1 diabetes. Diabetes Care. 2021;44(7):1499–1505. doi: 10.2337/dc20-3104. - DOI - PMC - PubMed

Publication types

Associated data