. 2024 Nov 22;9(22):e181219.
doi: 10.1172/jci.insight.181219.

Increased expression of cathepsin C in airway epithelia exacerbates airway remodeling in asthma

Affiliations

Increased expression of cathepsin C in airway epithelia exacerbates airway remodeling in asthma

Lin Yuan et al. JCI Insight. .

Abstract

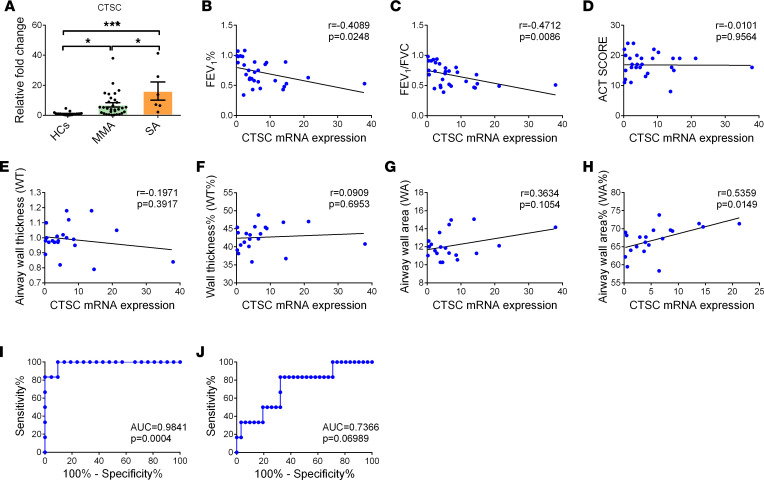
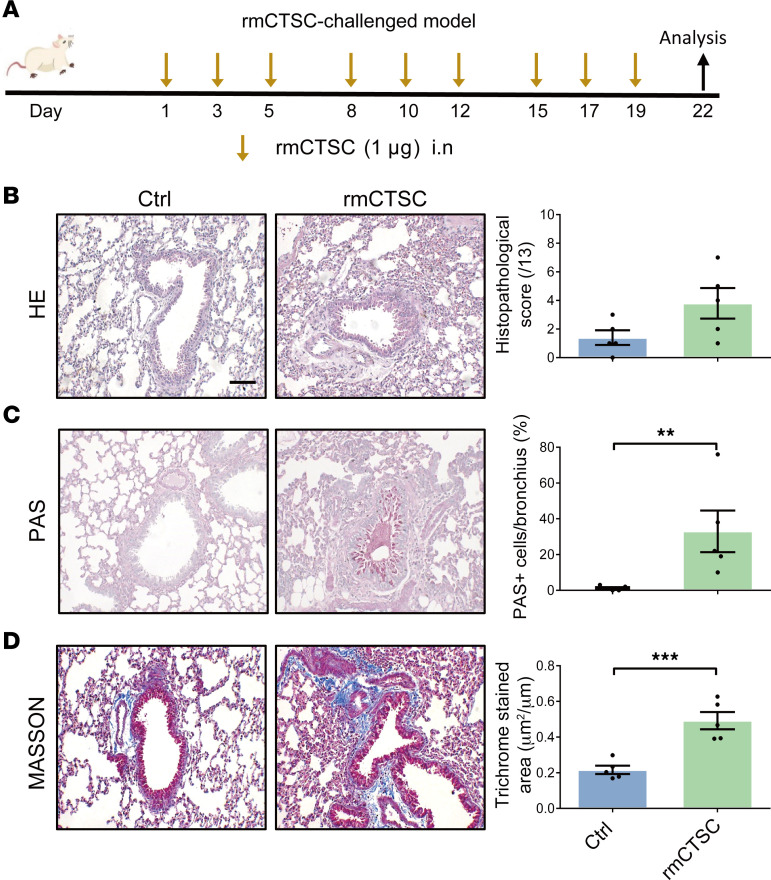
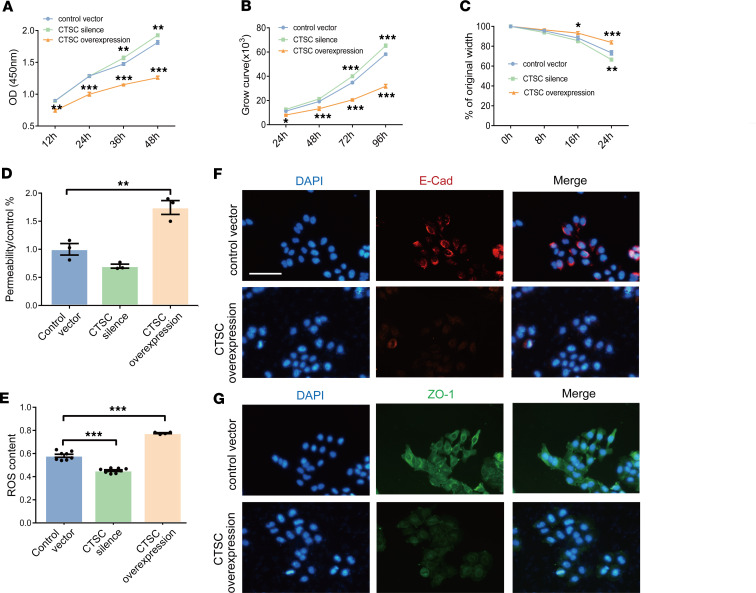
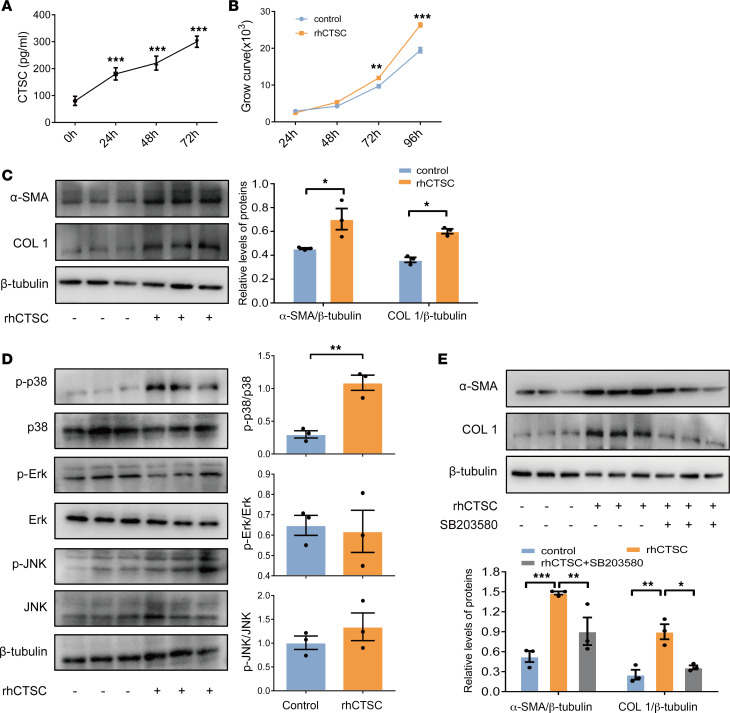
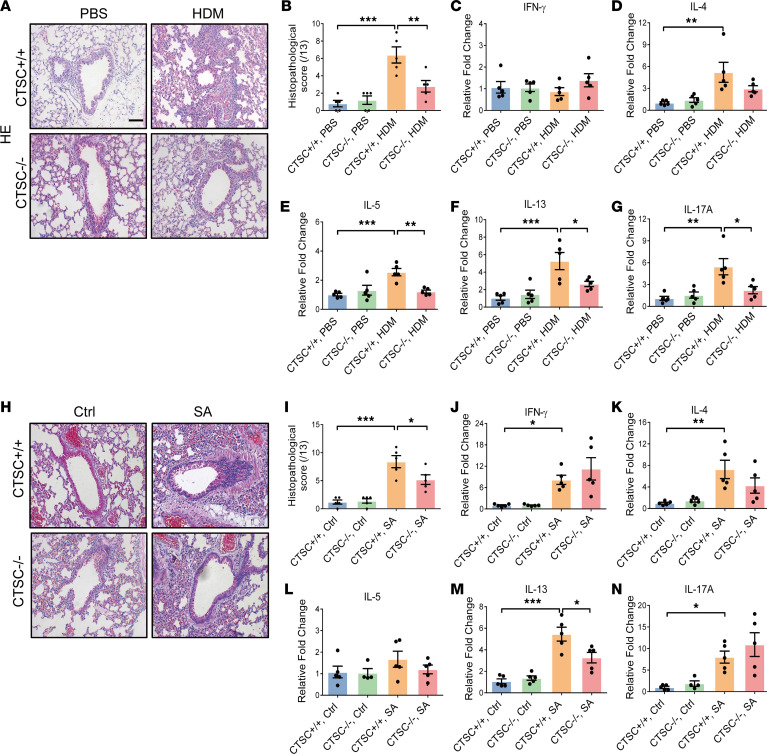
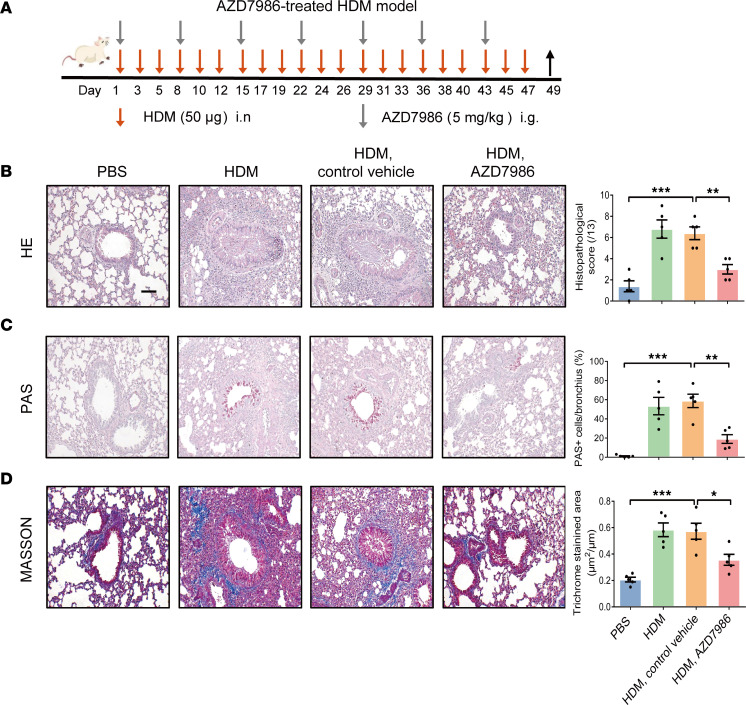
Airway remodeling is a critical factor determining the pathogenesis and treatment sensitivity of severe asthma (SA) or uncontrolled asthma (UA). The activation of epithelial-mesenchymal trophic units (EMTUs) regulated by airway epithelial cells (AECs) has been proven to induce airway remodeling directly. However, the triggers for EMTU activation and the underlying mechanism of airway remodeling are not fully elucidated. Here, we screened the differentially expressed gene cathepsin C (CTSC; also known as dipeptidyl peptidase 1 [DPP-1]) in epithelia of patients with SA and UA using RNA-sequencing data and further verified the increased expression of CTSC in induced sputum of patients with asthma, which was positively correlated with severity and airway remodeling. Moreover, direct instillation of exogenous CTSC induced airway remodeling. Genetic inhibition of CTSC suppressed EMTU activation and airway remodeling in two asthma models with airway remodeling. Mechanistically, increased secretion of CTSC from AECs induced EMTU activation through the p38-mediated pathway, further inducing airway remodeling. Meanwhile, inhibition of CTSC also reduced the infiltration of inflammatory cells and the production of inflammatory factors in the lungs of asthmatic mice. Consequently, targeting CTSC with compound AZD7986 protected against airway inflammation, EMTU activation, and remodeling in the asthma model. Based on the dual effects of CTSC on airway inflammation and remodeling, CTSC is a potential biomarker and therapeutic target for SA or UA.

Keywords: Asthma; Pulmonology; Respiration; Therapeutics.


Figures

Figure 1
Figure 1. The expression of CTSC is related to asthma severity in patients.
(A) The mRNA expression of CTSC in the induced sputum of patients with asthma and HCs. Data are presented as mean ± SEM. One-way ANOVA followed by Tukey’s post hoc test was used. (B and C) Pearson’s correlation analysis between CTSC expression and pulmonary function in patients with asthma. FEV1, forced expiratory volume in 1 second; FVC, forced vital capacity. (D) Pearson’s correlation analysis between CTSC expression and ACT score in patients with asthma. (EH) Pearson’s correlation analysis between CTSC expression and related parameters of airway remodeling in patients with asthma. (I) Receiver operating characteristic analysis for the expression of CTSC to discriminate HCs from patients with SA. (J) Receiver operating characteristic analysis for the expression of CTSC to discriminate patients with MMA from patients with SA. *P < 0.05; ***P < 0.001.
Figure 2
Figure 2. Exogenous CTSC promotes airway remodeling.
(A) Schematic of the rmCTSC-challenged mouse model. (B) Representative lung sections and semiquantitative analysis of airway inflammation (n = 5; scale bar: 50 μm). Unpaired t test was used. (C) Representative lung sections and semiquantitative analysis of mucus production (n = 5; scale bar: 50 μm). Mann-Whitney U test was used. (D) Representative lung sections and semiquantitative analysis of peribronchial fibrosis (n = 5; scale bar: 50 μm). Unpaired t test was used. All data are presented as mean ± SEM. **P < 0.01; ***P < 0.001.
Figure 3
Figure 3. Airway remodeling is markedly alleviated in the absence of CTSC.
(A and D) Schematic of the (A) HDM model and (D) SA model. (B and E) Representative lung sections and semiquantitative analysis of mucus production (n = 5; scale bar: 50 μm). (C and F) Representative lung sections and semiquantitative analysis of peribronchial fibrosis (n = 5; scale bar: 50 μm). All data are presented as mean ± SEM. *P < 0.05; **P < 0.01; ***P < 0.001 by 1-way ANOVA followed by Tukey’s post hoc test.
Figure 4
Figure 4. The activation of EMTU is markedly decreased in the absence of CTSC.
(AD) Representative immunohistochemistry images of lung tissue and semiquantitative analysis for (A) Ki67, (B) E-cad, (C) vimentin, and (D) α-SMA expression in a HDM-induced model (n = 5; scale bar: 50 μm). (EH) Representative immunohistochemistry images of lung tissue and semiquantitative analysis for (E) Ki67, (F) E-cad, (G) vimentin, and (H) α-SMA expression in SA model (n = 5; scale bar: 50 μm). All data are presented as mean ± SEM. *P < 0.05; **P < 0.01; ***P < 0.001 by 1-way ANOVA followed by Tukey’s post hoc test.
Figure 5
Figure 5. The increased expression of CTSC impairs the epithelial barrier function.
(A) Cell proliferation analysis of HBECs after CSTC silencing and overexpression using CCK-8 assay (n = 5). Two-way ANOVA followed by Tukey’s post hoc test was used. (B) Proliferation curves of HBECs after CSTC silencing and overexpression (n = 4). Two-way ANOVA followed by Tukey’s post hoc test was used. (C) A scratch test for evaluating damage repair capability in HBECs (n = 3). Two-way ANOVA followed by Tukey’s post hoc test was used. (D) Effects of CTSC expression on the permeability of HBECs monolayers (n = 3). One-way ANOVA followed by Tukey’s post hoc test was used. (E) Effects of CTSC expression on ROS generation (n = 4–8). One-way ANOVA followed by Bonferroni’s post hoc test was used. (F and G) Representative immunofluorescence of HBECs stained for E-cad and ZO-1 after CSTC overexpression (n = 3; scale bar: 50 μm). All data are presented as mean ± SEM. *P < 0.05, **P < 0.01, ***P < 0.001.
Figure 6
Figure 6. rhCTSC increases the activation of EMTU through activation of p38 pathway.
(A) The secretion of CTSC in HBECs was detected by ELISA (n = 4). One-way ANOVA followed by Tukey’s post hoc test was used. (B) Proliferation curves of HLF-1 after rhCTSC stimulation (n = 4). Two-way ANOVA followed by Tukey’s post hoc test was used. (C) Expression of α-SMA and COL 1 protein was detected by Western blot (n = 3). Two-way ANOVA followed by Tukey’s post hoc test was used. (D) Expression of p38, p-p38, Erk, p-Erk, JNK, and p-JNK protein was detected by Western blot (n = 3). Unpaired t test was used. (E) HLF-1 were pretreated with p38 inhibitor SB203580 and then stimulated with rhCTSC. Expression of α-SMA and COL 1 protein was detected by Western blot (n = 3). Two-way ANOVA followed by Tukey’s post hoc test was used. All data are presented as mean ± SEM. *P < 0.05, **P < 0.01, ***P < 0.001.
Figure 7
Figure 7. Airway inflammation is markedly alleviated in the absence of CTSC.
(A) Representative lung sections and semiquantitative analysis of airway inflammation in a HDM model (n = 5; scale bar: 50 μm). (BG) The levels of IFN-γ, IL-4, IL-5, IL-13, and IL-17A transcripts in lung tissue were examined by quantitative PCR in the HDM model (n = 5). (H) Representative lung sections and semiquantitative analysis of airway inflammation in a SA model (n = 5; scale bar: 50 μm). (IN) The levels of IFN-γ, IL-4, IL-5, IL-13, and IL-17A transcripts in lung tissue were examined by quantitative PCR in the SA model (n = 4–5). All data are presented as mean ± SEM. *P < 0.05; **P < 0.01; ***P < 0.001 by 1-way ANOVA followed by Tukey’s post hoc test.
Figure 8
Figure 8. The administration of AZD7986 alleviates airway remodeling in a HDM-induced asthma model.
(A) Schematic of the HDM model mice treated with AZD7986. (B) Representative lung sections and semiquantitative analysis of airway inflammation (n = 5; scale bar: 50 μm). (C) Representative lung sections and semiquantitative analysis of mucus production (n = 5; scale bar: 50 μm). (D) Representative lung sections and semiquantitative analysis of peribronchial fibrosis (n = 5; scale bar: 50 μm). All data are presented as mean ± SEM. *P < 0.05; **P < 0.01; ***P < 0.001 by 1-way ANOVA followed by Tukey’s post hoc test.

Similar articles

Cited by

References

    1. Lambrecht BN, et al. The airway epithelium in asthma. Nat Med. 2012;18(5):684–692. doi: 10.1038/nm.2737. - DOI - PubMed
    1. Porsbjerg C, et al. Asthma. Lancet. 2023;401(10379):858–873. doi: 10.1016/S0140-6736(22)02125-0. - DOI - PubMed
    1. Ouyang L, et al. Emerging roles and therapeutic implications of HDAC2 and IL-17A in steroid-resistant asthma. Chin Med J Pulm Crit Care Med. 2023;1(2):108–112. doi: 10.1016/j.pccm.2023.04.003. - DOI - PMC - PubMed
    1. Tsurikisawa N, et al. Bronchial reactivity to histamine is correlated with airway remodeling in adults with moderate to severe asthma. J Asthma. 2010;47(8):841–848. doi: 10.3109/02770903.2010.504876. - DOI - PubMed
    1. Zhang X, et al. Uncontrolled asthma phenotypes defined from parameters using quantitative CT analysis. Eur Radiol. 2019;29(6):2848–2858. doi: 10.1007/s00330-018-5913-1. - DOI - PubMed