. 2024 Dec 16;134(24):e179135.
doi: 10.1172/JCI179135.

Distinct mechanisms drive divergent phenotypes in hypertrophic and dilated cardiomyopathy-associated TPM1 variants

Affiliations

Distinct mechanisms drive divergent phenotypes in hypertrophic and dilated cardiomyopathy-associated TPM1 variants

Saiti S Halder et al. J Clin Invest. .

Abstract

Heritable forms of hypertrophic cardiomyopathy (HCM) and dilated cardiomyopathy (DCM) represent starkly diverging clinical phenotypes, yet may be caused by mutations to the same sarcomeric protein. The precise mechanisms by which point mutations within the same gene bring about phenotypic diversity remain unclear. Our objective was to develop a mechanistic explanation of diverging phenotypes in two TPM1 mutations, E62Q (HCM) and E54K (DCM). Drawing on data from the literature and experiments with stem cell-derived cardiomyocytes expressing the TPM1 mutations of interest, we constructed computational simulations that provide plausible explanations of the distinct muscle contractility caused by each variant. In E62Q, increased calcium sensitivity and hypercontractility was explained most accurately by a reduction in effective molecular stiffness of tropomyosin and alterations in its interactions with the actin thin filament that favor the "closed" regulatory state. By contrast, the E54K mutation appeared to act via long-range allosteric interactions to increase the association rate of the C-terminal troponin I mobile domain to tropomyosin/actin. These mutation-linked molecular events produced diverging alterations in gene expression that can be observed in human engineered heart tissues. Modulators of myosin activity confirmed our proposed mechanisms by rescuing normal contractile behavior in accordance with predictions.

Keywords: Cardiology; Cardiovascular disease.


Conflict of interest statement

Conflict of interest: SGC holds equity ownership in Propria LLC, which has licensed technology used in the research reported in this publication.

Figures

Figure 1
Figure 1. Basic twitch properties of WT, E62Q, and E54K EHTs while pacing at 1 Hz.
(A and B) Sample force traces. (C) Peak force. (D) Time from start of stimulus to peak force. (E) Time from peak to 50% relaxation. (F) Force-time integral. (G) Length-dependent activation of EHTs showing peak forces at 0%, 5%, and 10% stretch. No statistical test was performed. (H) Length-dependent activation of EHTs showing normalized peak forces (data from each EHT normalized to its own peak force at culture length, i.e., 0% stretch). E62Q and E54K curves are significantly different from WT by 2-way ANOVA with multiple comparisons at 5% stretch (P = 0.0156 and P = 0.0076, respectively) and at 10% stretch (P = 0.051 and P = 0.0007, respectively).*P < 0.05, *P < 0.0001.
Figure 2
Figure 2. Diastolic stiffness.
(A) Sample force trace during stretch. (B) Passive stress in WT, E62Q, and E54K EHTs (n = 8). E62Q passive stress is significantly different from E54K and WT using 2-way ANOVA. (C) Passive stress in WT, E62Q, and E54K EHTs at 9% stretch before and after 30 minutes of 2 μM mavacamten treatment (n = 8; passive stress values are significantly different using 2-way ANOVA with multiple comparisons, P = 0.0001; significant interaction between genotype and mavacamten treatment).
Figure 3
Figure 3. Transcriptomic and proteomic analysis of EHTs.
(A) Exploratory principal component analysis of the transcriptomic data (bulk RNA sequencing) where each point represents a unique sample. (B) Volcano plots from RNA sequencing analysis of differentially regulated genes in E62Q versus WT comparison. (C) Volcano plots from RNA sequencing analysis of differentially regulated genes in E54K versus WT comparison. The full data set is available in the GEO database under accession ID GSE251993. (D) Schematic to explain how the transcriptomic and proteomic data sets were used for different types of analysis. (E) Volcano plots from mass spectrometry data of differentially regulated proteins in E62Q versus WT comparison. (F) Volcano plots from mass spectrometry data of differentially regulated proteins in E54K versus WT comparison. (G) Common upstream transcription factors from independent upstream analysis of proteomic and transcriptomic data. (H) Top canonical pathways identified by Ingenuity Pathway Analysis using common set of genes from proteomic and transcriptomic data sets. *P < 0.05, **P < 0.01, ***P <.001, ****P <.0001.
Figure 4
Figure 4. Cell size measurements.
(AC) cTnT (green) and DAPI (blue) staining of WT (A), E62Q (B), and E54K (C) iPSC-CM cells. Scale bars: 50 μm. (D and E) Cell area (D) and aspect ratio (E) measurements. Statistical analysis: 1-way ANOVA with multiple comparisons; P values for multiple comparisons are indicated using asterisks (****P < 0.0001).
Figure 5
Figure 5. Hypothesis-driven approach.
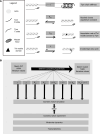
(A) Tunable parameters used in the simulations. (B) Evaluation of several competing hypotheses. TnI, troponin I; Tpm, tropomyosin; IVMA, in vitro motility assay.
Figure 6
Figure 6. Computational simulations.
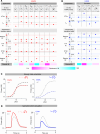
Speedometer graphics show the direction and magnitude of parameter changes (not to scale). Gray, red, and blue shaded horizontal bars represent the standard deviations of experimental data sets for WT, E62Q, and E54K EHTs, respectively. Gray, red, and blue dots represent the mean of experimental data sets and output of computational simulations for WT, E62Q, and E54K EHTs, respectively. An ideal match would show dots inside all the bars of the same color. (A) Steady-state (top) and twitch simulation (bottom) result summary for E62Q. (B) Steady-state (top) and twitch simulation (bottom) result summary for E54K. (C) Steady-state simulations for the winning hypotheses (γ + KBC for E62Q and kMD for E54K) in each case. (D) Isometric twitch simulations for the winning hypotheses (γ + KBC for E62Q and kMD for E54K) in each case. PF, Peak Force; TTP, Time to Peak; RT50, Time to Relax to 50%; and BF, Baseline Force.
Figure 7
Figure 7. Molecular evidence supporting model predictions.
Left: Chain energy versus azimuthal displacement showing decreased effective stiffness of E62Q calculated using the 2D coarse-grain model. Middle: PDB structures of E62 tropomyosin in low and high calcium. Right: Tropomyosin–troponin I (Tm-TnI) interaction energy in the B state of WT and E54K tropomyosin (averaged over n = 1,000 frames for WT and n = 3,000 frames for E54K; error bars represent standard deviation). #Results significantly different using bootstrapping to analyze difference of means. In this case 11 of 10,000 repeated samplings with replacement showed no difference between means (equivalent to P value of 0.0011).
Figure 8
Figure 8. Drug treatment of EHTs.
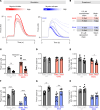
(A) Simulation of myosin modulators. (B) Experimental plan. (CE) Peak force (C), time to peak (D), and time to relax to 50% (E) for E62Q and WT EHTs with mavacamten versus sham. (FH) Peak force (F), time to peak (G), and time to relax to 50% (H) for E54K and WT EHTs with danicamtiv versus sham. Statistical analysis: 2-way ANOVA with multiple comparisons; P values for multiple comparisons are indicated using asterisks. *P < 0.05; **P < 0.01; ***P < 0.001; ****P < 0.0001.

References

    1. Bagnall RD, et al. A prospective study of sudden cardiac death among children and young adults. N Engl J Med. 2016;374(25):2441–2452. doi: 10.1056/NEJMoa1510687. - DOI - PubMed
    1. Watkins H, et al. Inherited cardiomyopathies. N Engl J Med. 2011;364(17):1643–1656. doi: 10.1056/NEJMra0902923. - DOI - PubMed
    1. Lu M, et al. Fat deposition in dilated cardiomyopathy assessed by CMR. JACC Cardiovasc Imaging. 2013;6(8):889–898. doi: 10.1016/j.jcmg.2013.04.010. - DOI - PubMed
    1. Moore JR, et al. Understanding cardiomyopathy phenotypes based on the functional impact of mutations in the myosin motor. Circ Res. 2012;111(3):375–385. doi: 10.1161/CIRCRESAHA.110.223842. - DOI - PMC - PubMed
    1. Lu QW, et al. Inherited cardiomyopathies caused by troponin mutations. J Geriatr Cardiol. 2013;10(1):91–101. doi: 10.3969/j.issn.1671-5411.2013.01.014. - DOI - PMC - PubMed

MeSH terms