. 2024 Oct 22;134(23):e173770.
doi: 10.1172/JCI173770.

FoxO1/Rictor axis induces a nongenetic adaptation to ibrutinib via Akt activation in chronic lymphocytic leukemia

Affiliations

FoxO1/Rictor axis induces a nongenetic adaptation to ibrutinib via Akt activation in chronic lymphocytic leukemia

Laura Ondrisova et al. J Clin Invest. .

Abstract

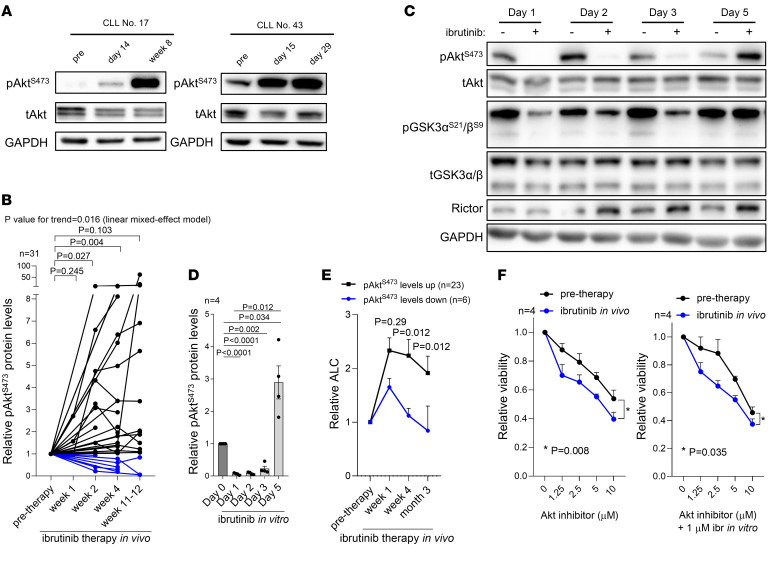
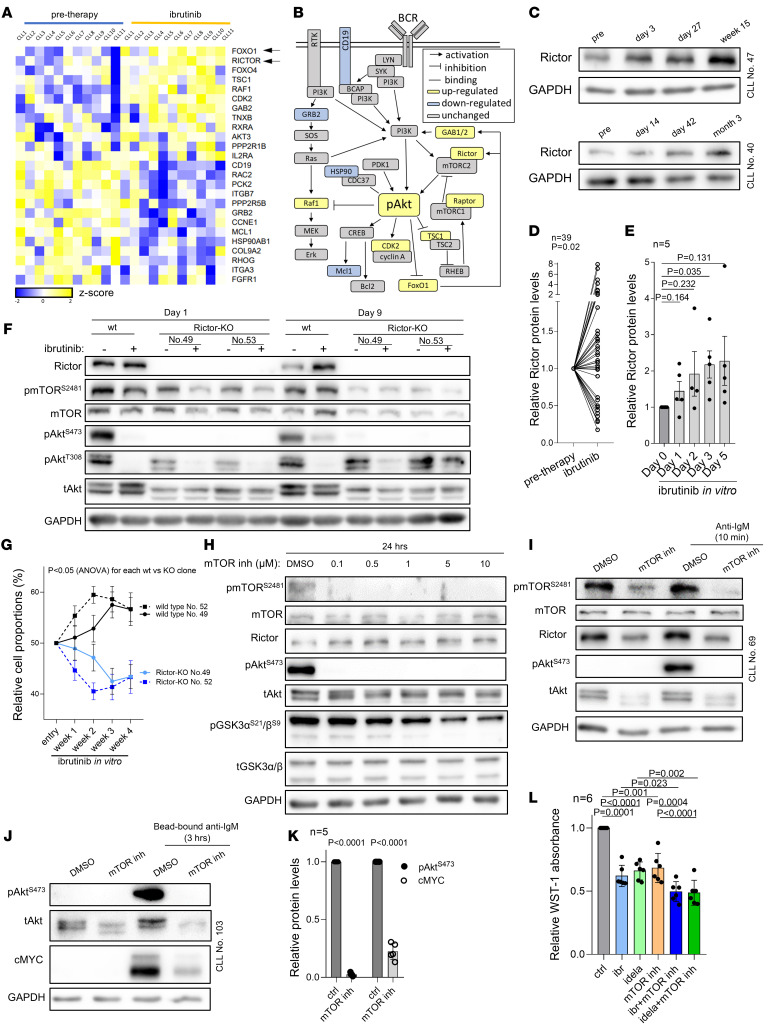
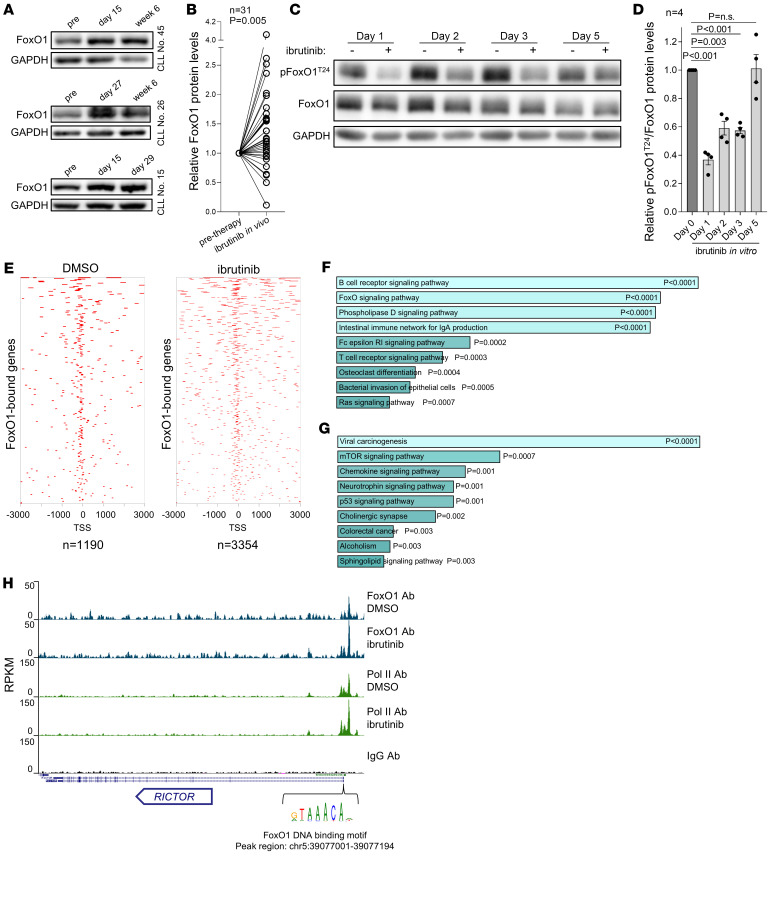
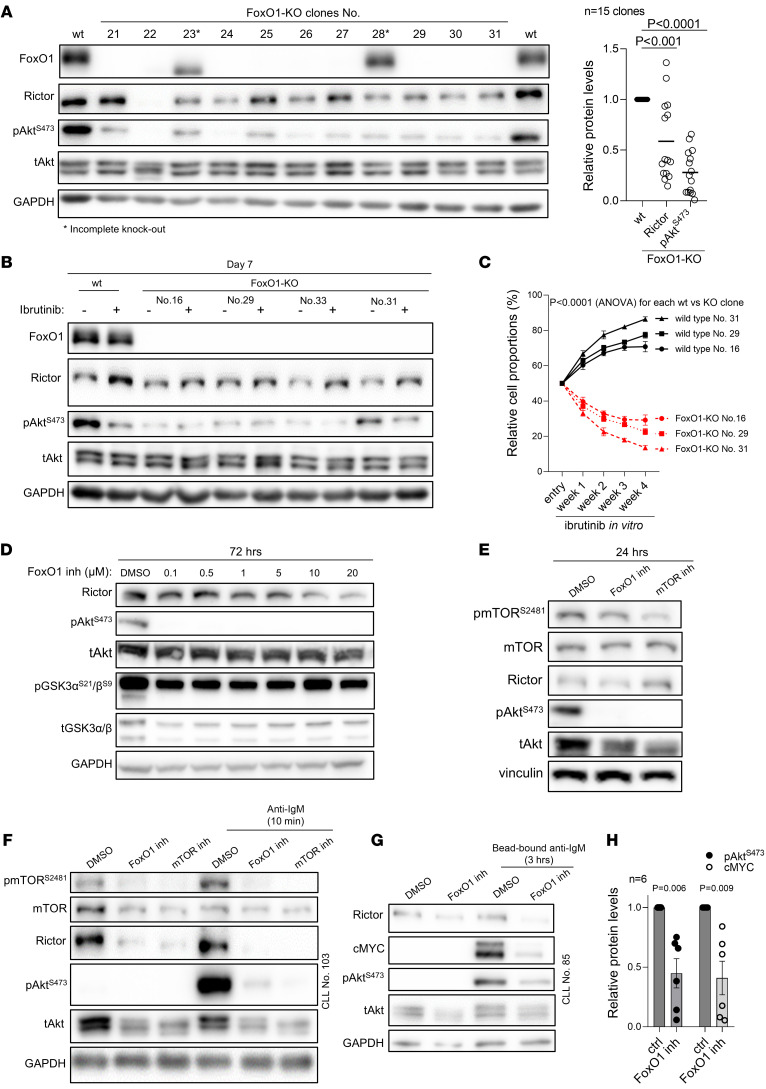
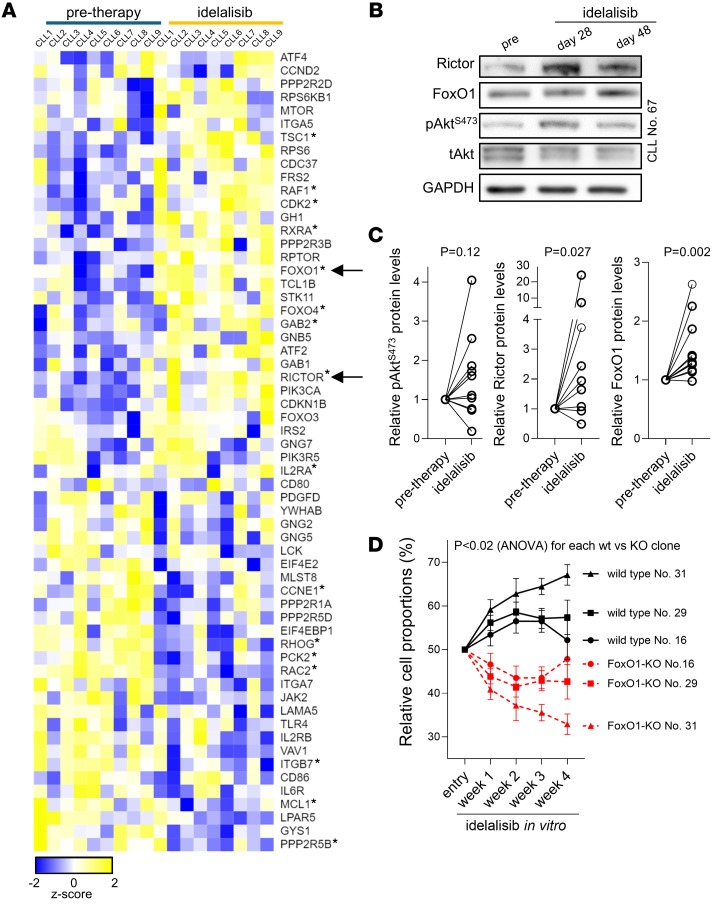
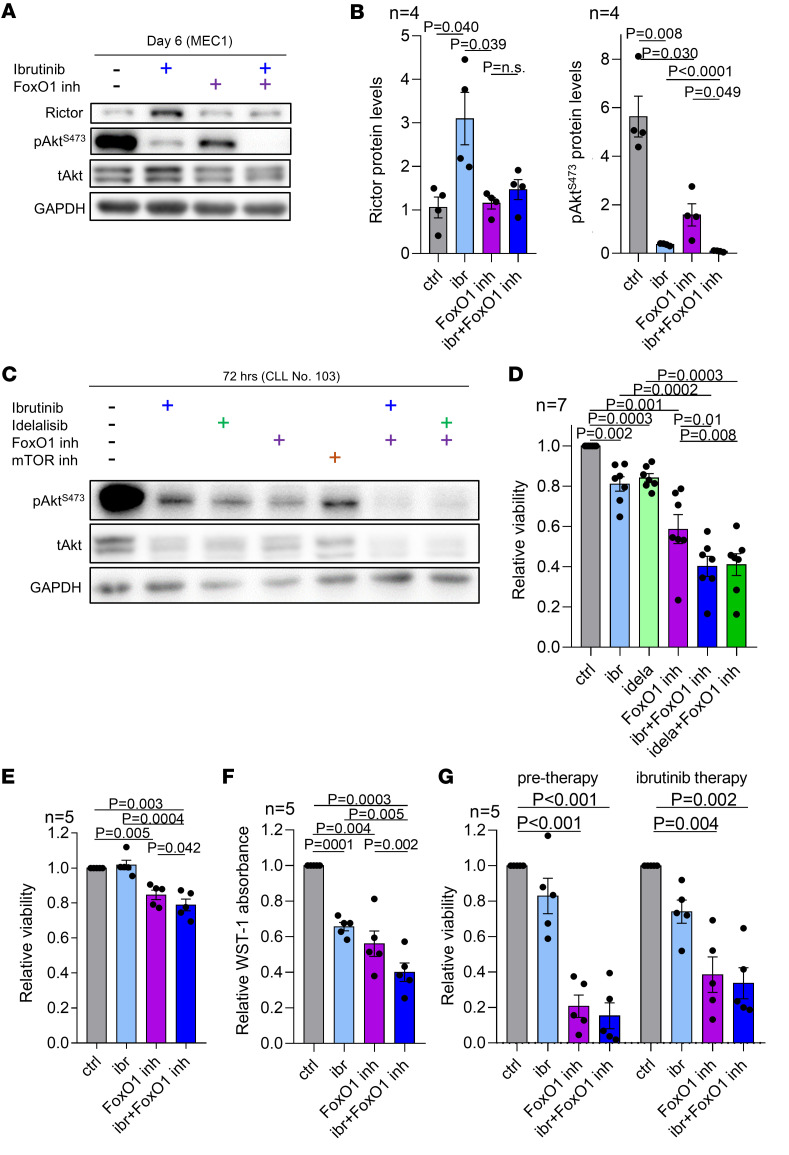
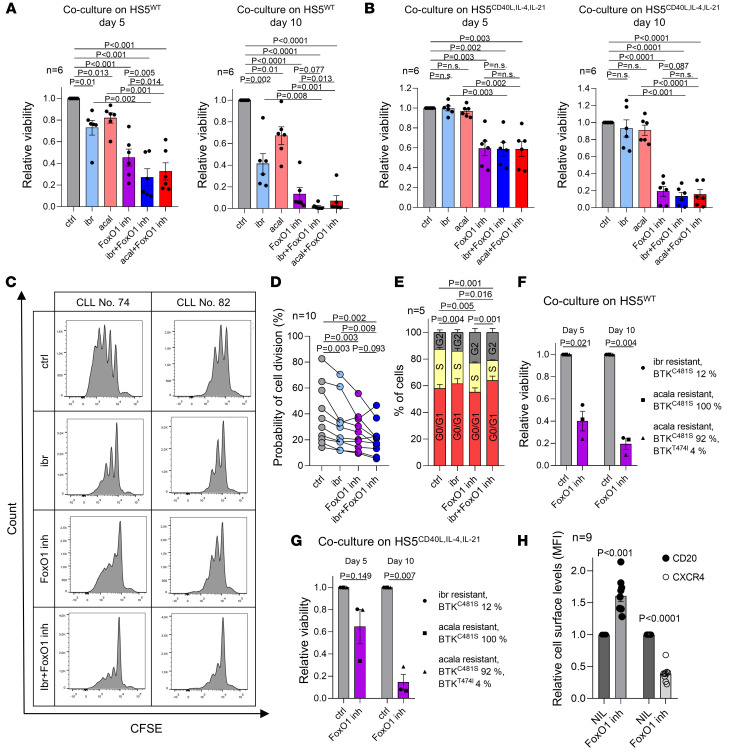
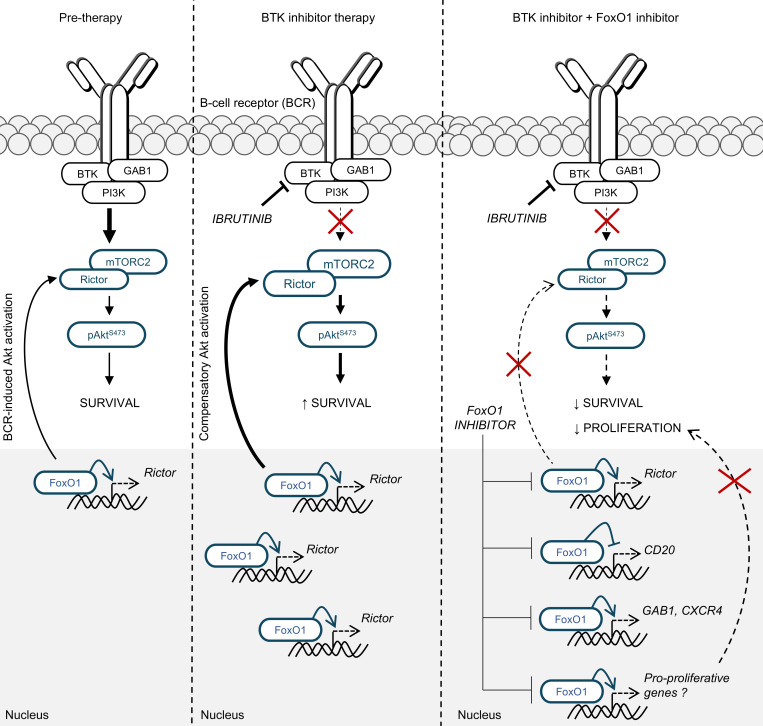
Bruton tyrosine kinase (BTK) inhibitor therapy induces peripheral blood lymphocytosis in chronic lymphocytic leukemia (CLL), which lasts for several months. It remains unclear whether nongenetic adaptation mechanisms exist, allowing CLL cells' survival during BTK inhibitor-induced lymphocytosis and/or playing a role in therapy resistance. We show that in approximately 70% of CLL cases, ibrutinib treatment in vivo increases Akt activity above pretherapy levels within several weeks, leading to compensatory CLL cell survival and a more prominent lymphocytosis on therapy. Ibrutinib-induced Akt phosphorylation (pAktS473) is caused by the upregulation of Forkhead box protein O1 (FoxO1) transcription factor, which induces expression of Rictor, an assembly protein for the mTORC2 protein complex that directly phosphorylates Akt at serine 473 (S473). Knockout or inhibition of FoxO1 or Rictor led to a dramatic decrease in Akt phosphorylation and growth disadvantage for malignant B cells in the presence of ibrutinib (or PI3K inhibitor idelalisib) in vitro and in vivo. The FoxO1/Rictor/pAktS473 axis represents an early nongenetic adaptation to B cell receptor (BCR) inhibitor therapy not requiring PI3Kδ or BTK kinase activity. We further demonstrate that FoxO1 can be targeted therapeutically and its inhibition induces CLL cells' apoptosis alone or in combination with BTK inhibitors (ibrutinib, acalabrutinib, pirtobrutinib) and blocks their proliferation triggered by T cell factors (CD40L, IL-4, and IL-21).

Keywords: Drug therapy; Hematology; Leukemias; Oncology; Signal transduction.


Conflict of interest statement

Conflict of interest: JRB has served as a consultant for Abbvie, Acerta/Astra-Zeneca, BeiGene, Eli Lilly, Genentech/Roche, Grifols Worldwide Operations, Hutchmed, iOnctura, Janssen, MEI Pharma, Numab Therapeutics, Pfizer, and Pharmacyclics; and received research funding from BeiGene, Gilead, iOnctura, Loxo/Lilly, MEI Pharma, SecuraBio, and TG Therapeutics. MSD has received consulting fees from AbbVie, Adaptive Biosciences, Aptitude Health, Ascentage Pharma, AstraZeneca, BeiGene, Bio Ascend, BMS, Celgene, Curio Science, Eli Lilly, Genentech, Janssen, Merck, Ono Pharmaceuticals, Research to Practice, Secura Bio, TG Therapeutics, and Takeda, and research support from AbbVie, AstraZeneca, Ascentage Pharma, Genentech, MEI Pharma, Novartis, Surface Oncology, and TG Therapeutics. MM received a travel and educational grant from Janssen-Cilag s.r.o.

Figures

Figure 1
Figure 1. CLL cells induce Akt phosphorylation during ibrutinib treatment.
(A) Representative pAktS473 immunoblots in primary CLL samples (n = 2) obtained before and during ibrutinib treatment in vivo. (B) Densitometric quantification of relative pAktS473 protein levels in primary CLL samples obtained before and during ibrutinib treatment in vivo (n = 31). P value for trend calculated with linear mixed-effect model; other P values were calculated using paired t test. Black lines indicate samples with pAktS473 upregulation (n = 22) or stable levels (n = 2); blue lines indicate samples with pAktS473 downregulation (n = 7). The pAktS473 levels were normalized to both total Akt and GAPDH (loading control) to obtain precise quantification. For patient characteristics, see Supplemental Table 8. (C) Representative immunoblot of MEC1 cells treated with ibrutinib (2 μM, 1–5 days). (D) Densitometric quantification of relative pAktS473 protein levels in MEC1 cells treated with ibrutinib (2 μM) for 1–5 days (n = 4). The pAktS473 levels at day 0 were set as 1. Fresh ibrutinib was added to culture media each day. P values were calculated using paired t test. (E) Relative absolute lymphocyte count (ALC) in patients treated with ibrutinib in vivo that had upregulated/stable (n = 23) or downregulated (n = 6) levels of pAktS473 in the first 12 weeks of the therapy (stratification according to B). All samples with available clinical data were analyzed. P values were calculated using Mann-Whitney U test. (F) Relative viability of CLL samples (n = 4) obtained from patients before and after 4 weeks (n = 2), 6 weeks (n = 1), or 8 weeks (n = 1) of ibrutinib therapy in vivo and treated (72 hours) with Akt inhibitor MK-2206 (1.25, 2.5, 5, and 10 μM) or a combination of ibrutinib (ibr, 1 μM) and MK-2206 (1.25, 2.5, 5, and 10 μM), or vehicle. Statistical difference was tested using 2-way ANOVA with Geisser-Greenhouse correction. For patient characteristics, see Supplemental Table 8.
Figure 2
Figure 2. Induction in Akt activity during ibrutinib treatment is caused by Rictor upregulation.
(A) Heatmap of differentially expressed genes from samples obtained before and during ibrutinib treatment in vivo (P adj < 0.05; base mean > 100; n = 11 pairs). List includes genes overlapping with genes involved in PI3K/Akt signaling (gene sets: no. M27162, reactome_PI3K_AKT_signalling _in_cancer and has04151, KEGG: PI3K-Akt signaling pathway). (B) PI3K/Akt pathway with visualization of genes differentially expressed in patients treated with ibrutinib in vivo. (C) Representative immunoblots of Rictor in primary CLL samples obtained before and during ibrutinib treatment in vivo (n = 2). (D) Densitometric quantification of Rictor protein levels in primary CLL samples obtained before and during ibrutinib treatment in vivo for 2–8 weeks (n = 39). (E) Relative Rictor protein levels analyzed by densitometric quantification of immunoblots in MEC1 cells treated with ibrutinib (2 μM) for 5 days (n = 5; representative immunoblot in Figure 1C). (F) Representative immunoblot of WT and Rictor-KO MEC1 clones (Rictor-KO). Cells treated with ibrutinib (2 μM) for 1 or 9 days. (G) Competitive growth of WT versus Rictor-KO MEC1 cells. (n = 4 repetitions for each of the 2 clones, WT clones are marked by numbers corresponding to the specific KO clone that was used in the corresponding competitive growth experiment). Cells were treated with ibrutinib (2 μM, fresh ibrutinib was added 3 times a week) or vehicle (DMSO). Graph represents percentage of KO versus WT ibrutinib-treated cells, and this is plotted relative to vehicle-treated (DMSO) KO or WT cells, respectively, to correct for any effect of the KO on ibrutinib-unrelated cell fitness. Statistical difference was tested using 2-way ANOVA with Geisser-Greenhouse correction. (H) Representative immunoblot of MEC1 cells treated with mTOR inhibitor AZD8055 (0.1–10 μM, 24 hours). (I) Representative immunoblot of primary CLL cells treated with mTOR inhibitor AZD8055 (0.5 μM) for 24 hours and then stimulated with anti-IgM (20 μg/ml) for 10 minutes. (J) Representative immunoblot of primary CLL cells treated with mTOR inhibitor AZD8055 (0.5 μM) for 24 hours and then stimulated with bead-bound anti-IgM for 3 hours. (K) Relative protein levels of pAktS473 and cMYC obtained by densitometric quantification of immunoblots from the experiment described in J (n = 5). (L) Relative viability (WST-1 absorbance) in CLL cells (n = 6) treated with ibrutinib (ibr, 1 μM), idelalisib (idela, 1 μM), AZD8055 (mTOR inh, 0.5 μM), or their combination (48 hours). P values in D, E, K, and L were calculated using paired t test. For patient characteristics, see Supplemental Table 8.
Figure 3
Figure 3. FoxO1 is more active in ibrutinib-treated CLL cells and binds to RICTOR promoter.
(A) Representative immunoblots of FoxO1 in primary CLL samples obtained before and during ibrutinib therapy in vivo (n = 3). (B) Densitometric quantification of relative FoxO1 protein levels (immunoblots) in primary CLL samples obtained before and during ibrutinib therapy in vivo (2–8 weeks, n = 31). P value was calculated using paired t test. For patient characteristics, see Supplemental Table 8. (C) Representative immunoblot of MEC1 cells treated with 2 μM ibrutinib (1–5 days). The immunoblot is from the same samples as in Figure 1C to allow a comparison. (D) Densitometric quantification of relative pFoxO1T24/FoxO1 protein levels analyzed by immunoblot in MEC1 cells treated with 2 μM ibrutinib for 1–5 days (n = 4). FoxO1T24 phosphorylation inhibits FoxO1 functions in the nucleus. Fresh ibrutinib was added to culture media each day. P values were calculated using paired t test. (E) Heatmap of FoxO1 binding to transcription start site (TSS) regions containing its binding motif in MEC1 cells treated 6 days with vehicle (DMSO) or ibrutinib (1 μM). (F and G) Pathway enrichment analysis of FoxO1-bound genes in MEC1 cells treated with ibrutinib (1 μM) or vehicle (6 days). (F) Pathway enrichment analysis (Enrichr tool) of FoxO1-bound genes overlapping between vehicle (DMSO) and ibrutinib-treated MEC1 cells. (G) Pathway enrichment analysis (Enrichr tool) of genes bound by FoxO1 preferentially in ibrutinib-treated MEC1 cells compared with vehicle -treated (DMSO) cells. P values were calculated by Enrichr tool using Fisher’s exact test. (H) FoxO1 binding to Rictor promoter region in MEC1 cells treated with vehicle (DMSO) or ibrutinib (1 μM) for 6 days revealing increased reads per kb per transcript per million reads mapped (RPKM) in ibrutinib-treated cells. FoxO1 Ab represents pull-down with anti-FoxO1 antibody, Pol II Ab represents pull-down with anti-polymerase II antibody (serves as control), and IgG Ab represents pull-down with control IgG antibody (negative control).
Figure 4
Figure 4. FoxO1-KO or inhibition leads to decrease of Rictor and pAktS473 levels.
(A) Representative immunoblot of FoxO1-KO MEC1 clones and densitometric quantification of relative Rictor and pAktS473 protein levels in all obtained FoxO1-KO MEC1 clones with complete FoxO1 KO (n = 15). P values were calculated using unpaired t test. (B) Representative immunoblot of WT and FoxO1-KO MEC1 clones (n = 4). Cells were treated with ibrutinib (1 μM) for 7 days. Fresh ibrutinib was added to culture media every other day. (C) Competitive growth of WT MEC1 cells versus FoxO1-KO MEC1 clones in medium with ibrutinib (2 μM, 4 weeks) relative to growth in medium with vehicle (DMSO). WT and FoxO1-KO cells marked with GFP or AZURIT (and vice versa) and mixed in 1:1 ratio (n = 4 repetitions for each of the 3 clones, WT clones are marked by numbers corresponding to the specific KO clone that was used in the corresponding competitive growth experiment). Cells were treated with ibrutinib (fresh ibrutinib was added 3 times a week) or DMSO. Graph represents the percentage of KO versus WT ibrutinib-treated cells, and this is plotted relatively to vehicle-treated (DMSO) KO or WT cells, respectively, to correct for any effect of the KO on ibrutinib-unrelated cell fitness. Statistical difference was tested using 2-way ANOVA with Geisser-Greenhouse correction. (D) Representative immunoblot of MEC1 cells treated with various FoxO1 inhibitor concentrations (72 hours). (E) Representative immunoblot of MEC1 cells treated with FoxO1 inhibitor (inh) or mTOR inhibitor (both 0.5 μM, 24 hours). (F) Representative immunoblot of primary CLL cells treated with FoxO1 inhibitor or mTOR inhibitor for 48 hours (both 0.5 μM) and then stimulated with anti-IgM (20 μg/ml, 10 minutes). (G) Representative immunoblot of primary CLL cells treated with FoxO1 inhibitor (0.5 μM) for 48 hours and then stimulated with bead-bound anti-IgM (3 hours). (H) Relative protein levels of pAktS473 and cMYC obtained by densitometric quantification of immunoblots from experiment in G (n = 6). P values were calculated using paired t test.
Figure 5
Figure 5. FoxO1/Rictor/pAktS473 is responsible for adaptation to idelalisib.
(A) Heatmap of differentially expressed genes from samples obtained before and during idelalisib treatment in vivo (P adj < 0.05; base mean > 100; n = 11 pairs) and overlapped with 2 databases of genes involved in PI3K/Akt signaling (gene sets: no. M27162, reactome_PI3K_AKT_signalling_in_cancer and has04151, KEGG: PI3K-Akt signaling pathway). Lower expression indicated in blue, higher in yellow. Genes marked with asterisks were also differentially expressed after ibrutinib treatment in vivo (see Figure 2A). List of top 500 differentially expressed genes is included in Supplemental Table 5. (B) Representative immunoblot of Rictor, FoxO1, and pAktS473 in primary CLL sample treated with idelalisib in vivo. (C) Densitometric quantification of relative pAktS473, Rictor, and FoxO1 protein levels analyzed by immunoblot in primary samples of CLL patients treated with idelalisib in vivo for 2–4 weeks (n = 11 for pAktS473 and FoxO1; n = 9 for Rictor). P values were calculated using Wilcoxon’s test. For patient characteristics, see Supplemental Table 8. (D) Competitive growth of WT versus FoxO1-KO MEC1 cells in medium with idelalisib (2 μM, 4 weeks) relative to growth in medium with vehicle (DMSO). WT and FoxO1-KO cells marked with GFP or AZURIT (and vice versa) and mixed in 1:1 ratio (n = 4 repetitions for each of the 3 clones, WT clones are marked by numbers corresponding to the specific KO clone that was used in the corresponding competitive growth experiment). Graph represents the percentage of KO versus WT idelalisib-treated cells, and this is plotted relatively to vehicle-treated (DMSO) KO or WT cells, respectively, to correct for any effect of the KO on idelalisib-unrelated cell fitness. Statistical difference was tested using 2-way ANOVA with Geisser-Greenhouse correction.
Figure 6
Figure 6. FoxO1 is a potential therapeutic target alone or in combination with BCR inhibitors.
(A) Representative immunoblot of MEC1 cells treated with ibrutinib (2 μM), FoxO1 inhibitor (0.5 μM), or their combination for 6 days. (B) Densitometric quantification of Rictor and pAktS473 protein levels in MEC1 cells treated with ibrutinib (2 μM), FoxO1 inhibitor (0.5 μM), or their combination for 6 days (n = 4). (C) Representative immunoblot of primary CLL cells pretreated with ibrutinib (1 μM) or idelalisib (1 μM) for 24 hours and subsequently with FoxO1 inhibitor (0.5 μM) or AZD8055 (mTOR inh, 0.5 μM) added to the culture for additional 48 hours. (D) Relative viability of primary CLL cells (n = 7) pretreated with vehicle, ibrutinib (1 μM), or idelalisib (1 μM) for 24 hours and then treated with FoxO1 inhibitor (0.5 μM) for additional 48 hours. Combination index = 1.01 for ibrutinib and FoxO1 inhibitor, and 0.97 for idelalisib and FoxO1 inhibitor. For patient characteristics, see Supplemental Table 8. (E) Relative viability of MEC1 cells treated with ibrutinib (2 μM), FoxO1 inhibitor (0.5 μM), or their combination (96 hours, n = 5). Combination index = 0.64. (F) Relative WST-1 absorbance in MEC1 cells treated (48 hours) with ibrutinib (2 μM), FoxO1 inhibitor (0.5 μM), or their combination (n = 5). (G) Relative viability of paired CLL samples (n = 5) obtained before and after 1 month (n = 2) or 2 months (n = 3) of ibrutinib therapy in vivo. Upon thawing, cells were treated with ibrutinib (1 μM), FoxO1 inhibitor (0.5 μM), or their combination (72 hours). For patient characteristics, see Supplemental Table 8. All P values in Figure 5 were calculated using paired t test.
Figure 7
Figure 7. FoxO1 inhibition overcomes microenvironmental protection and blocks CLL cells’ proliferation induced by T cell factors.
(A and B) Relative viability of primary CLL cells cocultured with HS5 cells. CLL cells were cocultured for 5 or 10 days on (A) WT HS5 or (B) HS5CD40L,IL-4,IL-21 and treated with ibrutinib (1 μM), acalabrutinib (acal, 1 μM), FoxO1 inhibitor (0.5 μM), or their combination. (C and D) Proliferation of primary CLL cells cocultured with stromal cells HS5CD40L,IL-4,IL-21 treated with ibrutinib (1 μM), FoxO1 inhibitor (0.5 μM), or their combination. (C) Representative CFSE staining histogram in 2 primary CLL samples. Proliferation rate quantified by dilution of CFSE signal. (D) Probability (calculated from precursor frequency) that cells will divide at least once (n = 10). (E) Cell cycle measured by propidium iodide (PI) staining in MEC1 cells treated with ibrutinib (1 μM), FoxO1 inhibitor (0.5 μM), or their combination for 96 hours (n = 5). P values are calculated for differences in percentages of cells in S phase. (F and G) Relative viability of primary CLL cells obtained for patients at the time of progression on BTK inhibitors and cocultured for 5 or 10 days on (F) WT HS5 or (G) HS5CD40L,IL-4,IL-21 and treated with FoxO1 inhibitor (0.5 μM). (H) Relative levels of cell-surface CD20 and CXCR4 levels in primary CLL cells (n = 9) treated with FoxO1 inhibitor (0.5 μM, 48 hours). For patient characteristics, see Supplemental Table 8. All P values in Figure 6 were calculated using paired t test.
Figure 8
Figure 8. Role of FoxO1/Rictor/pAktS473 axis in the adaptation to BTK inhibition.
BTK inhibitor treatment leads to FoxO1 induction. FoxO1 subsequently binds to the Rictor promoter and increases its expression, which supports mTORC2 complex activity. mTORC2 directly phosphorylates Akt at S473 independently of BCR-associated kinases BTK and PI3K. This adaptation mechanism to BTK inhibitor treatment can be overcome by FoxO1 inhibition, which leads to apoptosis of cells and inhibition of proliferation.

References

    1. Burger JA, et al. Randomized trial of ibrutinib vs ibrutinib plus rituximab in patients with chronic lymphocytic leukemia. Blood. 2019;133(10):1011–1019. doi: 10.1182/blood-2018-10-879429. - DOI - PMC - PubMed
    1. Byrd JC, et al. Targeting BTK with ibrutinib in relapsed chronic lymphocytic leukemia. N Engl J Med. 2013;369(1):32–42. doi: 10.1056/NEJMoa1215637. - DOI - PMC - PubMed
    1. Furman RR, et al. Ibrutinib resistance in chronic lymphocytic leukemia. N Engl J Med. 2014;370(24):2352–2354. doi: 10.1056/NEJMc1402716. - DOI - PMC - PubMed
    1. Mato AR, et al. Toxicities and outcomes of 616 ibrutinib-treated patients in the United States: a real-world analysis. Haematologica. 2018;103(5):874–879. doi: 10.3324/haematol.2017.182907. - DOI - PMC - PubMed
    1. de Rooij MFM, et al. The clinically active BTK inhibitor PCI-32765 targets B-cell receptor- and chemokine-controlled adhesion and migration in chronic lymphocytic leukemia. Blood. 2012;119(11):2590–2594. doi: 10.1182/blood-2011-11-390989. - DOI - PubMed

MeSH terms