. 2024 Oct 22;134(24):e182217.
doi: 10.1172/JCI182217.

MOGAT3-mediated DAG accumulation drives acquired resistance to anti-BRAF/anti-EGFR therapy in BRAFV600E-mutant metastatic colorectal cancer

Affiliations

MOGAT3-mediated DAG accumulation drives acquired resistance to anti-BRAF/anti-EGFR therapy in BRAFV600E-mutant metastatic colorectal cancer

Jiawei Wang et al. J Clin Invest. .

Abstract

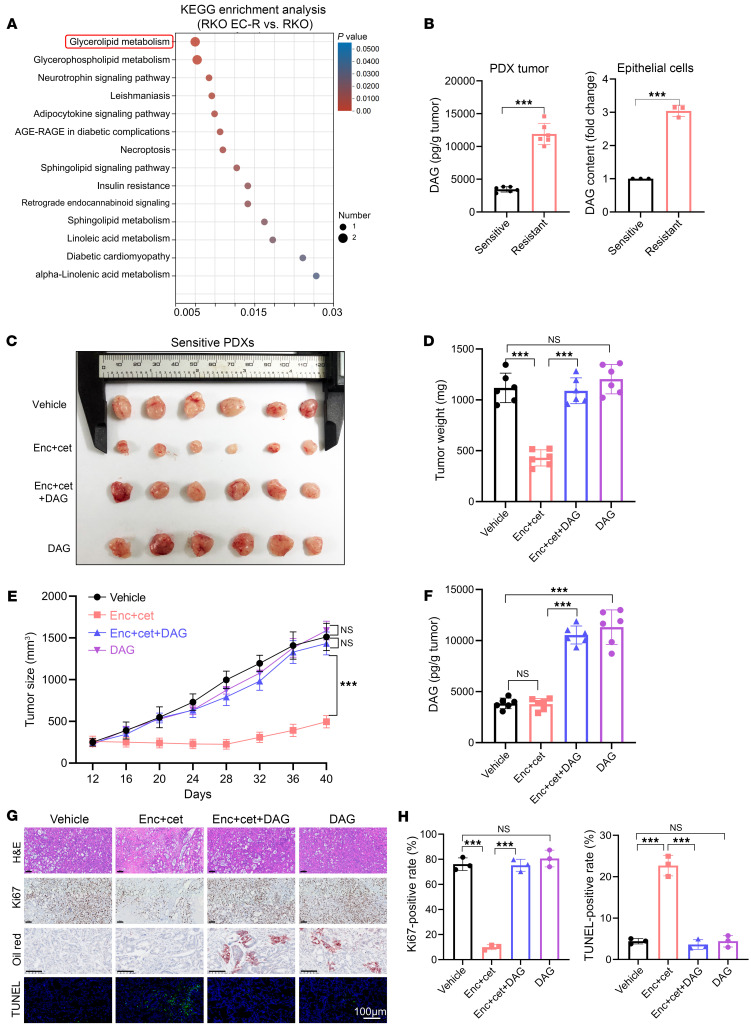
BRAFV600E-mutant metastatic colorectal cancer (mCRC) is associated with poor prognosis. The combination of anti-BRAF/anti-EGFR (encorafenib/cetuximab) treatment for patients with BRAFV600E-mutant mCRC improves clinical benefits; unfortunately, inevitable acquired resistance limits the treatment outcome, and the mechanism has not been validated. Here, we discovered that monoacylglycerol O-acyltransferase 3-mediated (MOGAT3-mediated) diacylglycerol (DAG) accumulation contributed to acquired resistance to encorafenib/cetuximab by dissecting a BRAFV600E-mutant mCRC patient-derived xenograft (PDX) model exposed to encorafenib/cetuximab administration. Mechanistically, the upregulated MOGAT3 promoted DAG synthesis and reduced fatty acid oxidation-promoting DAG accumulation and activated PKCα/CRAF/MEK/ERK signaling, driving acquired resistance. Resistance-induced hypoxia promoted MOGAT3 transcriptional elevation; simultaneously, MOGAT3-mediated DAG accumulation increased HIF1A expression at the translation level through PKCα/CRAF/eIF4E activation, strengthening the resistance status. Intriguingly, reducing intratumoral DAG with fenofibrate or PF-06471553 restored the antitumor efficacy of encorafenib/cetuximab in resistant BRAFV600E-mutant mCRC, which interrupted PKCα/CRAF/MEK/ERK signaling. These findings reveal the critical role of the metabolite DAG as a modulator of encorafenib/cetuximab efficacy in BRAFV600E-mutant mCRC, suggesting that fenofibrate might prove beneficial for resistant BRAFV600E-mutant mCRC patients.

Keywords: Colorectal cancer; Drug therapy; Gastroenterology; Therapeutics.


Figures

Figure 1
Figure 1. Encorafenib- and cetuximab-resistant BRAFV600E-mutant mCRC tumors exhibited abnormal lipid-metabolizing activity.
(A) Patient-derived BRAFV600E-mutant mCRC samples: Computed tomography picture shows primary tumor location (left) and H&E morphology of original primary and PDX tumor mass (right). (B) Mean tumor volumes (±SEM) of BRAFV600E-mutant mCRC PDXs treated with encorafenib and cetuximab relative to baseline (T0) (n = 6). (C) Bubble plot showing KEGG pathways (https://www.genome.jp/kegg/pathway.html) of upregulated genes enriched in resistant PDX tumors versus sensitive PDX tumors based on RNA-seq data (n = 3). (D) Heatmap showing metabolic pathways genes related to C (n = 3). (E) Bar chart presenting a classification of metabolic pathways genes related to D. (F) Gene set enrichment analysis (GSEA) of resistant tumors versus sensitive tumors (n = 3) showing enhanced lipid metabolic process. Normalized enrichment score (NES) and nominal P value are provided according to GSEA. (G) Lipid droplet content of tumors was assessed by Nile red staining over 3 periods. Representative images are shown from 3 independent experiments. Scale bar: 20 μm. (H) RKO, RKO EC-R, HT29, and HT29 EC-R cells were stained with BODIPY 493/503 (green). Representative images are shown from 3 independent experiments. Scale bar: 10 μm.
Figure 2
Figure 2. DAG accumulation drives the acquired resistance of BRAFV600E-mutant mCRC to BRAF/EGFR inhibitor treatment.
(A) Bubble plot showing KEGG pathways of upregulated metabolites enriched in RKO EC-R versus RKO cells based on lipidomic analysis (n = 6). The x axis shows the P values. (B) DAG content in PDX tumors (n = 6) and DAG content in tumor epithelial cells (n = 3). (CF) Xenograft tumor size in nude mice inoculated with encorafenib- and cetuximab-sensitive BRAFV600E-mutant mCRC tumor tissues (n = 6). (C) PDXs were treated i.p. with vehicle (PBS), encorafenib-cetuximab, encorafenib-cetuximab combined with DAG, or DAG alone. (D) Tumor weight, (E) tumor growth, and (F) intratumoral DAG level. (G) Representative images of H&E, Ki67, Oil Red O, and TUNEL staining related to C. Scale bar: 100 μm. (H) Ki67 and TUNEL quantitation (n = 3). The data are presented as mean ± SEM of 3 independent experiments. NS, no significance. ***P < 0.001 by 2-tailed, unpaired t test (B), 1-way ANOVA with Tukey’s multiple-comparison test (D, F, and H), or 2-way ANOVA with Tukey’s multiple-comparison test (E).
Figure 3
Figure 3. MOGAT3-mediated DAG elevation determines anti-BRAF/EGFR treatment failure in BRAFV600E-mutant mCRC tumors.
(A) Representative IHC images of MOGAT3 in baseline, sensitive, and resistant tumor tissues. Scale bar: 100 μm. (B) Top: Western blots showing protein expression of MOGAT3 in RKO, RKO EC-R, HT29, and HT29 EC-R cells. Representative blots are shown. MOGAT3KO RKO EC-R and HT29 EC-R, along with RKO EC-R-CTRL and HT29 EC-R-CTRL cell lines, were exposed to 2 μM encorafenib/4 μM cetuximab for 96 hours. Bottom: Relative OD value was assessed to determine cell viability by the CCK-8 assay (n = 3). (CE) Xenograft tumor size in nude mice inoculated with RKO EC-R cells (CTRL) or MOGAT3KO RKO EC-R cells, and treated with just encorafenib-cetuximab or encorafenib-cetuximab in combination with i.p. injection of DAG. (C) Tumor weight, (D) tumor DAG level, and (E) tumor growth in nude mice (n = 6). (FH) Xenograft tumor size in nude mice inoculated with RKO cells (Nc) or RKO Oe-MOGAT3 cells and treated with encorafenib-cetuximab. (F) Xenograft tumor weight, (G) DAG level in tumor tissues, and (H) tumor growth (n = 6). (IK) Xenograft tumor size in nude mice inoculated with encorafenib-cetuximab–resistant BRAFV600E-mutant mCRC tumor tissues. PDXs were treated with vehicle (PBS), 20 mg/kg encorafenib/20 mg/kg cetuximab, or MOGAT3 inhibitor PF-06471553 (Pf; 50 mg/kg) alone or in combination with encorafenib-cetuximab. (I) Xenograft tumor weight, (J) DAG level in tumor tissues, and (K) growth in nude mice (n = 6). The data are presented as mean ± SEM of 3 independent experiments. NS, no significance. ***P < 0.001 by 2-way ANOVA with Tukey’s multiple-comparison test (B, E, H, and K), 1-way ANOVA with Tukey’s multiple-comparison test (C, D, I, and J), or 2-tailed, unpaired t test (F and G).
Figure 4
Figure 4. Highly expressed MOGAT3 promotes lipid synthesis and inhibits lipid OXPHOS, resulting in DAG accumulation.
(A) Schematic diagram of the main DAG synthesis pathway. (B) Western blot showing the protein expression levels of LPIN1 and MOGAT3 in RKO and RKO EC-R cells. A representative blots is shown. (C) DAG level in RKO EC-R MOGAT3KO CDX (n = 6). (D) Oxygen consumption rate (OCR) in RKO and RKO EC-R cells. Oligo, oligomycin; FCCP, carbonyl cyanide 4-trifluoromethoxy-phenylhydrazone; Rot, rotenone. (E) OXPHOS-related indicators were quantified (n = 4). (F) OCR in RKO EC-R and RKO EC-R MOGAT3KO cells. (G) OXPHOS-related indicators were quantified (n = 8). (HK) FAO assay of RKO and RKO EC-R cells (H) and RKO EC-R MOGAT3KO cells (J). Cells treated with FCCP were used as the positive control, and cells treated with etomoxir (Eto) were used as the negative control. (I and K) Graphs show relative FAO rates (n = 3). The data are presented as mean ± SEM of 3 independent experiments. NS, no significance. **P < 0.01; ***P < 0.001 by 2-tailed, unpaired t test (C, E, G, I, and K) or 2-way ANOVA with Tukey’s multiple-comparison test (H and J).
Figure 5
Figure 5. MOGAT3 reactivates MAPK through DAG-mediated PKCα/CRAF axis.
(A) RKO EC-R cells transfected with siRNA-NC, siRNA-MOGAT3-1, or siRNA-MOGAT3-2 were treated with 2 μM encorafenib/4 μM cetuximab for 72 hours. Western blot assessing MOGAT3 and MEK/ERK signaling. Representative blots are shown. (B) Immunoblot analysis of MEK/ERK signaling in RKO EC-R cells treated with 2 μM encorafenib/4 μM cetuximab, 10 μM PF-06471553 (Pf), alone or in combination for 48 hours. (C) RKO EC-R cells transfected with siRNA-NC, siRNA-MOGAT3-1, or siRNA-MOGAT3-2 treated with 2 μM encorafenib/4 μM cetuximab for 72 hours. Western blot detecting MOGAT3 and PKCα/CRAF signaling. (D) Immunofluorescence of p-PKCα signaling in HT29 and HT29 EC-R cells. Representative images are shown. Scale bar: 10 μm. The images on the far right were further magnified ×4. (E) Immunoblot analysis of PKCα/CRAF signaling in RKO EC-R cells treated with 2 μM encorafenib/4 μM cetuximab, Pf (10 μM), alone or a combination of both for 48 hours. (F) Western blot detecting PKCα/CRAF and MEK/ERK signaling in RKO EC-R cells treated with siRNA-PKCα, siRNA-CRAF, or a combination of both for 48 hours. (G) Immunoblot analysis of PKCα/CRAF and MEK/ERK signaling in RKO cells treated with 0.25 μM encorafenib/0.5 μM cetuximab, 10 μM DAG, or a combination of both for 48 hours. (H) Western bolts detecting the intracellular signal change in encorafenib/cetuximab-resistant PDXs from Figure 3I. The tumor tissues were harvested for Western blotting to detect the indicated signaling proteins. A representative blot is shown from 3 independent experiments.
Figure 6
Figure 6. Accumulated DAG enhances MOGAT3 transcription expression through PKCα/CRAF/eIF4E/HIF1A signaling activation.
(A) Gene set enrichment analysis (GSEA) of resistant tumors versus sensitive tumors (n = 3) shows enhanced HIF1A signaling pathway. Normalized enrichment score (NES) and nominal P value were provided according to GSEA. (B) Immunoblot analysis of MOGAT3 and HIF1A in RKO and RKO EC-R cells. (C) Immunoblot analysis of HIF1A and MOGAT3 in RKO and RKO EC-R cells treated with encorafenib-cetuximab for 48 hours. (D) Immunoblot analysis of HIF1A and MOGAT3 in RKO EC-R cells after siRNA-HIF1A knockdown for 72 hours (left) or treated with the indicated concentrations of YC-1 (1 μM) for 24 hours (right). (E) Immunoblot analysis of HIF1A and MOGAT3 in RKO cells after hypoxia for 0, 4, 8, and 12 hours. (F) Illustration of HIF1A site and the predicted HIF1A site in the MOGAT3 promoter. The HIF1A motif in the ACGTGC promoter was predicted by JASPAR 2022 (https://jaspar2022.genereg.net/). (G) Left: ChIP-PCR confirms that HIF1A can directly transcriptionally regulate MOGAT3. Right: RT-qPCR of ChIP-PCR (n = 3). (H) Luciferase reporter assay shows that HIF1A overexpression significantly activated the promoter activity of MOGAT3 (n = 3). (I) Immunoblot analysis of MOGAT3 and HIF1A in RKO cells treated with DAG for 48 hours. (J) Immunoblot analysis of p-CRAF/CRAF, p-PKCα/PKC, p-eIF4E/eIF4E, and HIF1A in RKO EC-R cells treated with siRNA-PKCα or siRNA-CRAF for 48 hours. (K) Immunoblot analysis of p-eIF4E and eIF4E in RKO and RKO EC-R cells. (L) Immunoblot analysis of p-eIF4E/eIF4E and HIF1A in RKO EC-R cells after treatment with p-eIF4E inhibitor (10 μM) or plus DAG (10 μM) for 24 hours. (M) Immunoblot analysis of p-eIF4E/eIF4E and HIF1A in RKO EC-R cells treated with DAG for 48 hours. The data are presented as mean ± SEM of 3 independent experiments. NS, no significance. *P < 0.05; ***P < 0.001 by 2-tailed, unpaired t test (G) or 1-way ANOVA with Tukey’s multiple-comparison test (H).
Figure 7
Figure 7. Reducing intratumoral DAG with fenofibrate overcomes the resistance of BRAFV600E-mutant mCRC tumors upon dual therapy.
(AC) Xenograft tumor size in nude mice inoculated with encorafenib- and cetuximab-resistant BRAFV600E-mutant mCRC tumor tissues treated with vehicle (PBS), encorafenib (20 mg/kg), cetuximab (20 mg/kg), or fenofibrate (100 mg/kg), alone or all 3 together (n = 6). (A) Representative tumor images. (B) Quantification of DAG levels in tumor tissues. (C) Quantification of tumor growth (n = 6). (D) Representative images of H&E, Ki67, Oil Red O, and TUNEL staining. (E) The quantitation of Ki67 and TUNEL (n = 4). (F) Immunoblot analysis of PKCα/CRAF and MEK/ERK signaling in tumor tissues related to A. (G and H) Xenograft tumor size in nude mice inoculated with encorafenib- and cetuximab-resistant BRAFV600E-mutant mCRC tumor tissues orally treated with vehicle (PBS), encorafenib/cetuximab (20 mg/kg, 20 mg/kg), encorafenib/cetuximab/fenofibrate (20 mg/kg, 20 mg/kg, 100 mg/kg), encorafenib/cetuximab/fenofibrate/PMA (20 mg/kg, 20 mg/kg, 100 mg/kg, 20 mg/kg), encorafenib/cetuximab/PKC-IN-1 (20 mg/kg, 20 mg/kg, 30 mg/kg), or encorafenib/cetuximab/RAF-IN-1 (20 mg/kg, 20 mg/kg, 30 mg/kg) (n = 6). (G) Representative images of xenograft tumor growth in nude mice. (H) Quantification of tumor growth. (I) Western bolt assessing the protein expression of PKCα/CRAF/MEK/ERK signaling in encorafenib/cetuximab-resistant PDXs from G. The tumor tissues were harvested for Western blotting to detect the indicated signaling proteins. A representative blot is shown from 3 independent experiments. The data are presented as mean ± SEM of 3 independent experiments. NS, no significance. ***P < 0.001 by 1-way ANOVA with Tukey’s multiple-comparison test (B and E) or 2-way ANOVA with Tukey’s multiple-comparison test (C and H).

References

    1. Sung H, et al. Global cancer statistics 2020: GLOBOCAN estimates of incidence and mortality worldwide for 36 cancers in 185 countries. CA Cancer J Clin. 2021;71(3):209–249. doi: 10.3322/caac.21660. - DOI - PubMed
    1. Barras D. BRAF mutation in colorectal cancer: an update. Biomark Cancer. 2015;7(suppl 1):9–12. doi: 10.4137/BIC.S25248. - DOI - PMC - PubMed
    1. Sanz-Garcia E, et al. BRAF mutant colorectal cancer: prognosis, treatment, and new perspectives. Ann Oncol. 2017;28(11):2648–2657. doi: 10.1093/annonc/mdx401. - DOI - PubMed
    1. Tabernero J, et al. Encorafenib plus cetuximab as a new standard of care for previously treated BRAF V600E-mutant metastatic colorectal cancer: updated survival results and subgroup analyses from the BEACON Study. J Clin Oncol. 2021;39(4):273–284. doi: 10.1200/JCO.20.02088. - DOI - PMC - PubMed
    1. Kopetz S, et al. Encorafenib, binimetinib, and cetuximab in BRAF V600E-mutated colorectal cancer. N Engl J Med. 2019;381(17):1632–1643. doi: 10.1056/NEJMoa1908075. - DOI - PubMed

MeSH terms