. 2025 Jan 2;85(1):118-133.
doi: 10.1158/0008-5472.CAN-23-3256.

SOS1 Inhibition Enhances the Efficacy of KRASG12C Inhibitors and Delays Resistance in Lung Adenocarcinoma

Affiliations

SOS1 Inhibition Enhances the Efficacy of KRASG12C Inhibitors and Delays Resistance in Lung Adenocarcinoma

Brianna R Daley et al. Cancer Res. .

Abstract

The clinical effectiveness of KRASG12C inhibitors (G12Ci) is limited both by intrinsic and acquired resistance, necessitating the development of combination approaches. Here, we identified targeting proximal receptor tyrosine kinase signaling using the SOS1 inhibitor (SOS1i) BI-3406 as a strategy to improve responses to G12Ci treatment. SOS1i enhanced the efficacy of G12Ci and limited rebound receptor tyrosine kinase/ERK signaling to overcome intrinsic/adaptive resistance, but this effect was modulated by SOS2 protein levels. G12Ci drug-tolerant persister (DTP) cells showed up to a 3-fold enrichment of tumor-initiating cells (TIC), suggestive of a sanctuary population of G12Ci-resistant cells. SOS1i resensitized DTPs to G12Ci and inhibited G12C-induced TIC enrichment. Co-mutation of the tumor suppressor KEAP1 limited the clinical effectiveness of G12Ci, and KEAP1 and STK11 deletion increased TIC frequency and accelerated the development of acquired resistance to G12Ci, consistent with clinical G12Ci resistance seen with these co-mutations. Treatment with SOS1i both delayed acquired G12Ci resistance and limited the total number of resistant colonies regardless of KEAP1 and STK11 mutational status. Together, these data suggest that targeting SOS1 could be an effective strategy to both enhance G12Ci efficacy and prevent G12Ci resistance regardless of co-mutations. Significance: The SOS1 inhibitor BI-3406 both inhibits intrinsic/adaptive resistance and targets drug tolerant persister cells to limit the development of acquired resistance to clinical KRASG12C inhibitors in lung adenocarcinoma cells.


Conflict of interest statement

The Kortum laboratory receives funding from Boehringer Ingelheim to study SOS1 as a therapeutic target in RAS-mutated cancers.

Figures

Figure 1.
Figure 1.
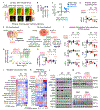
SOS1i synergizes with G12Ci to drive transcriptional changes regulating MAPK and hypoxia pathways. A-C, Heat map of cell viability (top) and excess over Bliss (bottom) for H358 cells treated with a 9×9 matrix of the indicated G12Ci ± SOS1i (A), sum of excess over Bliss values (B) or quantitation of the change in G12Ci potency (log α2) vs. efficacy (βobs) (C). D-K, RNA sequencing of 3D spheroid cultured H358 cells treated with G12Ci (10 nM) ± SOS1i (100 nM) for 6h or 72h. MPAS score (D); Venn Diagrams from GVSA analysis of Hallmark MsigDB gene sets (E-F); gene set enrichment (G) and GVSA analysis (H) of hypoxia associated genes; VIPR scores of selected transcription factor signatures (I); heat maps of GVSA analysis of selected MsigDB hypoxia signatures (J) and PROGENy scores (K). L-M, Western blots of WCLs from 3D cultured H358 cells treated with G12Ci ± SOS1i for the indicated times. * p < 0.05, *** p< 0.001 for G12Ci treated vs. untreated; ### p < 0.001 for SOS1i treated vs. untreated. ^ p < 0.05, ^^ p < 0.01 for G12Ci vs. G12Ci + SOS1i treated for 72h. A-C, L-M are from three independent experiments.
Figure 2.
Figure 2.
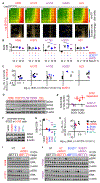
SOS2 expression determines the extent of G12Ci:SOS1i synergy. A-C, Heat map of cell viability (top) and excess over Bliss (bottom) for the indicated cells treated with a 9×9 matrix of G12Ci ± SOS1i or SHP2i (A), sum of excess over Bliss values (B) or quantitation of the change in G12Ci potency (log α2) vs. efficacy (βobs) (C). G12Ci:SOS1i in NT [squares cultured in 10% (closed) or 2% (open) serum] or SOS2KO (blue circles) cells; G12Ci:SHP2i (purple diamonds). *** p < 0.001 vs. NT cells treated with G12CI + SOS1i in 10% serum. D-E, Western blots of WCLs for SOS1, SOS2, tubulin, and β-actin (D) and plot of the relative ratio of SOS1:SOS2 versus the sum of the EOB values for G12Ci:SOS1i treatment (E). Red circles EOB > 0; purple diamonds EOB ≤ 0. F, Western blots of WCLs of H358 in which SOS2 overexpression was driven by one of four distinct promoters. G-H, Sum of excess over Bliss (G) or quantitation of the change in G12Ci potency (log α2) vs. efficacy (βobs) (H) for cells from (F) treated with a 9×9 matrix of G12Ci ± SOS1i. ** p < 0.01, *** p < 0.001 vs. controls; # p < 0.05, ## p < 0.01 vs. cells expressing SOS2 driven by a mCMV promoter. I-J, Western blots of WCLs of 3D spheroid-cultured H358 or H1373 (I) or NT vs. SOS2KO H1792 or H2030 cells (J) treated with G12Ci ± SOS1i for the indicated times. Data are from three independent experiments.
Figure 3.
Figure 3.
Isolated ALDHhigh populations are resistant to G12Ci but sensitive to combined G12Ci:SOS1i. A, Aldefluor staining for ALDH enzyme activity in H358 negative control (DEAB), untreated cells, or cells treated with 100 nM G12Ci for 72h. B, Gaiting strategy for isolating ALDHlow (green) versus ALDHhigh (dark blue) populations. C, G12Ci or MEKi dose response curves for unsorted (grey), ALDHlow (green), and ALDHhigh (dark blue) H358 cells Data are the mean ± sd from three independent experiments, each experiment had three technical replicates. D-G, Heat map of cell viability and excess over Bliss ALDHhigh or unsorted H358 cells treated with a 9 × 9 matrix of G12Ci ± SOS1i (D), sum of excess over Bliss values (E) or quantitation of the change in G12Ci potency (log α2) vs. efficacy (βobs) (F, zoom in for unsorted cells in G). H, G12Ci dose response curves for naïve H358 cells (black diamonds) or cells pre-treated with G12Ci for 72h and then rested (no G12Ci) for 72h prior to assessment (blue squares). I-J, Dose response curves of naïve (I) or G12Ci pre-treated (J) H358 cells alone or in the presence of either SOS1i (red) or ALDHi (purple). In C-J, data are the mean ± sd from three independent experiments, each experiment had three technical replicates.
Figure 4.
Figure 4.
SOS1i ± SOS2KO prevents G12Ci-induced TIC outgrowth. A-E. TIC frequency from in situ extreme limiting dilution assessment (ELDA) of the indicated cell lines: pre-treated with G12Ci 72h (A); treated with increasing dose of SOS1i (B); in unsorted, ALDHlow, and ALDHhigh cells ± SOS1i (C); in NT or SOS2KO cells ± SOS1i (D); in NT or SOS2KO cells pre-treated with G12Ci for 72h to upregulate TICs ± SOS1i (E); ## χ2 < 0.01 vs. untreated for TIC upregulation; * χ2 < 0.05, ** χ2 < 0.01 vs. untreated for SOS1i ± SOS2KO. F, ALDH/CD133 staining in H1373 DEAB negative control (DEAB), untreated cells, or cells treated with G12Ci for 72 hours. G, TIC frequency from G12Ci-treated cells from (F) isolated based on CD133 and ALDH staining. ** χ2 < 0.01 vs. unsorted; # χ2 < 0.05 vs. ALDHhigh/CD133+.
Figure 5.
Figure 5.
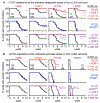
SOS1 inhibition limits the development of acquired G12Ci resistance. A-B, Assessment of acquired resistance to the G12Ci adagrasib (A) or sotorasib (B) in the indicated NT or SOS2KO cells treated with G12Ci alone (NT black; SOS2KO blue) or G12Ci + SOS1i (NT red; SOS2KO purple) at 100 nM (lite) or 300 nM (dark). Data are pooled from three independent experiments. *** p < 0.001 vs. G12Ci alone; ^^^ p < 0.001 vs. NT cells treated with SOS1i.
Figure 6.
Figure 6.
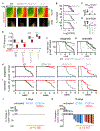
KEAP1 and STK11 co-mutations regulate resistance to G12Ci + SOS1i. A-C, Heat map of cell viability and excess over Bliss for the indicated cells treated with a 9×9 matrix of G12Ci ± SOS1i (A), G12Ci dose response curves (B), G12Ci EC50 values (C), and sum of excess over Bliss values for (D).NT (black closed squares), STK11KO (dk.grey closed circles), KEAP1KO (grey open squares), and STK11/KEAP1 DKO (lt.grey open circles) H358 cells.* p < 0.05, p < 0.01 vs. NT. Data are the mean from three independent experiments, each experiment had three technical replicates. E, TIC frequency in the indicated cells ± SOS1i. ** χ2 > 0.01, *** χ2 < 0.001 for SOS1i treated vs. untreated; ### χ2 < 0.001 vs. NT. F-G, In situ resistance assays assessing acquired adagrasib (F) or sotorasib (G) resistance in NT (black), STK11KO (dk.grey), KEAP1KO (grey), and STK11/KEAP1 DKO (lt.grey) cells. *** p < 0.001 vs. NT. H-I. Assessment of acquired resistance to the G12Ci adagrasib (H) or sotorasib (I) resistance in NT (black), STK11KO (dark grey), KEAP1KO (grey), and STK11/KEAP1 DKO (light grey) alone or in the presence of SOS1i (red). *** p < 0.001 for G12Ci vs G12Ci+SOS1i. J-K. Waterfall plot of percent change in tumor volume from H2030 xenografts left untreated or treated with G12Ci +/− SOS1i for 7d (J) or 10d (K).
Figure 7.
Figure 7.
SOS1i targets the continuum of G12Ci resistant states. (Left) Intrinsic G12Ci resistance is driven by adaptive reactivation of RTK signaling due to a loss of ERK-dependent negative feedback. SOS1i targets rebound RTK signaling to limit adaptive G12Ci resistance. (Middle) Cancer cells undergo non-genetic adaptation to G12Ci to both alter the redox environment and enhance alternative RTK signaling, both of which allow these ‘drug tolerant persister’ (DTP) cells to survive under therapeutic pressure. Within the DTP population, a subset of ‘tumor initiating cells’ (TICs) are capable of self-renewal and are thought to be the pharmacologic sanctuary driving that ultimately develop acquired resistance. SOS1i re-sensitizes DTPs to G12Ci and reduces TIC frequeny in G12Ci treated cultures. (Right) Acquired G12Ci resistance is often driven by RTK/RAS pathway reactivation by both genetic and non-genetic mechanisms. SOS1i both delayed the development of and reduced the frequency with which cultures acquired G12Ci resistance.

Update of

References

    1. Prior IA, Hood FE, Hartley JL. The Frequency of Ras Mutations in Cancer. Cancer Res 2020;80:2969–74 - PMC - PubMed
    1. Gridelli C, Rossi A, Carbone DP, Guarize J, Karachaliou N, Mok T, et al. Non-small-cell lung cancer. Nat Rev Dis Primers 2015;1:15009. - PubMed
    1. Awad MM, Liu S, Rybkin II, Arbour KC, Dilly J, Zhu VW, et al. Acquired Resistance to KRASG12C Inhibition in Cancer. New England Journal of Medicine 2021;384:2382–93 - PMC - PubMed
    1. Ostrem JM, Peters U, Sos ML, Wells JA, Shokat KM. K-Ras(G12C) inhibitors allosterically control GTP affinity and effector interactions. Nature 2013;503:548–51 - PMC - PubMed
    1. Janes MR, Zhang J, Li LS, Hansen R, Peters U, Guo X, et al. Targeting KRAS Mutant Cancers with a Covalent G12 C-Specific Inhibitor. Cell 2018;172:578–89 e17 - PubMed

MeSH terms