. 2024 Dec:26:100567.
doi: 10.1016/j.ijpddr.2024.100567. Epub 2024 Oct 13.

Yeast-based assay to identify inhibitors of the malaria parasite sodium phosphate uptake transporter as potential novel antimalarial drugs

Affiliations

Yeast-based assay to identify inhibitors of the malaria parasite sodium phosphate uptake transporter as potential novel antimalarial drugs

Joseph M Sweeney et al. Int J Parasitol Drugs Drug Resist. 2024 Dec.

Abstract

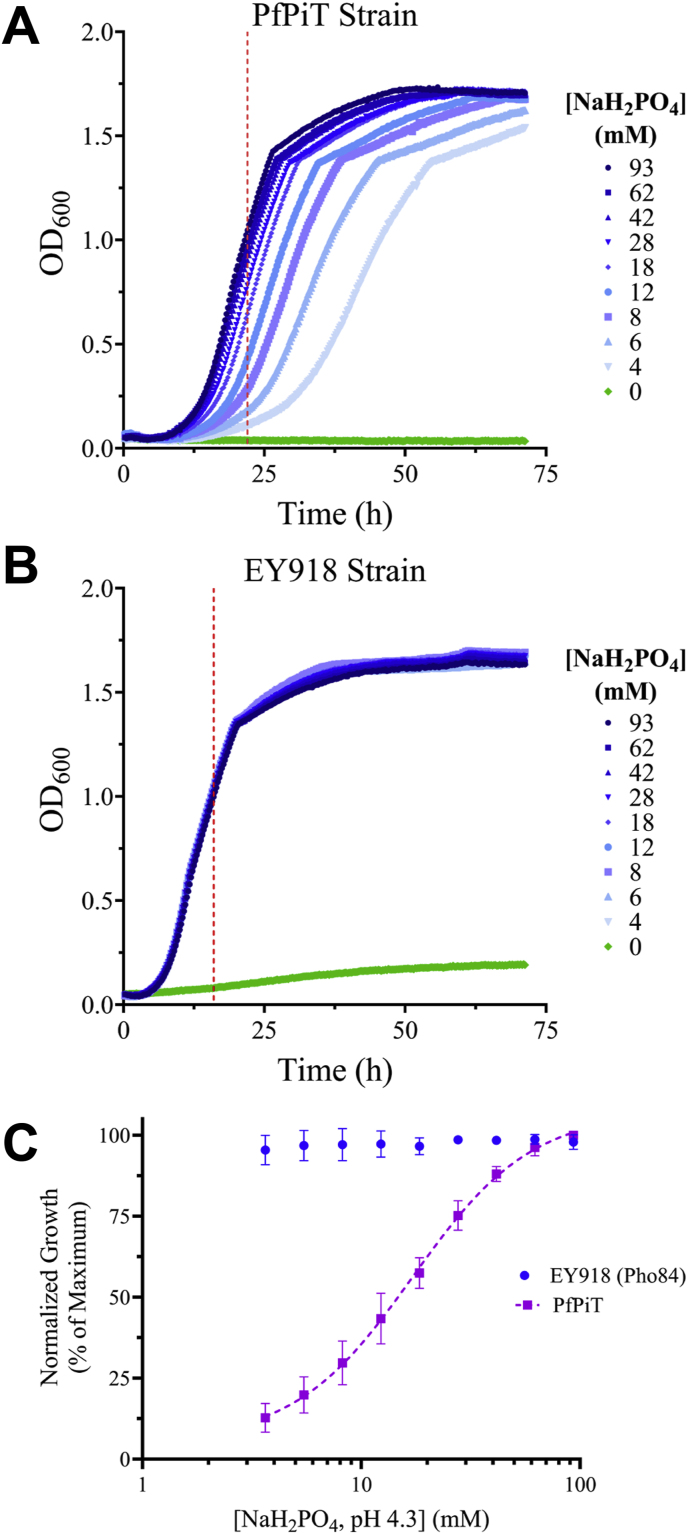
Malaria affects almost 250 million people annually and continues to be a significant threat to global public health. Infection with protozoan parasites from the genus Plasmodium causes malaria. The primary treatment for malaria is artemisinin-based combination therapies (ACTs). The spread of ACT-resistant parasites has undermined efforts to control and eradicate malaria. Thus, it is crucial to identify new targets for the development of novel antimalarial drugs. Phosphate is an essential nutrient for all cells. The Plasmodium falciparum genome encodes a single sodium-coupled inorganic phosphate transporter named PfPiT that is essential for parasite proliferation in the asexual blood stage. Thus, PfPiT inhibitors may be promising antimalarial drugs. Like Plasmodium, yeast requires phosphate to grow. We developed a Saccharomyces cerevisiae based growth assay to identify inhibitors of PfPiT. Genome editing was used to create a yeast strain where PfPiT was the only phosphate transporter. Using a radioactive [32P]phosphate uptake assay, the measured phosphate Km for PfPiT in yeast was 56 ± 7 μM in 1 mM NaCl at pH 7.4. The Km decreased to 24 ± 3 μM in 25 mM NaCl consistent with it being a Na+ coupled cotransporter. Conditions under which yeast growth was dependent on phosphate uptake mediated by PfPiT were identified and a 22-h growth assay was developed to screen for PfPiT inhibitors. In a screen of 21 compounds, two compounds were identified that inhibited the growth of the PfPiT strain but not that of the parental strain expressing Pho84, one of the five endogenous yeast phosphate transporters. Radioactive phosphate uptake experiments confirmed inhibition of phosphate uptake by the two compounds. The growth inhibition assay provides a simple and inexpensive approach to screen a large compound library for PfPiT inhibitors that may serve as starting points for the development of novel antimalarial drugs.

Keywords: Assay development; Drug discovery; Malaria; PfPiT; Plasmodium falciparum; Sodium phosphate cotransporters.


Conflict of interest statement

Declaration of competing interest The authors report no conflicts of interest relevant to this manuscript.

Figures

Image 1
Graphical abstract
Fig. 1
Fig. 1
Radiolabeled phosphate uptake characterization of the PfPiT and EY918 strains. 32Pi uptake was measured after a 10-min incubation in 10 mM Tris-succinate buffer. A: Phosphate concentration-dependent 32Pi uptake at pH 7.4 with 25 mM NaCl (filled symbols) or 1 mM NaCl (open symbols). Blue circles, EY918 strain; purple squares, PfPiT strain. Data was fit to a Michaelis-Menten non-linear regression model (GraphPad Prism). A single experiment with two technical replicates is shown, with each point representing mean ± SD. Mean apparent Km values from three biological replicates are reported in Table 1. B: pH-dependent 32Pi uptake with 25 mM NaCl and 1 mM KPO4. Blue circles, EY918 strain; Purple squares, PfPiT strain. 32Pi uptake is shown as the average of 4 biological replicates ± SD. Each biological replicate is an average of two technical replicates. Values on each graph were normalized to the maximum recorded CPM of each strain per trial. (For interpretation of the references to colour in this figure legend, the reader is referred to the Web version of this article.)
Fig. 2
Fig. 2
Phosphate concentration-dependent growth of the PfPiT and EY918 strains. The OD600 of cultures of A: the PfPiT strain and B: the parental EY918 strain were measured in a Bioscreen C machine every 15 min over several days with continuous linear shaking at 30 °C with 4 mM–93 mM NaH2PO4 in the media. The starting OD600 of both strains was 0.05. A: The PfPiT strain did not grow in the absence of phosphate (green symbols). The red dashed line indicates 22-h. B: The EY918 strain grew minimally with no phosphate in the media (green symbols). The red dashed line indicates 16-h. C: Phosphate-dependent growth for both strains was determined by measuring the OD600 after 22-h (PfPiT strain) or 16-h (EY918 strain) in a Bioscreen C machine. Data points were fit using an “[inhibitor] vs. response -variable slope” non-linear regression model (GraphPad Prism). All values were normalized to the maximum OD600 measured for each strain. A single experiment with two technical replicates is shown, with each point representing mean ± SD. Average EC50 values from three biological replicates are reported in Table 1. (For interpretation of the references to colour in this figure legend, the reader is referred to the Web version of this article.)
Fig. 3
Fig. 3
Characterization of the starting pH and added NaCl on PfPiT and EY918 strain growth. A: Starting media pH and B: NaCl-dependent growth was determined by measuring the culture OD600 after 22-h (PfPiT strain) or 16-h (EY918 strain) in a Bioscreen C machine, with starting OD600 = 0.05. The media contains 13 mM sodium at baseline, thus the X-axis in panel B does not represent total sodium concentration. Data was fit with an “[inhibitor] vs. response -variable slope” non-linear regression model (GraphPad Prism). All values were normalized to the maximum OD600 measured for each strain per panel. The mean of three biological replicates is shown, with each point representing mean ± SD.
Fig. 4
Fig. 4
Concentration-dependent inhibition of the PfPiT and EY918 strain growth and 32Pi uptake by PFA. PFA is a known pan-phosphate transporter inhibitor. A: Growth was determined by measuring the culture OD600 after 22-h (PfPiT strain) or 16-h (EY918 strain) in a stationary 30 °C incubator. B: 32Pi uptake was measured over 10 min in 10 mM Tris-succinate buffer, pH 7.4 with 25 mM NaCl and 5 μM KPO4. Data points for all panels were fit using “[inhibitor] vs. response -variable slope” non-linear regression model (GraphPad Prism). All values were normalized to either the maximum OD600 or CPM measurement per strain. The mean of three biological replicates is shown, with each point representing mean ± SD. The mean IC50 values are reported in Table 2.
Fig. 5
Fig. 5
Twenty-one compound PfPiT strain growth inhibition screen. A screening assay based on yeast growth was completed with the A: PfPiT strain, B: EY918 Strain. Growth for all strains was determined by measuring the culture OD600 after 22-h (PfPiT strain) or 16-h (EY918 strain) in a stationary 30 °C incubator. The data was normalized to the growth of the negative control for each strain, which did not have added compounds. JS14 (3-NPA) and JS21 (potassium acetate) were selected as hits and further analyzed (Fig. 6). The bar graph shows the mean ± SD of 3–5 biological replicates, with each dot representing the average of two technical replicates. Concentrations used for each compound are listed in the methods section. The structures, CAS No., chemical names, and concentrations of each compound are listed in Table S5.
Fig. 6
Fig. 6
Concentration-dependent PfPiT and EY918 strain growth and 32Pi uptake inhibition by 3-NPA and potassium acetate. 3-NPA and potassium acetate were hits selected from the inhibitor screen (Fig. 5). Concentration-dependent growth inhibition by A: 3-NPA, and C: potassium acetate was determined by measuring the culture OD600 after 22-h (PfPiT strain) or 16-h (EY918 strain) in a stationary 30 °C incubator. Concentration-dependent 32Pi uptake inhibition by B: 3-NPA and, D: potassium acetate was measured over 10 min in 10 mM Tris-succinate buffer, pH 7.4 with 25 mM NaCl and 5 μM KPO4. Data points for all panels were fit using “[inhibitor] vs. response -variable slope” non-linear regression model (GraphPad Prism). All values were normalized to either the maximum OD600 or CPM measurement per strain. The mean of three biological replicates is shown, with each point representing mean ± SD. The mean IC50 values are reported in Table 2.

References

    1. Auesukaree C., Homma T., Kaneko Y., Harashima S. Transcriptional regulation of phosphate-responsive genes in low-affinity phosphate-transporter-defective mutants in Saccharomyces cerevisiae. Biochem. Biophys. Res. Commun. 2003;306:843–850. - PubMed
    1. Balikagala B., Fukuda N., Ikeda M., Katuro O.T., Tachibana S.I., Yamauchi M., Opio W., Emoto S., Anywar D.A., Kimura E., Palacpac N.M.Q., Odongo-Aginya E.I., Ogwang M., Horii T., Mita T. Evidence of artemisinin-resistant malaria in Africa. N. Engl. J. Med. 2021;385:1163–1171. - PubMed
    1. Brunton L.L., Knollmann B.C. fourteenth ed., fourteenth ed. McGraw Hill Education; New York: 2023. Goodman & Gilman's the Pharmacological Basis of Therapeutics.
    1. Bun-Ya M., Nishimura M., Harashima S., Oshima Y. The PHO84 gene of Saccharomyces cerevisiae encodes an inorganic phosphate transporter. Mol. Cell Biol. 1991;11:3229–3238. - PMC - PubMed
    1. Dallaire L., Béliveau R. Phosphate transport by capillaries of the blood-brain barrier. J. Biol. Chem. 1992;267:22323–22327. - PubMed

Publication types

MeSH terms

LinkOut - more resources