

Relationship between MRI brain-age heterogeneity, cognition, genetics and Alzheimer's disease neuropathology
- PMID: 39437659
- PMCID: PMC11536027
- DOI: 10.1016/j.ebiom.2024.105399
Relationship between MRI brain-age heterogeneity, cognition, genetics and Alzheimer's disease neuropathology
Abstract
Background: Brain ageing is highly heterogeneous, as it is driven by a variety of normal and neuropathological processes. These processes may differentially affect structural and functional brain ageing across individuals, with more pronounced ageing (older brain age) during midlife being indicative of later development of dementia. Here, we examined whether brain-ageing heterogeneity in unimpaired older adults related to neurodegeneration, different cognitive trajectories, genetic and amyloid-beta (Aβ) profiles, and to predicted progression to Alzheimer's disease (AD).
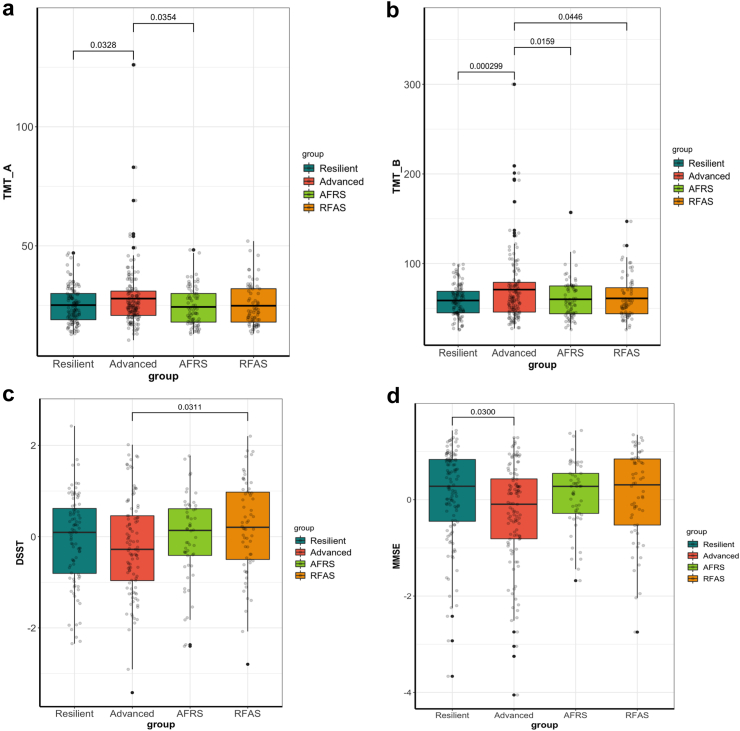
Methods: Functional and structural brain age measures were obtained for resting-state functional MRI and structural MRI, respectively, in 3460 cognitively normal individuals across an age range spanning 42-85 years. Participants were categorised into four groups based on the difference between their chronological and predicted age in each modality: advanced age in both (n = 291), resilient in both (n = 260) or advanced in one/resilient in the other (n = 163/153). With the resilient group as the reference, brain-age groups were compared across neuroimaging features of neuropathology (white matter hyperintensity volume, neuronal loss measured with Neurite Orientation Dispersion and Density Imaging, AD-specific atrophy patterns measured with the Spatial Patterns of Abnormality for Recognition of Early Alzheimer's Disease index, amyloid burden using amyloid positron emission tomography (PET), progression to mild cognitive impairment and baseline and longitudinal cognitive measures (trail making task, mini mental state examination, digit symbol substitution task).
Findings: Individuals with advanced structural and functional brain-ages had more features indicative of neurodegeneration and they had poor cognition. Individuals with a resilient brain-age in both modalities had a genetic variant that has been shown to be associated with age of onset of AD. Mixed brain-age was associated with selective cognitive deficits.
Interpretation: The advanced group displayed evidence of increased atrophy across all neuroimaging features that was not found in either of the mixed groups. This is in line with biomarkers of preclinical AD and cerebrovascular disease. These findings suggest that the variation in structural and functional brain ageing across individuals reflects the degree of underlying neuropathological processes and may indicate the propensity to develop dementia in later life.
Funding: The National Institute on Aging, the National Institutes of Health, the Swiss National Science Foundation, the Kaiser Foundation Research Institute and the National Heart, Lung, and Blood Institute.
Keywords: Ageing; Alzheimer’s disease; Brain age; Cognition; Multimodal.
Copyright © 2024 The Authors. Published by Elsevier B.V. All rights reserved.
Conflict of interest statement
Declaration of interests TB has received investigator-initiated research awards from the NIH, the Alzheimer’s Association, the Foundation at Barnes-Jewish Hospital, Siemens Healthineers, Hyperfine and Avid Radiopharmaceuticals (a wholly-owned subsidiary of Eli Lilly and Company). She participates as a site investigator in clinical trials sponsored by Eli Lilly and Company, Biogen, Eisai, Jaansen, and Roche. She has served as a paid and unpaid consultant to Eisai, Siemens, Biogen, Janssen, Hyperfine, Merck Lilly, and Bristol-Myers Squibb. JCM has served as a paid consultant to the Barcelona Brain Research Center and the Native Alzheimer Disease-related Resource Center in Minority Aging Research. He also received payments for presentations at the AAIM meeting, Longer Life Foundation and the International Brain Health Symposium. JCM has received travel support to attend meetings including: AAIM, DIAN, AD/PD, ATRI/ADNI, ADRC, ADC, the International conference on Health Aging & Biomarkers and the International Brain Health Symposium. He has served on the advisory board for the Cure Alzheimer’s Fund and LEADS at Indiana University. IMN has received payments from Premier, Inc for participating in an advisory board, from Peerview for an educational talk, and from Subtle Medical, Inc for consulting. DW has served as a paid consultant to Qynapse, Beckman Coulter and Eli Lilly. He also received grants from the NIH and Biogen paid to his institution and received travel support from the Alzheimer's Association. SR is an NIA IRP employee and has served on the advisory board of Dementia Platforms, UK, the Canadian Consortium on Neurodegeneration in Aging and the Adult Aging Brain Connectome. She has received travel support from the McKnight Foundation to attend an annual meeting.
Figures


References
-
- Geerligs L., Renken R.J., Saliasi E., Maurits N.M., Lorist M.M. A brain-wide study of age-related changes in functional connectivity. Cereb Cortex. 2015;25(7):1987–1999. - PubMed
MeSH terms
Substances
Grants and funding
LinkOut - more resources
Full Text Sources
Medical
