. 2024 Dec:58:101075.
doi: 10.1016/j.neo.2024.101075. Epub 2024 Oct 21.

RRM2 inhibition alters cell cycle through ATM/Rb/E2F1 pathway in atypical teratoid rhabdoid tumor

Affiliations

RRM2 inhibition alters cell cycle through ATM/Rb/E2F1 pathway in atypical teratoid rhabdoid tumor

Le Hien Giang et al. Neoplasia. 2024 Dec.

Abstract

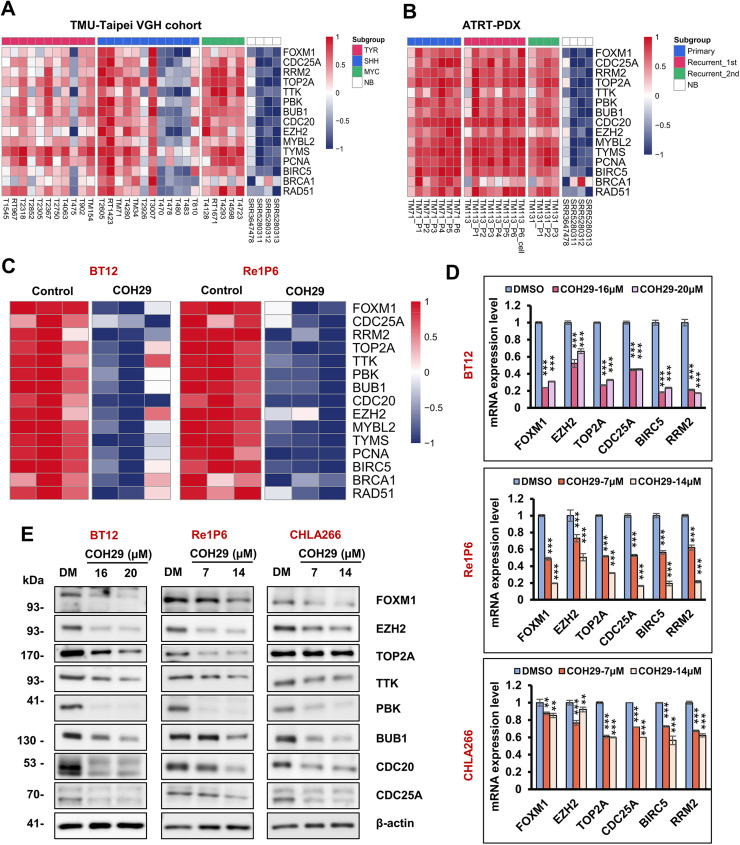
Background: Atypical teratoid rhabdoid tumor (ATRT) is an aggressive brain tumor that mainly affects young children. Our recent study reported a promising therapeutic strategy to trigger DNA damage, impede homologous recombination repair, and induce apoptosis in ATRT cells by targeting ribonucleotide reductase regulatory subunit M2 (RRM2). COH29, an inhibitor of RRM2, effectively reduced tumor growth and prolonged survival in vivo. Herein, we explored the underlying mechanisms controlling these functions to improve the clinical applicability of COH29 in ATRT.

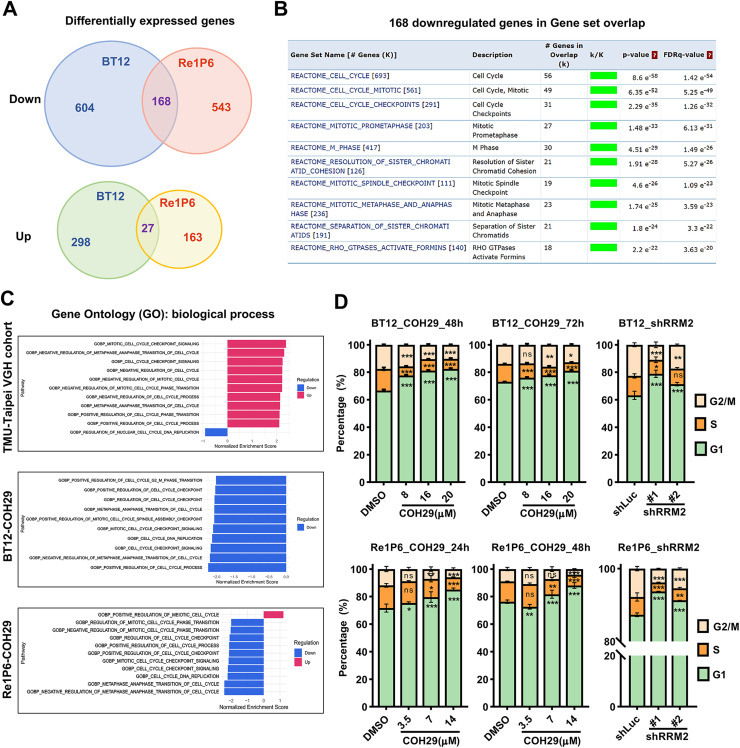
Methods: Molecular profiling of ATRT patients and COH29-treated cells was analyzed to identify the specific signaling pathways, followed by validation using a knockdown system, flow cytometry, q-PCR, and western blot.

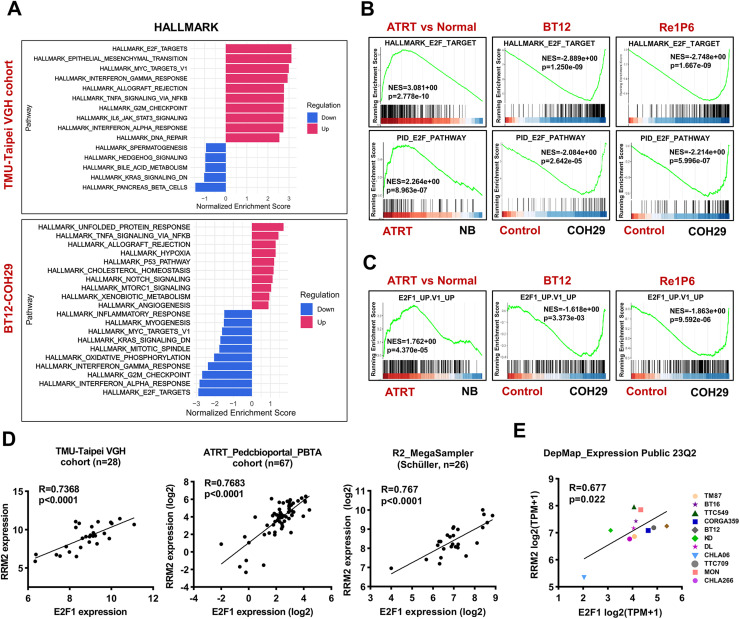
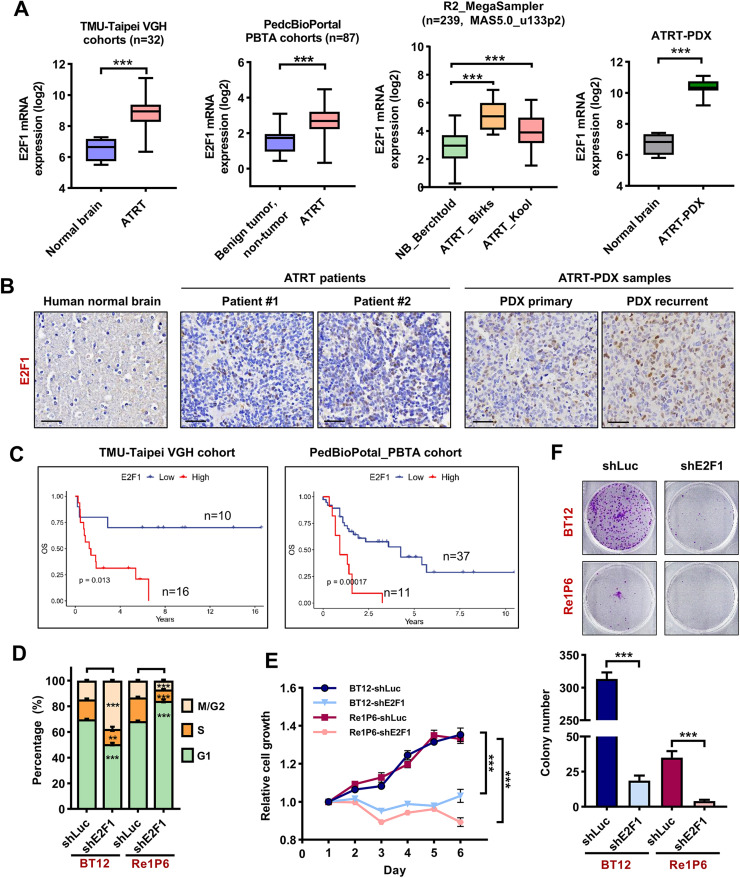
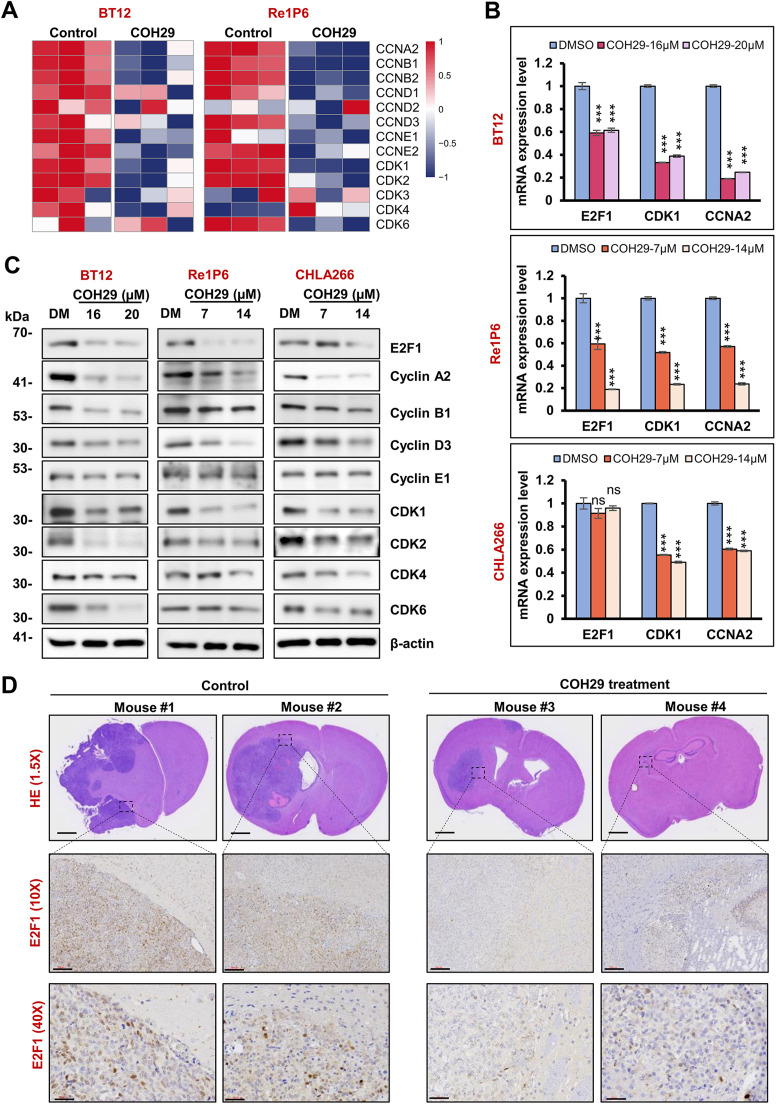
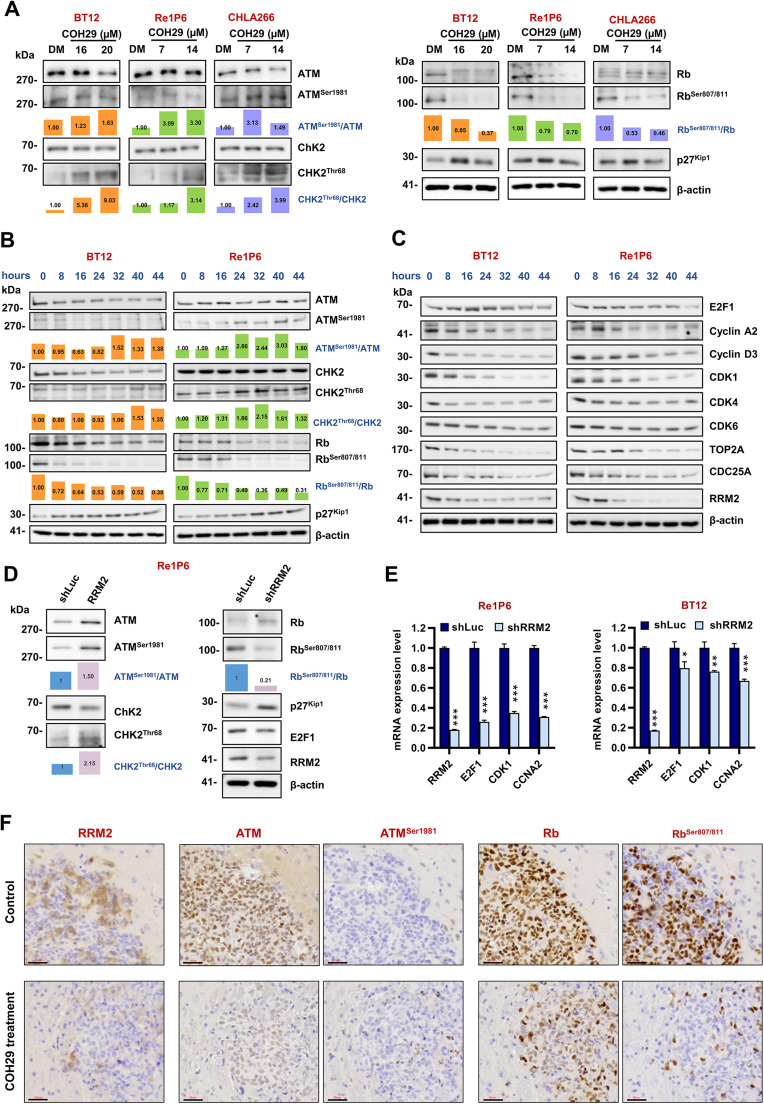
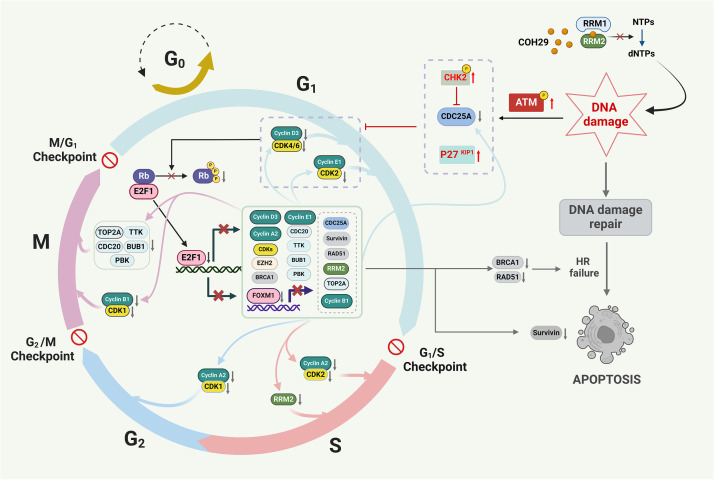
Results: Elevated E2F1 and its signaling pathway were correlated with poor prognosis. RRM2 inhibition induced DNA damage and activated ATM, which reduced Rb phosphorylation to promote Rb-E2F1 interaction and hindered E2F1 functions. E2F1 activity suppression led to decreased E2F1-dependent target expressions, causing cell cycle arrest in the G1 phase, decreased S phase cells, and blocked DNA damage repair.

Conclusion: Our study highlights the role of ATM/Rb/E2F1 pathway in controlling cell cycle arrest and apoptosis in response to RRM2 inhibition-induced DNA damage. This provides insight into the therapeutic benefits of COH29 and suggests targeting this pathway as a potential treatment for ATRT.

Keywords: ATM/Rb/E2F1; ATRT; COH29; Cell cycle; RRM2.


Conflict of interest statement

Declaration of competing interest The authors declare that they have no known competing financial interests or personal relationships that could have appeared to influence the work reported in this paper.

Figures

Fig 1
Fig. 1
RRM2 inhibition alters ATRT cell cycle. A Venn diagram of significant DEGs found in BT12 and Re1P6 samples treated with COH29 versus control (DMSO 0.1 %). Genes found at the center intersection are indicated as overlap genes. Cut-off threshold: log2Foldchange >1, p-adjust <0.05. B Gene set enrichment analysis (GSEA) of the top 10 enriched pathways using 168 downregulated overlap genes of DEGs found in COH29-treated BT12 and Re1P6 cells. Data was analyzed on https://www.gsea-msig. FDR: false discovery rate. C GSEA of TMU-Taipei VGH cohort and two cell lines treated with COH29 in terms of normalized enrichment score (NES). Gene set collections of GO biological process were analyzed with top 10 upregulated and top 10 downregulated gene sets. D Statistics of the cell cycle distribution in COH29-treated cells and RRM2 knockdown cells with the controls. Cells were treated with different doses of COH29 in 24 and 48 h (Re1P6) or 48 and 72h (BT12). Data are described as the mean plus standard deviation (SD) from triplicate independent experiments. Two-way ANOVA, Dunnett's multiple comparisons test, ns represents non-significant, *p < 0.05, **p < 0.01, ***p < 0.001.
Fig 2
Fig. 2
COH29 treatment suppresses E2F pathway and the positive correlation between RRM2 and E2F1 in ATRT. A GSEA of TMU-Taipei VGH cohort and BT12 cell line treated with COH29 in terms of normalized enrichment score (NES). HALLMARK gene set collections were analyzed with top 10 upregulated and top 10 downregulated gene sets. B, C Normalize enrichment score of the HALLMARK_E2F_TARGET, PID_E2F_PATHWAY (B) and E2F1_UP.V1_UP (C) gene sets in ATRT samples and COH29-treated cells (BT12, Re1P6). Normal brain (NB) or 0.1 % DMSO treatment samples were used as controls. D Pearson correlation test between the RNA expression level of E2F1 and RRM2 in human TMU-Taipei VGH cohort (n = 28), PedcBioPortal_PBTA_cohort (n = 67), R2_MegaSampler Schüller cohort (n = 26). RNA expression was normalized using logarithm base 2. E The correlation of mRNA gene expression between RRM2 and E2F1 in eleven ATRT cell lines. Data were analyzed from the project Expression Public 23Q2 dataset (DepMap). TPM expression values of protein-coding genes for DepMap cell lines are reported after log2 transformation and inferred from RNA-seq data using the RSEM tool with a pseudo-count of 1 (log2(TPM+1)).
Fig 3
Fig. 3
High expression of E2F1 correlated with poor survival of ATRT. A Expression levels of E2F1 mRNA in human ATRT and normal brain tissues/benign tumor, non-tumor in TMU-Taipei VGH cohort (n = 32), PedcBioPortal_PBTA_cohorts (n = 87), cohorts in R2 platform (n = 239), and ATRT-PDX sample (n = 23). Bar indicates the mean mRNA levels of each group; data are presented as min to max, Tukey's multiple comparisons test, ***p < 0.001. RNA expression was normalized using logarithm base 2. B Comparison of IHC staining for E2F1 in the normal brain, human ATRT, and ATRT-PDX samples. Scale bar 30 µm. C The correlation of E2F1 mRNA level with patient's overall survival (OS) in TMU-Taipei VGH cohort (n = 26) and PBTA cohort from PedcBioPortal (n = 48). D Statistics of the cell cycle distribution in E2F1 knockdown cells compared with the controls. E, F Knockdown E2F1 attenuates cell growth (E) and colony formation abilities (F) in BT12 and Re1P6 cells. Statistical significance was calculated by Two-way ANOVA, Dunnett's multiple comparisons test (cell cycle assay), and Student's t-test (cell growth and colony formation assay). All data are shown as means ± SD and performed as technical triplicates. *p < 0.05, **p < 0.01, ***p < 0.001, ns represents non-significant.
Fig 4
Fig. 4
COH29 treatment suppressed the expression of cyclins and CDKs in ATRT. A Heatmap represents the expression of cyclins and CDKs in BT12 and Re1P6 cells treated with COH29 versus control. B qRT-PCR validation of E2F1, CDK1, and CCNA2 mRNA in three ATRT cell lines treated with different concentrations of COH29 compared with control. Data are described as means ± SD from triplicate independent experiments, ns represents non-significant, ***p < 0.001, Student t-test. C Immunoblotting for E2F1, cyclin, CDK markers in COH29-treated cells. BT12, Re1P6, and CHLA266 cells treated with DMSO (DM) or COH29 in 72 h (BT12) and 48 h (Re1p6, CHLA266), respectively. In all experiments, 0.1 % DMSO treatment was used as a control. D HE staining shows the size and position of the tumor in the ATRT-orthotopic mouse brain. IHC staining detects the expression of E2F1 in the ATRT xenograft brain tumor. Scale bar, from top-middle-bottom panels: 700 µm-100 µm-30 µm.
Fig 5
Fig. 5
COH29 treatment suppressed the expression of E2F1-dependent target genes in ATRT. A, B Heatmaps represent the expression of E2F1-dependent target genes in ATRT Taipei-VGH cohort (A) and ATRT-PDX (B) samples compared with normal brain tissues. C Heatmap represents the expression of E2F1-dependent target genes in BT12 and Re1P6 COH29-treated cells versus control. D qRT-PCR validation of FOXM1, EZH2, TOP2A, CDC25A, BIRC5, and RRM2 mRNA in three ATRT cells treated with different concentrations of COH29 compared with control. Data are described as means ± SD from triplicate independent experiments, **p < 0.01, ***p < 0.001, Student t-test. E Immunoblotting for E2F-dependent target genes in BT12, Re1P6, and CHLA266 cells treated with DMSO (DM) or COH29 in 72 h (BT12) and 48 h (Re1P6, CHLA266). In all experiments, 0.1 % DMSO treatment was used as a control.
Fig 6
Fig. 6
COH29 treatment alters ATRT cell cycle via ATM/Rb/E2F1 signaling pathway. A Immunoblotting of proteins that regulate E2F1 pathway in BT12, Re1P6, and CHLA266 cells treated with different doses of COH29: BT12 treated with 16 and 20 µM COH29 in 72 h, Re1P6 and CHLA266 treated with 7 and 14 µM COH29 in 48 h. B, C The time course expression level of proteins that regulate the E2F1 pathway (B), or E2F1-dependent target genes (C) in ATRT cells treated with COH29 in different time points: 0-8-16-24-32-40-44 h. BT12 and Re1P6 cells were treated with COH29 20 µM and 14 µM, respectively. D Immunoblotting of proteins that regulate ATM/Rb/E2F1 pathway in Re1P6 cells treated with shRRM2 or shLuc. The bar graph presents the relative expression between the protein and its phosphorylated form calculated from the displayed images. The protein expression levels were quantified using ImageJ software. The relative expression was normalized with control 0.1 % DMSO, 0 h treatment, or shLuc. E qRT-PCR validation of RRM2, E2F1, CDK1, and CCNA2 mRNA in Re1P6 and BT12 cells treated with shRRM2 compared with control shLuc. Data are described as means ± SD from triplicate independent experiments, *p < 0.05, **p < 0.01, ***p < 0.001, Student t-test. F IHC staining detects the expression of RRM2, ATM, ATMSer1981, Rb, and RbSer807/811 in the ATRT xenograft brain tumor. Scale bar 30 µm.
Fig 7
Fig. 7
The proposed schematic illustrates the COH29 treatment induces DNA damage, alters cell cycle, and activates apoptosis via ATM/Rb/E2F1 axis in ATRT Firstly, COH29 treatment induces DNA damage in ATRT cells and activates ATM protein phosphorylation. Secondly, the phosphorylation of ATM protein regulates other proteins that are responsible for preventing Rb phosphorylation. Then, protein Rb inhibits the activity of the transcription factor E2F1. This ultimately leads to the blocking of the expression of several E2F-dependent targets. Finally, the E2F-dependent targets will alter the cell cycle, which results in the prevention of HR repair and triggers apoptosis.

References

    1. Hilden JM, Meerbaum S, Burger P, Finlay J, Janss A, Scheithauer BW, et al. Central nervous system atypical teratoid/rhabdoid tumor: results of therapy in children enrolled in a registry. J. Clin. Oncol. 2004;22(14):2877–2884. - PubMed
    1. Fruhwald MC, Biegel JA, Bourdeaut F, Roberts CW, Chi SN. Atypical teratoid/rhabdoid tumors-current concepts, advances in biology, and potential future therapies. Neuro. Oncol. 2016;18(6):764–778. - PMC - PubMed
    1. Alva E, Rubens J, Chi S, Rosenberg T, Reddy A, Raabe EH, et al. Recent progress and novel approaches to treating atypical teratoid rhabdoid tumor. Neoplasia. 2023;37 - PMC - PubMed
    1. Matthews HK, Bertoli C, de Bruin RAM. Cell cycle control in cancer. Nat. Rev. Mol. Cell Biol. 2022;23(1):74–88. - PubMed
    1. Branzei D, Foiani M. Regulation of DNA repair throughout the cell cycle. Nat. Rev. Mol. Cell Biol. 2008;9(4):297–308. - PubMed

Publication types

MeSH terms

Substances