. 2025 Feb 6;74(3):364-386.
doi: 10.1136/gutjnl-2023-330390.

IQGAP3 signalling mediates intratumoral functional heterogeneity to enhance malignant growth

Affiliations

IQGAP3 signalling mediates intratumoral functional heterogeneity to enhance malignant growth

Mitsuhiro Shimura et al. Gut. .

Abstract

Background: The elevation of IQGAP3 expression in diverse cancers indicates a key role for IQGAP3 in carcinogenesis. Although IQGAP3 was established as a proliferating stomach stem cell factor and a regulator of the RAS-ERK pathway, how it drives cancer growth remains unclear.

Objective: We define the function of IQGAP3 in gastric cancer (GC) development and progression.

Design: We studied the phenotypic changes caused by IQGAP3 knockdown in three molecularly diverse GC cell lines by RNA-sequencing. In vivo tumorigenesis and lung metastasis assays corroborated IQGAP3 as a mediator of oncogenic signalling. Spatial analysis was performed to evaluate the intratumoral transcriptional and functional differences between control tumours and IQGAP3 knockdown tumours.

Results: Transcriptomic profiling showed that IQGAP3 inhibition attenuates signal transduction networks, such as KRAS signalling, via phosphorylation blockade. IQGAP3 knockdown was associated with significant inhibition of MEK/ERK signalling-associated growth factors, including TGFβ1, concomitant with gene signatures predictive of impaired tumour microenvironment formation and reduced metastatic potential. Xenografts involving IQGAP3 knockdown cells showed attenuated tumorigenesis and lung metastasis in immunodeficient mice. Accordingly, immunofluorescence staining revealed significant reductions of TGFβ/SMAD signalling and αSMA-positive stromal cells; digital spatial analysis indicated that IQGAP3 is indispensable for the formation of two phenotypically diverse cell subpopulations, which played crucial but distinct roles in promoting oncogenic functions.

Conclusion: IQGAP3 knockdown suppressed the RAS-TGFβ signalling crosstalk, leading to a significant reduction of the tumour microenvironment. In particular, IQGAP3 maintains functional heterogeneity of cancer cells to enhance malignant growth. IQGAP3 is thus a highly relevant therapy target in GC.

Keywords: carcinogenesis; signal transduction.


Conflict of interest statement

Competing interests: None declared.

Figures
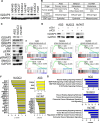
Figure 1
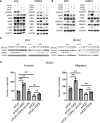
Figure 1. IQGAP3 depletion results in a dramatic decrease in cell sensitivity to growth factors. (A) Western blot analysis (WB) of IQGAP3 in gastric cancer cell lines. GAPDH served as loading control. (B) Major characteristics of AGS, NUGC3 and Hs746T. (C) WB showing differential expression of IQGAP paralogs, EPCAM, VIM, pERK, ERK, pSMAD3 and SMAD3 in AGS, NUGC3 and Hs746T. GAPDH served as loading control. (D) WB of AGS, NUGC3 and Hs746T cells following siRNA-mediated IQGAP3 (siIQ3) knockdown. (E) GSEA showing enrichment of KRAS signalling in siCtrl of AGS, NUGC3 and Hs746T cell lines, TGFβ signalling in shCtrl of AGS and NUGC3, and epithelial-mesenchymal transition in siCtrl of NUGC3 and Hs746T (the data of NUGC3 was shown in online supplemental figure S1A. All gene sets showed normalised p value <0.05. (F) Upstream regulator analysis by ingenuity pathway analysis (IPA) showed significantly inhibited growth factors in siIQ3 knockdown cells compared with control cells. The yellow bars indicate growth factors that activate MEK/ERK signalling, and the grey bars indicate growth factors that do not activate MEK/ERK signalling. All growth factors showed p value <0.05. (G) Canonical pathway analysis by IPA showing significantly inhibited signalling pathways after siIQ3 knockdown. All pathways showed p value <0.05. FDR, false discovery rate; GSEA, gene set enrichment analysis; NES, normalised enrichment score.
Figure 2
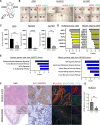
Figure 2. IQGAP3 regulates critical phosphorylation events in RAS/MEK/ERK and TGFβ1 signalling to influence invasion and migration. (A) Western blot analysis (WB) in AGS and NUGC3 showing the effects of siRNA-mediated IQGAP3 knockdown (siIQ3) on EGF (20 ng/mL)-induced phosphorylation of MEK, ERK and AKT. GAPDH served as a loading control. p, phospho. (B) WB analysis in AGS and NUGC3 showing the effects of siIQ3 knockdown on TGFβ1 (5 ng/mL)-induced phosphorylation of ERK and SMAD3. GAPDH served as a loading control. p, phospho. (C) WB showing time-dependent changes in AGS and NUGC3 after siIQ3 knockdown and TGFβ1 (5 ng/mL). (D) Transwell invasion and migration assays of NUGC3 subjected to shRNA-mediated knockdown of IQGAP3 and TGFβ1 (5 ng/mL) (n=3 independent experiments/group). Ns, not significant; *p<0.05, **p<0.01; ***p<0.001; ****p<0.0001. Error bars represent SD.
Figure 3
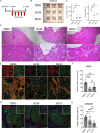
Figure 3. IQGAP3 depletion impairs tumorigenesis and the formation of the tumour microenvironment in subcutaneous tumour mouse model. (A) Schematic diagram of subcutaneous injection of cancer cells in NOD.Cg-Prkdcscid ll2rgtm1Wjl/SzJ; NOD scid gamma (NSG) mouse. Gastric cancer cells harbouring shRNA control (shCtrl) were injected at the right flank of a mouse, and cells with shRNA-mediated knockdown of IQGAP3 (shIQ3) were injected at the left flank of a mouse at the same time. (B) The picture of subcutaneous tumours from AGS, NUGC3 and Hs746T shCtrl (right, green-circled) and shIQ3 (left, red-circled) (AGS; n=7, NUGC3; n=9, Hs746T; n=6 mice, the picture showed six tumours each). (C) Statistical analysis for the tumour volumes of shCtrl and shIQ3 from AGS, NUGC3 and Hs746T (AGS; n=7, NUGC3; n=9, Hs746T; n=6 mice). (D) Upstream regulator analysis by ingenuity pathway analysis (IPA) showing significantly inhibited growth factors in NUGC3 shIQ3 tumours compared with NUGC3 shCtrl tumours. Yellow bars indicate growth factors that activate MEK/ERK signalling, and grey bars indicate growth factors that do not activate MEK/ERK signalling. All growth factors showed p value <0.05. (E) Canonical pathway analysis by IPA showing significantly inhibited signalling pathways in NUGC3 shIQ3 tumours compared with NUGC3 shCtrl tumours. All pathways showed p value <0.05. (F) H&E, immunohistochemistry (IHC) for IQGAP3 and immunofluorescence (IF) staining of NUGC3 shCtrl and shIQ3 tumours. IF imaging shows intratumoral αSMA-positive stromal cells. The majority of αSMA-positive stromal cells in shCtrl tumours expressed VIM. Black scale bar in H&E, 200 µm. Black scale bar in IHC, 50 µm. White scale bar in IF, 50 µm. (G) Statistical analysis of the intratumoral αSMA-positive areas in NUGC3 subjected to shCtrl or shIQ3 (n=5 different fields from three different tumours per group). Ns, not significant; *p<0.05, **p<0.01; ***p<0.001; ****p<0.0001. Error bars represent SD.
Figure 4
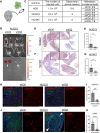
Figure 4. IQGAP3 depletion disrupts the production of Tgfb1 in mouse stromal cells. (A, B) Co-in situ hybridisation (co-ISH, RNAscope) together with immunofluorescence (IF) staining showing human TGFB1 (red dots), which are overlapped with PanCK-positive cells, in shRNA control (shCtrl) and shIQGAP3 knockdown (shIQ3) tumours (n=3 tumours/group). White scale bar, 500 µm. (C, D) Co-ISH together with IF staining showing mouse Tgfb1 (red dots), which are overlapped with PanCK-negative cells, in shCtrl and shIQ3 tumours (n=3 tumours/group). White scale bar, 500 µm. (E) Statistical comparison of TGFB1/Tgfb1 between human cancer cells and mouse stromal cells using transcripts per million (TPM) from bulk RNA-sequence. (F) Quantitative PCR for Tgfb1 from mouse stromal cells of tumours derived from NUGC3 subjected to shCtrl or shIQ3 (n=3 tumours/group). (G) IF staining for TGFB1, pSMAD3, E-cadherin (E-cad) and 4′,6-diamidino-2-phenylindole (DAPI) on shCtrl and shIQ3 tumours. Scale bar, 50 µm. (H) Statistical comparison for nuclear pSMAD3 in human cancer cells and mouse stromal cells in shCtrl and shIQ3 tumours (n=5 different fields from three different tumours per group). Ns, not significant; *p<0.05, **p<0.01; ***p<0.001; ****p<0.0001. Error bars represent SD.
Figure 5
Figure 5. Inhibition of KRAS and TGFβ1 signalling results in the significant reduction of αSMA-positive stromal cells in vivo. (A) Schematic diagram of treatments after subcutaneous injection of cancer cells in NOD.Cg-Prkdcscid ll2rgtm1Wjl/SzJ; NOD scid gamma (NSG) mouse. Gastric cancer cell line, NUGC3, was injected into the back of a mouse. (B) Three subcutaneous tumours from NUGC3 treated with DMSO (n=3), U0126 (MEK1/2 inhibitor, n=3) and A83-01 (TGFBR1 inhibitor, n=3), respectively. (C) Statistical analysis for the tumour volumes and weights among NUGC3 treated with DMSO, U0126 and A83-01 (DMSO; n=3, U0126; n=3, A83-01; n=3 mice). (D) H&E staining of tumours from NUGC3 treated with DMSO, U0126 and A83-01. Black scale bar, 200 µm. White scale bar, 50 µm. (E) Immunofluorescence (IF) staining shows intratumoral αSMA-positive stromal cells. The majority of αSMA-positive stromal cells coexpressed with VIM. White scale bar, 50 µm. (F) Statistical analysis for the intratumoral αSMA-positive areas in NUGC3 subjected to DMSO, U0126 and A83-01 treatments (n=6 different fields from three different tumours per group). (G) IF staining for pSMAD3, E-cadherin and 4′,6-diamidino-2-phenylindole (DAPI) on NUGC3 subjected to DMSO, U0126 and A83-01 treatments. White scale bar, 50 µm. (H) Statistical comparison for nuclear pSMAD3 expression in cancer cells (n=6 different fields from three different tumours per group). Ns, not significant; *p<0.05, **p<0.01; ***p<0.001; ****p<0.0001. Error bars represent SD.
Figure 6
Figure 6. IQGAP3 depletion suppresses lung metastasis and tumour microenvironment formation. (A) Schematic diagram of a lung metastasis mouse model via tail vein injection. (B) In vivo imaging system (IVIS) imaging for the screening of whole bodies and lungs following mouse euthanasia. (C) Experimental approach of lung metastasis mouse model via tail vein injection of AGS, NUGC3 and Hs746T. (D) H&E staining of lung metastases in whole lungs 3 weeks after injecting NUGC3 shRNA control (shCtrl) and shIQGAP3 knockdown (shIQ3) cells into NOD.Cg-Prkdcscid ll2rgtm1Wjl/SzJ; NOD scid gamma (NSG) mice. Insets show enlarged images for lung metastasis. Scale bar. 200 µm. (E) Statistical comparison for the areas of all lung metastases/whole lungs derived from NUGC3 shCtrl and shIQ3 tumours (n=9 mice/group). (F) H&E staining of lung metastases 6 weeks after injecting Hs746T shCtrl and shIQ3 cells. Insets show enlarged images for lung metastasis. Scale bar, 200 µm. (G) Statistical comparison for the areas of all lung metastases/while lungs derived from Hs746T shCtrl and shIQ3 cells (n=7 mice in shCtrl, n=9 mice in shIQ3). (H) Immunofluorescence (IF) staining for pSMAD3, E-cadherin and 4′,6-diamidino-2-phenylindole (DAPI) on lung metastases from NUGC3 shCtrl and shIQ3 cells. Scale bar, 50 µm. (I) Statistical comparison for nuclear pSMAD3 expression in NUGC3 shCtrl and shIQ3 lung tumours (n=4 different fields from different tumours per group). (J) IF staining for αSMA, E-cadherin and DAPI in lung metastases derived from NUGC3 shCtrl and shIQ3 cells. White arrowheads indicate the border of lung metastasis. Scale bar, 50 µm. (K) Statistical analysis of the intratumoral αSMA-positive areas in NUGC3 shCtrl and shIQ3 lung metastases (n=16 shCtrl tumours, n=12 shIQ3 tumours). Ns, not significant; *p<0.05, **p<0.01; ***p<0.001; ****p<0.0001. Error bars represent SD.
Figure 7
Figure 7. Functional heterogeneity of Ki67-high and Ki67-low cells in IQGAP3 proficient and deficient tumours. (A) Overview of digital spatial analysis by GeoMx. Six different sample tissues from NUGC3 shRNA control (shCtrl) subcutaneous tumours (right, n=3) and NUGC3 shIQGAP3 knockdown (shIQ3) subcutaneous tumours (left, n=3) were located on one slide. Three regions of interest were selected from each tumour and divided into two areas of interest (AOIs) (PanCK-positive/Ki67-high and PanCK-positive/Ki67-low subpopulation). (B) Statistical comparison for Ki67 in human Protein between Ki67-high and Ki67-low subpopulation in shCtrl/shIQ3 tumours (n=9 AOIs/group). (C) Statistical comparison for MKI67 and IQGAP3 in human Whole-Transcriptome-Atlas (WTA) between Ki67-high and Ki67-low subpopulation in shCtrl/shIQ3 tumours (n=9 AOIs/group). (D) Scatter plot analysis of human WTA comparison between IQGAP3 and MKI67 in NUGC3 shCtrl. Black-dotted circle indicates Ki67-high cells with high IQGAP3 expression, while blue-dotted circle indicates cells with Ki67-low and IQGAP3-low expression in figure 6C. P value <0.0001. Scatter plot analysis (right) of human WTA comparison between IQGAP3 and MKI67 in NUGC3 shIQ3. P value <0.0001. X and Y axis showed expression level. (E) Immunofluorescence (IF) staining for IQGAP3 and Ki67 on subcutaneous tumours from NUGC3 shCtrl cells. Yellow arrowheads indicate IQGAP3 high regions, while white arrowheads indicate IQGAP3 low regions. IQGAP3 high regions in shCtrl tumours frequently contained Ki67-positive cells. Scale bar, 50 µm. Ns, not significant; *p<0.05, **p<0.01; ***p<0.001; ****p<0.0001. Error bars represent SD.
Figure 8
Figure 8. IQGAP3 confers different cell states to enhance oncogenic functions. (A) Schematic diagram of the intratumoral and group comparisons using human and mouse Whole Transcriptome Atlas (WTA). Gene set enrichment analysis (GSEA) was performed and enriched hallmark gene sets were indicated by colour intensity. All highlighted gene sets showed NOM p value <0.05 and FDR q value <0.01. (B) Statistical comparison and scatter plot analysis of human WTA comparison between IQGAP3 and LGALS3 mRNA in NUGC3 shRNA control (shCtrl) and shIQGAP3 knockdown (shIQ3) tumours, respectively. (C) Statistical comparison and scatter plot analysis of human WTA comparison between IQGAP3 and SOX9 mRNA, and between IQGAP3 and KLF5 mRNA in NUGC3 shCtrl and shIQ3 tumours, respectively. These circled subpopulations were equivalent to those in figure 6D. Scatter plot analysis of LGALS3, SOX9 and KLF5 in shCtrl, and LGALS3, and SOX9 in shIQ3 showed p value <0.05. X axis and Y axis showed expression level. FDR, false discovery rate; NES, normalised enrichment score; NOM, normalised; Ns, not significant; *p<0.05, **p<0.01; ***p<0.001; ****p<0.0001. Error bars represent SD.
Figure 9
Figure 9. Iqgap3 knockout suppresses Kras-induced metaplasia in the mouse stomach. (A) eR1-cre;KrasG12D/+ (KrasG12D);IQGAP3flox/flox (IQ3f/f);Rosa-tdTomato mouse model. (B) Representative images of H&E staining of eR1-cre;KrasG12D and eR1-cre;KrasG12D;IQ3f/f mouse stomach corpus. Scale bar, 50 µm. (C) Statistical analysis for the frequency of metaplasia in eR1-cre;KrasG12D (n=3) and eR1-cre;KrasG12D;IQ3f/f mouse stomach corpus (n=3) (p value <0.01). (D) Statistical analysis for the number of Ki67-positive cells per metaplasia in eR1-cre;KrasG12D (n=3) and eR1-cre;KrasG12D;IQ3f/f mouse stomach corpus (n=3) (p value <0.05). (E) Immunofluorescence (IF) staining for pERK, E-cadherin (E-cad), Ki67 and 4′,6-diamidino-2-phenylindole (DAPI) in eR1-cre;KrasG12D mice. Scale bar, 50 µm. (F) IF staining for Il33, E-cad and DAPI on metaplasia in eR1-cre;KrasG12D mice. Scale bar, 50 µm. (G) IF staining for pERK, E-cad, Ki67 and DAPI on in eR1-cre;KrasG12D;IQ3f/f mice. Scale bar, 50 µm. (H) IF staining for Il33, E-cad and DAPI on metaplasia in eR1-cre;KrasG12D;IQ3f/f mice. Scale bar, 50 µm. (I) IF staining for Acta2 and E-cad on stomachs from eR1-cre;KrasG12D and eR1-cre;KrasG12D;IQ3f/f mice. White arrowheads indicate Kras-induced enrichment of Acta2-positive fibroblasts around the metaplasia. Scale bar, 50 µm. (J) Statistical analysis for Acta2-positive fibroblast-enriched region around metaplasia (n=3 different fields/group). Ns, not significant; *p<0.05, **p<0.01; ***p<0.001; ****p<0.0001. Error bars represent SD.
Figure 10
Figure 10. Iqgap3 knockout suppresses the expression of metaplasia-associated genes Tff2, Cd44 and Sox9. (A) Immunofluorescence (IF) staining for Tff2, Cd44 and E-cadherin (E-cad) in eR1-cre;KrasG12D mice. Scale bar, 50 µm. Insets show enlarged images for Cd44-positive cells. (B) IF staining for Tff2, Cd44 and E-cad in eR1-cre;KrasG12D;IQ3f/f mice. Scale bar, 50 µm. Insets show enlarged images for Cd44-positive cells. (C) IF staining for Tff2, Cd44 and E-cad in wild-type mice (WT) without treatment. Scale bar, 50 µm. Insets show enlarged images for Cd44-negative gastric units. (D) IF staining for Tff2, Cd44 and E-cad in eR1-cre;IQ3f/f mice. Scale bar, 50 µm. Insets show enlarged images for Cd44-negative gastric units. (E) IF staining for Sox9, E-cad and 4′,6-diamidino-2-phenylindole (DAPI) in eR1-cre;KrasG12D mice. Scale bar, 50 µm. Insets show enlarged images for cytoplasmic and nuclear expression of Sox9. (F) IF staining for Sox9, E-cad and DAPI in eR1-cre;KrasG12D;IQ3f/f mice. Scale bar, 50 µm. Insets show enlarged images for cytoplasmic and nuclear expression of Sox9. (G) IF staining for Sox9, E-cad and DAPI in WT without treatment. Scale bar, 50 µm. Insets show enlarged images for nuclear expression of Sox9. (H) IF staining for Sox9, E-cad and DAPI in eR1-cre;IQ3f/f mice. Scale bar, 50 µm. Insets show enlarged images for nuclear expression of Sox9. (I) IF staining for Cd45, Tgfb1 and DAPI in eR1-cre;KrasG12D, eR1-cre;KrasG12D;IQ3f/f, eR1-cre;IQ3f/f and WT without treatment. Insets show enlarged images for Cd45-Tgfb1 double positive cells. Scale bar, 50 µm.
Figure 11
Figure 11. IQGAP3 expression in human gastric cancer. (A) Scatter plots analysis from The Cancer Genome Atlas Stomach Adenocarcinoma (TCGA-STAD) (n=400) showing the positive correlation between IQGAP3/MKI67, IQGAP3/EPCAM and TGFB1/ACTA2 mRNA expression, and the negative correlation between IQGAP3/VIM, IQGAP3/TGFB1 and IQGAP3/ACTA2 mRNA expression. There was no significant correlation between MKI67/IQGAP2. All graphs other than MKI67/IQGAP2 showed p value <0.0001. (B) Kaplan-Meier survival curves grouped by IQGAP3 expression from TCGA-STAD (n=409). (C) Kaplan-Meier survival curves grouped by TGFB1 expression from TCGA-STAD (n=409). (D) IQGAP3 expression depends on the histological grade of gastric cancer from TCGA-STAD (n=406, G1: G2: G3=12: 148: 246). (E) TGFB1 expression depends on the histological grade of gastric cancer from TCGA-STAD (n=406, G1: G2: G3=12: 148: 246). (F) Kaplan-Meier survival curves grouped by histological grade expression from TCGA-STAD (n=406, MST (days); G1+2, 1686; G3, 801). (G) Statistical analysis for IQGAP3 expression and Lauren classification in TMA from resected gastric cancer tissues in the National University of Singapore Hospital. (H) Statistical analysis for IQGAP3 expression and histological grade in TMA from resected gastric cancer tissues in the National University of Singapore Hospital. (I) Representative images of IQGAP3 expression in TMA samples. Scale bar, 200 µm. MST; mean survival time; Ns, not significant; The Cancer Genome Atlas Stomach Adenocarcinoma (TCGA-STAD); TMA, tissue microarray. *p<0.05, **p<0.01; ***p<0.001; ****p<0.0001. Error bars represent SD.

References

    1. Sung H, Ferlay J, Siegel RL, et al. Global Cancer Statistics 2020: GLOBOCAN Estimates of Incidence and Mortality Worldwide for 36 Cancers in 185 Countries. CA A Cancer J Clin. 2021;71:209–49. doi: 10.3322/caac.21660. - DOI - PubMed
    1. Wu Y, Grabsch H, Ivanova T, et al. Comprehensive genomic meta-analysis identifies intra-tumoural stroma as a predictor of survival in patients with gastric cancer. Gut. 2013;62:1100–11. doi: 10.1136/gutjnl-2011-301373. - DOI - PubMed
    1. Nakamura Y, Kawazoe A, Lordick F, et al. Biomarker-targeted therapies for advanced-stage gastric and gastro-oesophageal junction cancers: an emerging paradigm. Nat Rev Clin Oncol. 2021;18:473–87. doi: 10.1038/s41571-021-00492-2. - DOI - PubMed
    1. Alsina M, Arrazubi V, Diez M, et al. Current developments in gastric cancer: from molecular profiling to treatment strategy. Nat Rev Gastroenterol Hepatol . 2023;20:155–70. doi: 10.1038/s41575-022-00703-w. - DOI - PubMed
    1. Cristescu R, Lee J, Nebozhyn M, et al. Molecular analysis of gastric cancer identifies subtypes associated with distinct clinical outcomes. Nat Med. 2015;21:449–56. doi: 10.1038/nm.3850. - DOI - PubMed

Substances