. 2025 Jun;53(2):204-216.
doi: 10.3758/s13420-024-00652-1. Epub 2024 Oct 22.

Route learning and transport of resources during colony relocation in Australian desert ants

Affiliations

Route learning and transport of resources during colony relocation in Australian desert ants

Sudhakar Deeti et al. Learn Behav. 2025 Jun.

Abstract

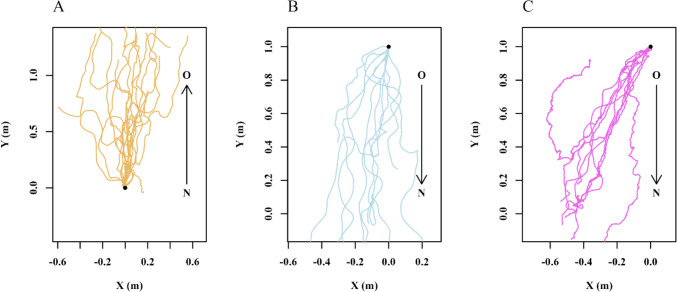
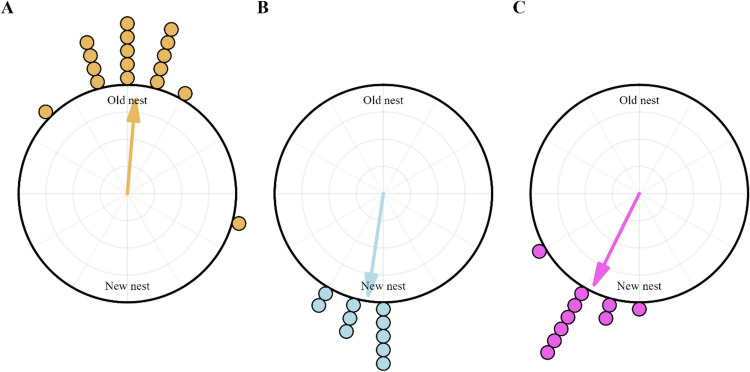
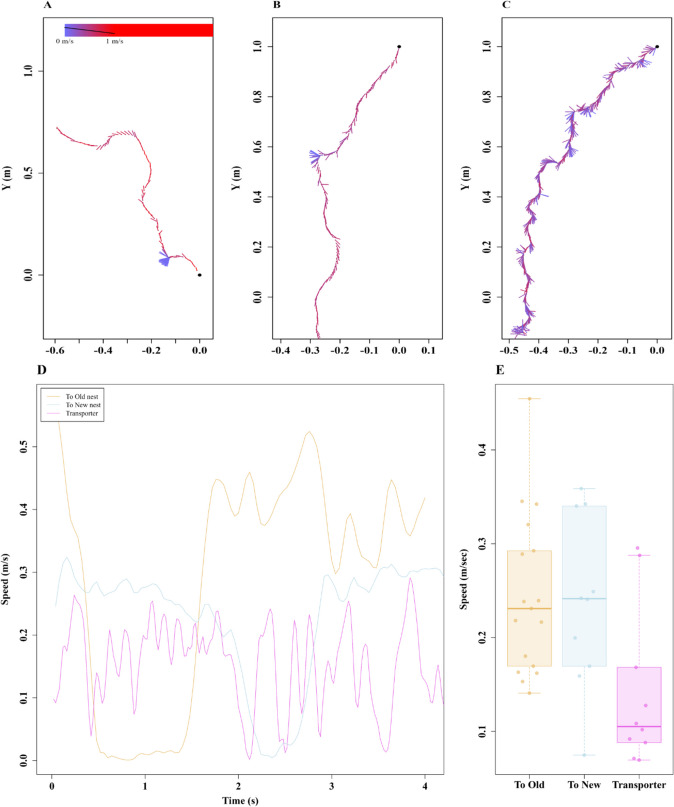
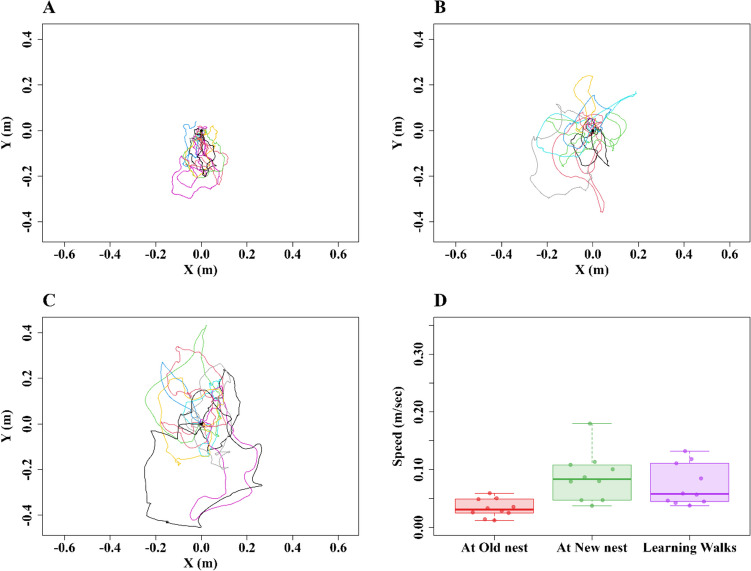
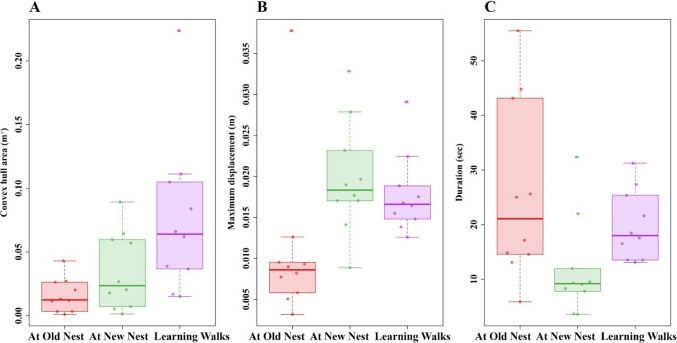
Many ant species can respond to dramatic changes in local conditions by relocating the entire colony to a new location. While we know that careful learning walks enable the homing behavior of foraging ants to their original nest, we do not know whether additional learning is required to navigate to the new nest location. To answer this question, we investigated the nest relocation behavior of a colony of Australian desert ants (Melophorus bagoti) that relocated their nest in response to heavy rainfall in the semidesert terrain of Alice Springs. We identified five types of behavior: exploration between nests (Old-to-New nest and New-to-Old nest), transport from Old to New nest, and relearning walks at Old and New nests. Initially, the workers performed relearning walks at the Old nest and exploratory walks between the Old and New nests. Once they completed the exploratory walks, the workers transported resources and brood to the new nest. Finally, we observed the workers performing relearning walks at the New nest. While the relearning walks at the Old nest were slow and appear to enable exploratory walks to the New nest, the relearning walks at the new nest were faster and appeared to enable homing from foraging trips. These observations shed insight on how learning helps these ants to respond to sudden changes in their environment.

Keywords: Exploratory walks; Nest relocation; Red honey ants; Relearning walks; Transportation.


Conflict of interest statement

Declarations. Ethics standards: Australia has no ethical regulations regarding work with insects. The study was noninvasive and no long-term aversive effects were found on the nests or on the individuals studied. Consent to practice: Not applicable. Consent for publication: Not applicable. Conflicts of interests: The authors declare no competing or financial interests.

Figures

Fig. 1
Fig. 1
Trajectory plots of ants accomplishing different types of travel. A Ants returning to the Old nest from the New nest (N ≥ 10). B Ants heading to the New nest from the Old nest (N = 10). C Ants carrying brood and larvae to the New nest from the Old nest (N = 10). Each line represents the path of an individual ant. The trajectories are translated so that they all originate from position x = 0 and either y = 0 (first instance of the ant in the recording area) for ants heading to the Old nest, or y = 1 for ants heading to the New nest. The x and y coordinates represent the spatial position of the ants; spatial units are m. Arrows indicate expected direction of travel, from New (N) to Old (O) or from Old to New at 10 m away from both nests
Fig. 2
Fig. 2
Circular histograms show the centroid direction of the ants during the exploration and transportation walks toward the Old nest (N ≥ 10) (A), toward the New nest (N = 10) (B), and Transportation (N = 10) (C) walks. The arrows denote the length and direction of the mean vector
Fig. 3
Fig. 3
Path characteristics of ants carrying out different types of travel during the exploration and transportation walks toward the Old nest (N ≥ 10), toward the New nest (N = 10), and Transportation (N = 10) walks: A Sinuosity. B Emax. C Straightness. Box plots display the median (line inside the box), interquartile range (box), and extreme values excluding outliers (whiskers). Individual data points are shown as dots. The data points falling more than 1.5 times the interquartile range beyond the upper or lower quartile are considered as outliers
Fig. 4
Fig. 4
Speed variation in walks during different types of travel. The quiver plots display the speed variation during the walk. Line-segment directions indicate direction of travel at each recorded point in time. Longer line segments indicate that the ant spent a longer time travelling in the indicated direction than shorter line segments (i.e., was moving more slowly). Segment color indicates speed. The three examples represented are: a walk to the Old nest (A), a walk to the New nest (B), and a walk transporting resources (C). D Three examples of the speed of single ants plotted against time for the three cases of travel shown in A, B, and C. The box plots show speed values averaged across the recorded path in each type of travel (E). The boxes indicate the median and quartiles, while the whiskers show extreme values excluding outliers. Data points falling more than 1.5 times the interquartile range beyond the upper or lower quartile (none in the panel) are considered as outliers. (Color figure online)
Fig. 5
Fig. 5
Relearning-walk and learning-walk trajectories and speed characteristics. The line graphs show the relearning walks at the Old nest (A), the New nest (B), and learning walks (C). The nest is located at (0, 0). D Box plots showing the distribution of speed in each observed activity. The boxes indicate the median and quartiles, while the whiskers show extreme values excluding outliers. Data points falling more than 1.5 times the interquartile range beyond the upper or lower quartile (none in the panel) are considered as outliers. (Color figure online)
Fig. 6
Fig. 6
Characteristics of relearning walks at the Old and New nests and of learning walks. A Convex hull area. B Maximum displacement from the nest. C Duration of the walk. The boxes indicate the median and quartiles, while the whiskers show extreme values excluding outliers. Each point represents a single trajectory. The data points falling more than 1.5 times the interquartile range beyond the upper or lower quartile are considered as outliers

References

    1. Baker, V. R., Pickup, G., & Polach, H. A. (1983). Desert palaeofloods in central Australia. Nature,301(5900), 502–504.
    1. Batschelet, E. (1981). Circular statistics in biology. Academic Press.
    1. Benhamou, S. (2004). How to reliably estimate the tortuosity of an animal’s path: Straightness, sinuosity, or fractal dimension? Journal of Theoritical Biology,229(2), 209–220. 10.1016/j.jtbi.2004.03.016 - PubMed
    1. Beshers, S. N., & Fewell, J. H. (2001). Models of division of labor in social insects. Annual Review of Entomology,46(1), 413–440. 10.1146/annurev.ento.46.1.413 - PubMed
    1. Chéron, B., Cronin, A. L., Doums, C., Fédérici, P., Haussy, C., Tirard, C., & Monnin, T. (2011). Unequal resource allocation among colonies produced by fission in the ant Cataglyphis cursor. Ecology,92(7), 1448–1458. 10.1890/10-2347.1 - PubMed

LinkOut - more resources