. 2024 Oct 22;10(1):110.
doi: 10.1038/s41421-024-00740-6.

A spatiotemporal transcriptomic atlas of mouse placentation

Affiliations

A spatiotemporal transcriptomic atlas of mouse placentation

Yanting Wu et al. Cell Discov. .

Abstract

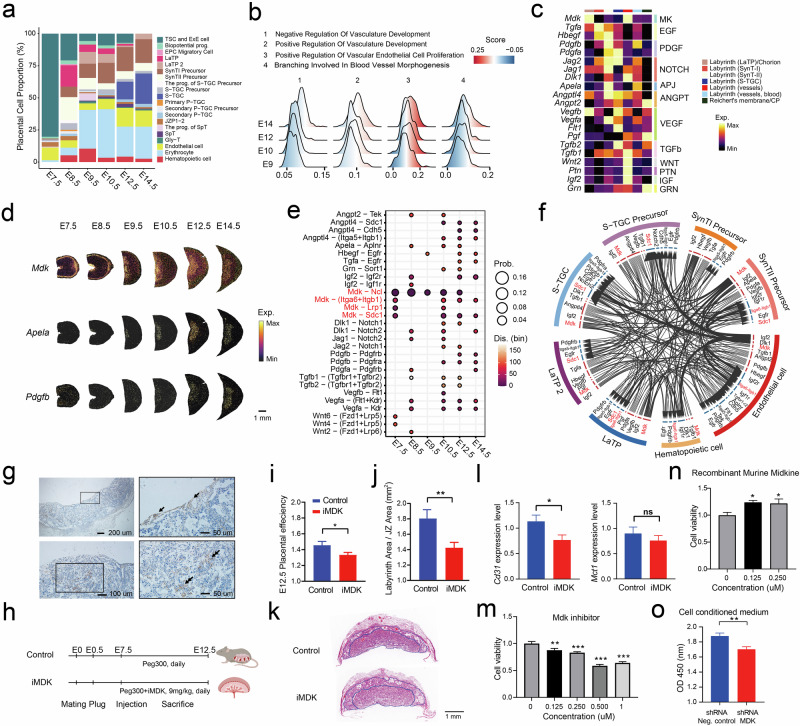
The placenta, a temporary but essential organ for gestational support, undergoes intricate morphological and functional transformations throughout gestation. However, the spatiotemporal patterns of gene expression underlying placentation remain poorly understood. Utilizing Stereo-seq, we constructed a Mouse Placentation Spatiotemporal Transcriptomic Atlas (MPSTA) spanning from embryonic day (E) 7.5 to E14.5, which includes the transcriptomes of large trophoblast cells that were not captured in previous single-cell atlases. We defined four distinct strata of the ectoplacental cone, an early heterogeneous trophectoderm structure, and elucidated the spatial trajectory of trophoblast differentiation during early postimplantation stages before E9.5. Focusing on the labyrinth region, the interface of nutrient exchange in the mouse placenta, our spatiotemporal ligand-receptor interaction analysis unveiled pivotal modulators essential for trophoblast development and placental angiogenesis. We also found that paternally expressed genes are exclusively enriched in the placenta rather than in the decidual regions, including a cluster of genes enriched in endothelial cells that may function in placental angiogenesis. At the invasion front, we identified interface-specific transcription factor regulons, such as Atf3, Jun, Junb, Stat6, Mxd1, Maff, Fos, and Irf7, involved in gestational maintenance. Additionally, we revealed that maternal high-fat diet exposure preferentially affects this interface, exacerbating inflammatory responses and disrupting angiogenic homeostasis. Collectively, our findings furnish a comprehensive, spatially resolved atlas that offers valuable insights and benchmarks for future explorations into placental morphogenesis and pathology.


Conflict of interest statement

The authors declare no competing interests.

Figures

Fig. 1
Fig. 1. A spatiotemporal transcriptomic atlas of mouse placentation.
a Schematic illustration of the workflow for this study. Sections of mouse uterine segments were collected at time points ranging from E7.5 to E14.5 for Stereo-seq. b UMAP plot showing bin 50 of the labyrinth, JZ, and decidua from eight placental sections at six stages. Bins are colored according to placental structure or subregion annotations that were established by unsupervised Louvain clustering and manual annotation steps. c E7.5 S1, E8.5 S1, E9.5 S1, E10.5 S1, E12.5 S1, and E14.5 S1 uterine sections are shown with 24 annotated subregions together with the myometrium. Arrows with one head, arrows with two heads and arrows with three heads indicate the inner EPC, the early interface (EPC inva.) and the early interface (P-TGC inva.), respectively. Bin colors indicating subregion annotations are the same as in b. LaTP labyrinth trophoblast progenitor, SynT syncytiotrophoblasts, CP chorionic plate, EPC ectoplacental cone, JZ junctional zone, GlyT glycogen trophoblast, SpT spongiotrophoblast, SPA-TGC spiral artery-associated TGC, C-TGC canal TGC, P-TGC parietal TGC, MD mesometrial decidua, VSZ vascular sinuses zone, AMD anti-mesometrial decidua. d Multicolor display showing the E10.5 S1 section; seven well-known markers and a ssDNA layer are indicated. e Quantification of the proportion of each subregion in the labyrinth and JZ captured at each developmental stage. All 13 uterine sections were used in this analysis. Colormaps are shown as in c. f Spatial visualization of the expression of the indicated genes in the placenta from E7.5 to E14.5.
Fig. 2
Fig. 2. Transcriptomic landscape during early trophoblast development.
a UMAP plot showing the integrative clustering and annotation of bin50 from the labyrinth and JZ; E7.5 S1, E7.5 S2, E8.5 S1, E8.5 S2, and E9.5 S1 sections were used for this analysis. b E7.5 S1, E8.5 S1, and E9.5 S1 uterine sections are shown with (top) and without (bottom) trophoblast structures. c Bubble plot showing the expression profiles of representative marker genes. Gene labels are displayed in the left panel, and corresponding clusters are annotated and colored in the top and right panels. Colors from black to yellow indicate low to high gene expression levels. d Multicolor display of representative markers and magnified images of the ectoplacental cone regions in section E8.5 S1. e Top: spatial visualization of deconvoluted cell types in the sections in b. Bottom: magnified images showing the cellular composition in the regions in the square of the upper panel. f Heatmap showing scaled proportions of the cell types in each cluster in section E8.5. S1. g Left: spatial RNA velocity streamlines visualization of the directional flows. Right: RNA velocity PAGA graph predicting the developmental trajectory of the ectoplacental cone and P-TGCs in section E8.5 S1. Bins are colored by cluster identity, as in a. h Transcript expression of Hand1 in each cluster across early stages and its median regulon activity score (RAS) among all the clusters.
Fig. 3
Fig. 3. Systematic regulation events during labyrinth development.
a Temporal dynamics of labyrinth cell proportion (allantois, yolk sac, and Reichert’s membrane/Chorionic plate (CP) were excluded). b Ucell score variation across different stages in sets of genes that are involved in vascular-related biological processes. c Spatial expression profiles of key hormones from several signaling pathways. d Visualization of the spatial expression of Mdk, Apela, and Pdgfb. e Significant spatially restricted ligand–receptor interacting pairs were identified in the labyrinth at different stages. f Ligand–receptor gene pairs involving key growth factors that mediate cell–cell communications in the labyrinth as identified in scRNA-seq datasets. The outside ring shows cell types, and the inside ring shows the details of each interacting ligand–receptor pair. Both are color-coded. The width of the line and arrowheads inside are scaled to indicate the relative expression levels of the ligand and receptor, respectively. g IHC staining showing the location of MDK expression in the chorionic plate and SynT of the labyrinth (indicated by an arrow). h Schematic diagram showing the process of iMDK treatment. i Placental efficiency as expressed by the ratio of fetal weight to placental weight (n = 24 for control, n = 41 for iMDK). j Measurements of the labyrinth area and JZ area and the ratio of the labyrinth area to the JZ area (n = 8 control, n = 14 iMDK). k Representative image of a cross-section through the labyrinth and JZ in a mid-section of a mouse placenta. The blue solid line outlines the labyrinth and JZ that was measured in (k). l Real-time quantitative polymerase chain reaction (RT-qPCR) analysis of the expression of markers of SynT-I (Mct1) and endothelial cells (Cd31). RT-qPCR data were normalized to the reference gene Hprt. mo The CCK-8 assay was used to evaluate the proliferation of endothelial cells treated with iMDK (m), recombinant murine MDK (n), and cell-conditioned medium collected from shRNA-MDK-treated trophoblast cells and shRNA-Neg-treated trophoblast cells (o). The data were presented as the means ± SEM. *P < 0.05, **P < 0.01, ***P < 0.001, ns not significant.
Fig. 4
Fig. 4. Spatial distribution of imprinted genes in the placenta.
a Spatiotemporal expression of reported imprinted genes in the placenta. b, c Ucell scores of all paternally and maternally expressed imprinted genes captured by spatial transcriptomics within the imprinted gene set are visualized in spatial subregions (b) and aggregated for different subregions across stages (c). d The top panel shows the locations of the allantois, labyrinth (fetal vessels), and labyrinth blood space at early stages, followed by the spatial expression profiles of the imprinted genes Ndn, Dlk1, Plagl1, and Magel2. e Gene regulatory networks of the top 20 target genes of Plagl1 at E14.5; colors indicate different imprinted statuses. Genes highlighted in red have had their allelic expression reported. Font size and width of lines connecting each target gene are proportional to their network importance scores in the regulon.
Fig. 5
Fig. 5. Transcriptomic landscape at the maternal–fetal interface.
a Schematic of the isolated maternal–fetal interface layers across all stages. The decidua and JZ regions of the interface are shown in different colors. b Cell type composition of the isolated maternal–fetal interface across all stages. c Distribution of gene set scores is shown for Hallmark Interferon Gamma Response and Hallmark Myc Targets across all developmental stages. d, e Spatiotemporal expression profiles of selected transcription factors in each cluster (d) and their median RAS (e). f Spatial visualization of the expression (top) and RAS (bottom) of multiple transcription factors at E8.5. g Gene regulatory networks of Atf3 at E8.5 S1 as visualized by Cytoscape. The top 50 target genes with the highest network importance scores are shown. Font size and width of lines connecting each target gene are proportional to their network importance scores in the regulon. Genes that are involved in the TNF signaling pathway are labeled in red. h Enriched pathways of the 50 top target genes of Atf3 at E8.5. S1. i Interactions of selected ligand–receptor pairs between the decidua and JZ region of the isolated maternal–fetal interface across all six developmental stages.
Fig. 6
Fig. 6. Effect of high-fat diet consumption on regulation at the maternal–fetal interface.
a Schematic diagram showing the HFD treatment schedule and time points for sampling. b UMAP representation of 20 factors in the CD and HFD groups at E14.5. c Spatial distributions of factors 1, 8, 17, and 18 are shown, and colors from light blue to red indicate low to high coefficients for each bin50. d Proportions of immune cell types at the isolated maternal–fetal interface; E10.5 S1, E10.5 S2, E10.5 S3, H10.5 S1, E14.5 S1, E14.5 S2, and H14.5 S1 sections were used for this analysis. e Functional enrichment based on the top 50 weighted genes associated with factors 1, 8, 17, and 18. f Top ten genes defining the indicated NNMFs (factors). g RT-qPCR analysis of the expression of genes associated with factor 1 (Scgb1a1 and S100a8), factor 8 (Jam2 and Thbs1), factor 18 (Isg15 and Ifit3) and factor 17 (Pgf and Cd109). h Genes that were differentially expressed in the decidual and JZ of the maternal–fetal interface are shown. i Gene expression level and regulon activity of Irf7 in the decidua of the interface region. j Top 15 target genes of Irf7 in the CD and HFD groups at E14.5 are shown, and genes that were associated with factor 18 are labeled in red.

References

    1. Burton, G. J. & Jauniaux, E. What is the placenta? Am. J. Obstet. Gynecol.213, S6.e1, S6–S8 (2015). - PubMed
    1. Hemberger, M., Hanna, C. W. & Dean, W. Mechanisms of early placental development in mouse and humans. Nat. Rev. Genet.21, 27–43 (2020). - PubMed
    1. Haram, K. et al. Early development of the human placenta and pregnancy complications. J. Matern. Fetal Neonatal Med.33, 3538–3545 (2020). - PubMed
    1. Adamson, S. L. et al. Interactions between trophoblast cells and the maternal and fetal circulation in the mouse placenta. Dev. Biol.250, 358–373 (2002). - PubMed
    1. Vento-Tormo, R. et al. Single-cell reconstruction of the early maternal-fetal interface in humans. Nature563, 347–353 (2018). - PMC - PubMed

LinkOut - more resources