. 2024 Oct 23;14(1):168.
doi: 10.1038/s41408-024-01142-3.

The DLEU2/miR-15a/miR-16-1 cluster shapes the immune microenvironment of chronic lymphocytic leukemia

Affiliations

The DLEU2/miR-15a/miR-16-1 cluster shapes the immune microenvironment of chronic lymphocytic leukemia

Ronghua Zhang et al. Blood Cancer J. .

Abstract

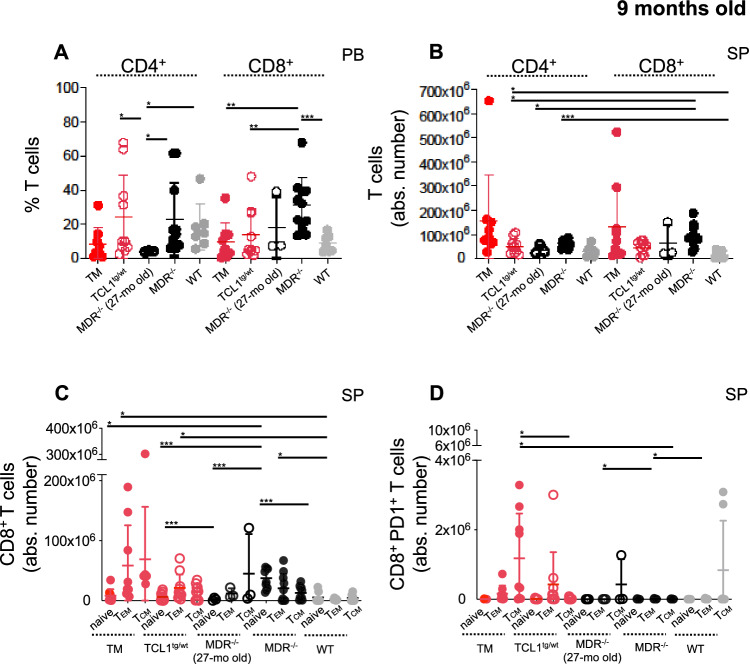
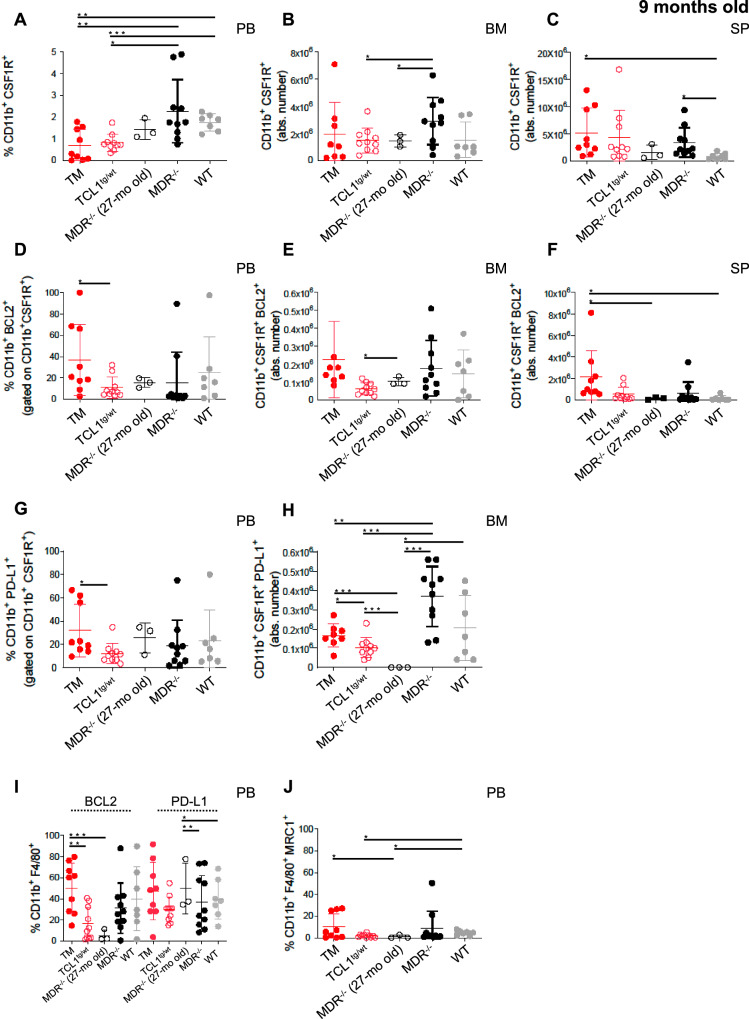
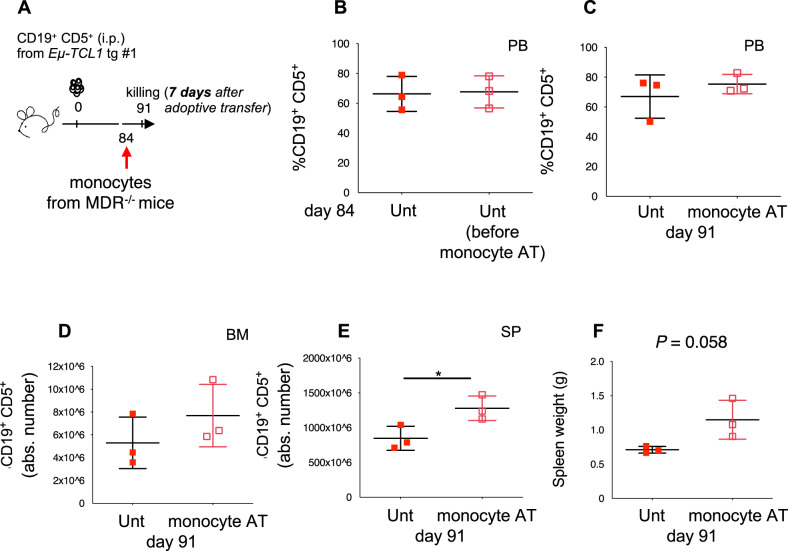
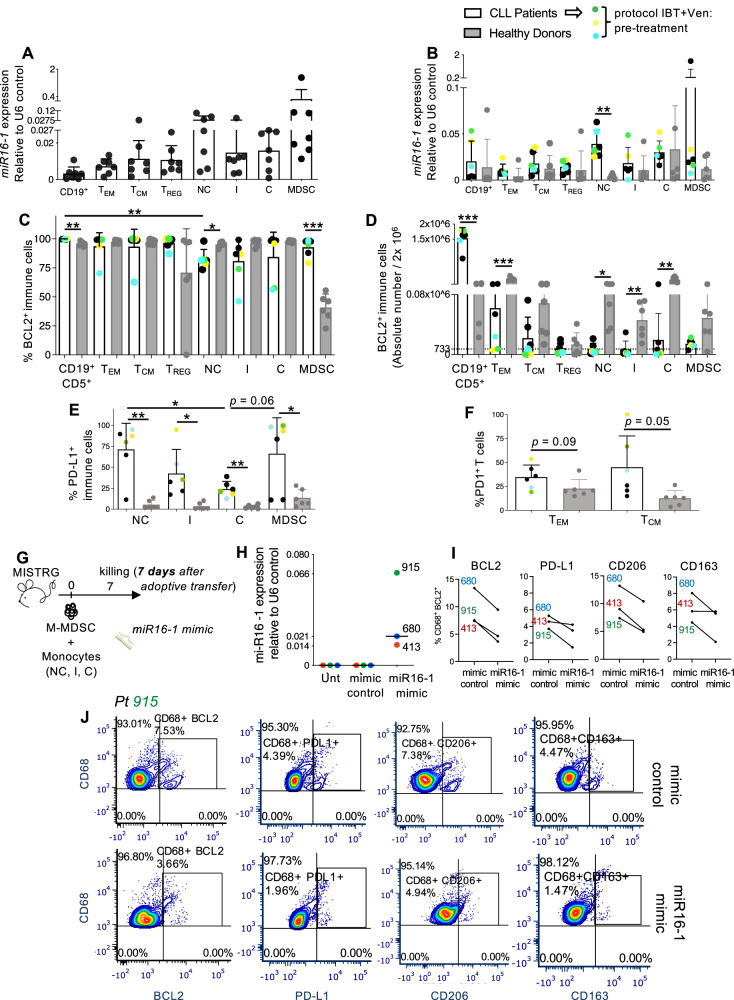
The development and progression of chronic lymphocytic leukemia (CLL) depend on genetic abnormalities and on the immunosuppressive microenvironment. We have explored the possibility that genetic drivers might be responsible for the immune cell dysregulation that shapes the protumor microenvironment. We performed a transcriptome analysis of coding and non-coding RNAs (ncRNAs) during leukemia progression in the Rag2-/-γc-/- MEC1-based xenotransplantation model. The DLEU2/miR-16 locus was found downmodulated in monocytes/macrophages of leukemic mice. To validate the role of this cluster in the tumor immune microenvironment, we generated a mouse model that simultaneously mimics the overexpression of hTCL1 and the germline deletion of the minimal deleted region (MDR) encoding the DLEU2/miR-15a/miR-16-1 cluster. This model provides an innovative and faster CLL system where monocyte differentiation and macrophage polarization are exacerbated, and T-cells are dysfunctional. MDR deletion inversely correlates with the levels of predicted target proteins including BCL2 and PD1/PD-L1 on murine CLL cells and immune cells. The inverse correlation of miR-15a/miR-16-1 with target proteins has been confirmed on patient-derived immune cells. Forced expression of miR-16-1 interferes with monocyte differentiation into tumor-associated macrophages, indicating that selected ncRNAs drive the protumor phenotype of non-malignant immune cells.


Conflict of interest statement

RM, SK, RS are employees of Navan Technologies. All the remaining authors declare no competing financial interests.

Figures

Fig. 1
Fig. 1. Premature CLL-like expansion and shorter life span in TCL1 transgenic mice with MDR deletion.
A Kaplan–Meier survival curves for TCL1+/− (n = 51), TCL1+/−MDR−/− (TM; n = 20), MDR−/−(n = 18) and wild-type (WT; n = 17) mice. A statistical analysis of the groups was performed using the log-rank test (median survival: 10 months for TM, 13 months for TCL1+/−, 17 months for MDR−/−, 24 months for WT mice). Mice were included in the analysis after spontaneous death or after they had been killed because of symptoms of illness. B, C Using flow cytometry, 4-month-old TM mice (n = 7), age-matched TCL1+/− (n = 6), MDR−/− (n = 6) and WT control (n = 6) mice were analyzed for the accumulation of CD19+ CD5+ B cells in the spleen. B The mean values ± the standard deviations (SDs) of the absolute numbers of CD19+ CD5+ cells gated on CD19+ cells and (C) the mean values ± SDs of the absolute numbers of CD19+ BCL2+ cells gated on CD19+ CD5+ cells are shown in the graphs. A statistical analysis was performed using the Student t test *P < 0.05, **P < 0.01. D, E Using flow cytometry, 9-month-old TM (n = 9), age-matched TCL1+/− (n = 10), MDR−/− (n = 10), WT control (n = 7) mice and, 27-month-old MDR−/− (n = 3) were analyzed for the accumulation of CD19+ CD5+ B cells in the spleen. D The mean values ± SDs of the absolute numbers of CD19+ CD5+ cells gated on CD19+ cells and (E) the mean values ± SDs of the absolute numbers of CD19+ BCL2+ cells gated on CD19+ CD5+ cells are shown in the graphs. A statistical analysis was performed using the Student’s t test *P < 0.05, **P < 0.01. FH B cells were purified from the spleen of 9-month-old TM, TCL1+/− and MDR−/− mice using magnetic negative selection. Lysates were processed for the reverse phase protein Array (RPPA). The heatmaps of unsupervised hierarchical clustering display differentially expressed proteins between (F) leukemic cells from TCL1+/− (n = 3) and MDR−/− (n = 6) mice, (G) leukemic cells from TM (n = 3) and MDR−/− (n = 6) mice, and (H) leukemic cells from TM (n = 3) and TCL1+/− (n = 3) mice.
Fig. 2
Fig. 2. Characterization of the T-cell compartment of young TCL1 transgenic mice with MDR deletion.
AH The splenic T-cell compartment of 4-month-old TCL1+/−MDR−/− (TM; n = 7), age-matched TCL1+/−(n = 6), MDR−/− (n = 6), and wild-type (WT) control (n = 6) mice was analyzed using flow cytometry. A The mean values ± the standard deviations (SD) of the absolute numbers of CD4+ and CD8+ T cells, (B) the mean values ± SD of the absolute numbers of CD44CD62L+ naïve, CD44+CD62Llow/neg effector and CD44+CD62L+ central memory CD8+ T cells and, (C) the mean value ± SDs of the absolute numbers of CD44-CD62L+ naïve, CD44+CD62Llow/neg effector and CD44+CD62L+ central memory CD8+ T cells expressing BCL2 are shown in graphs. D The mean value ± SDs of the absolute numbers of CD44CD62L+ naïve, CD44+CD62Llow/neg effector and CD44+CD62L+ central memory CD4+ T cells, (E) the mean value ± SD of the absolute number of CD44CD62L+ naïve, CD44+CD62Llow/neg effector and CD44+CD62L+ central memory CD4+ T cells expressing BCL2 or (F) PD1 are shown in graphs. G The mean value ± SD of the absolute number of CD4+CD25+ T cells and (H) CD4+CD25+BCL2+ T cells are shown in graphs. A statistical analysis was performed using the Student’s t test *P < 0.05, **P < 0.01, ***P < 0.001.
Fig. 3
Fig. 3. Characterization of the monocytes and macrophages of young TCL1 transgenic mice with MDR deletion.
AH Monocytes and macrophages of 4-month-old TCL1+/−MDR−/− (TM; n = 7), age-matched TCL1+/−(n = 6), MDR−/− (n = 6) and WT control (n = 6) mice were analyzed using flow cytometry. A The mean value of the relative contributions of CD11b+ CSF1R+ cells gated on CD45 in peripheral blood (PB) is shown in the graph. B The mean values of the absolute numbers of CD11b+ CSF1R+ cells gated on CD45 in BM and (C) SP are shown in the graphs. D The mean values of the absolute numbers of CD11b+ CSF1R+ BCL2+ monocytes is shown in graph. E The mean value of the relative contributions of CD11b+ Ly6Clow and CD11b+ Ly6Chigh cells to the whole monocyte subset (CD11b+ CSF1R+) gated on CD45+ in the PB is shown in the graph. F The mean values of the absolute numbers of CD11b+ Ly6Clow and CD11b+ Ly6Chigh cells to the whole monocyte subset (CD11b+ CSF1R+) gated on CD45+ in the BM and (G) SP are shown in the graphs. H The mean values of the absolute numbers of CD11b+ F4/80+ cells gated on CD45+ in the SP is shown in the graph. I The mean values of the absolute number of CD11b+ F4/80+ MRC1+ cells, (J) CD11b+ F4/80+ BCL2+ and CD11b+ F4/80+ PD-L1+ gated on CD45+ in the SP are shown in the graphs. A statistical analysis was performed using the Student’s t test *P < 0.05.
Fig. 4
Fig. 4. Characterization of the T cell compartment of leukemic TCL1 transgenic mice with MDR deletion.
AD The splenic T-cell compartment of 9-month-old TCL1+/−MDR−/− (TM; n = 9), age-matched TCL1+/− (n = 10), MDR−/− (n = 10), WT control (n = 7) mice and 27-month-old MDR−/− (n = 3) was analyzed using flow cytometry. A The relative contributions ± SD of the of the CD4+ and CD8+ T cells in the PB, (B) the mean values ± SDs of the absolute numbers of CD4+ and CD8+ T cells in the SP, (C) the mean values ± SDs of the absolute numbers of CD44-CD62L+ naïve, CD44+CD62Llow/neg effector and CD44+CD62L+ central memory CD8+ T cells and, (D) the mean values ± SDs of the absolute numbers of CD44CD62L+ naïve, CD44+CD62Llow/neg effector and CD44+CD62L+ central memory CD8+ T cells expressing PD1 are shown in the graphs. A statistical analysis was performed using the Student’s t test *P < 0.05, **P < 0.01, ***P < 0.001.
Fig. 5
Fig. 5. Characterization of monocytes and macrophages of leukemic TCL1 transgenic mice with MDR deletion.
AH The monocytes and macrophages of 9-month-old TCL1+/−MDR−/− (TM; n = 9), age-matched TCL1+/− (n = 10), MDR−/− (n = 10), WT control (n = 7) mice and 27-month-old MDR−/− (n = 3) were analyzed using flow cytometry. A The mean values ± SDs of the relative contributions of CD11b+ CSF1R+ cells gated on CD45 in PB is shown in the graph. B The mean values ± SDs of the absolute numbers of CD11b+ CSF1R+ cells gated on CD45 in BM and (C) SP are shown in the graphs. D The mean values ± SDs of relative contributions of CD11b+ CSF1R+ BCL2+ monocytes in PB is shown in the graph. E The mean values ± SDs of the absolute numbers of CD11b+ CSF1R+ BCL2+ monocytes in BM and (F) SP are shown in the graphs. G The mean values ± SDs of relative contributions of CD11b+ CSF1R+ PDL1+ monocytes in PB is shown in the graph. H The mean values ± SDs of the absolute numbers of CD11b+ CSF1R+ PDL1+ monocytes in BM is shown in the graph. I The mean values ± SDs of the relative contributions of CD11b+ F4/80+ cells gated on CD45+ in the PB is shown in the graph. J The mean values ± SDs of the relative contributions of CD11b+ F4/80+ MRC1+ cells gated on CD45+ in the PB is shown in the graph. A statistical analysis was performed using the Student’s t test *P < 0.05, **P < 0.01, ***P < 0.001.
Fig. 6
Fig. 6. Pro-tumor function of monocytes and macrophages from MDR−/− mice in the TCL1 transgenic transplantation system.
A C57BL/6 mice intraperitoneally (i.p.) transplanted with leukemic B cells from a Eµ-TCL1 transgenic mouse donor, were left untreated (n = 3, red squares) or adoptively transferred (AT, day +84) with monocytes/macrophages purified from the BM of MDR−/− mice (n = 3, empty red squares). Mice were killed on day 91 and were analyzed using flow cytometry. B The mean values ± SD of the relative contributions of CD19+ CD5+ cells to the whole B cell pool at day 84 and (C) day 91 in the PB of mice are shown in the graphs. D The mean values ± SDs of the absolute number of CD19+ CD5+ cells gated on CD19+ in BM and (E) SP are shown in the graphs. F The spleen weights of untreated and adoptively transferred mice are shown in the graph. A statistical analysis was performed using the Student’s t test *P < 0.05.
Fig. 7
Fig. 7. Characterization of miR-16-1 and related target proteins in human immune cells.
A, B The relative quantification values were calculated as miR-16-1 expression relative to U6 control. (A) miR-16-1 expression in human CD19+ B cells, effector memory hCD8+ CD45RACD45RO+CD62L TEM, central memory hCD8+ CD45RA-CD45RO+CD62L+ TCM, CD4+CD25+CD127low/− Tregs, CD14+ CD16++ non-classical, CD14++ CD16+ intermediate and CD14++ CD16 classical monocytes and CD14+HLADRlow/− M-MDSCs, separated from fresh PBMCs of CLL patients (n = 7, patients 1–7, Table S1) using fluorescence-activated cell sorting is shown in the graph. B Frozen PBMCs obtained from healthy donors (n = 6) and patients with CLL (n = 6, patients 1, 2, 3, 51, 52, 68) were plated for 2 h in a 6-well plate at 6 × 10⁶/1.8 mL after thawing and were then stained for fluorescence activated cell sorting (FACS). Patients 51, 52, 68 were enrolled into trial with ibrutinib (IBT) and venetoclax (Ven) after this study, and are indicated as pre-treatment. miR-16-1 expression in human CD19+ B cells, effector memory hCD8+ CD45RACD45RO+CD62L TEM, central memory hCD8+ CD45RA-CD45RO+CD62L+ TCM, CD4+CD25+CD127low/− TREG, CD14+ CD16++ non-classical (NC), CD14++ CD16+ intermediate (I) and CD14++ CD16 classical (C) monocytes and CD14+HLADRlow/− M-MDSCs, separated from PBMCs of healthy donors and patients with CLL is shown in graph. CF Frozen PBMCs obtained from healthy donors (n = 6) and patients with CLL (n = 6, patients 1, 2, 3, 51, 52, 68) were plated for 2 h in a 6-well plate at 6 × 10⁶/1.8 mL after thawing and were then stained and analyzed for the expression of BCL2, PD1 and PD-L1 on CD19+ B cells, effector memory hCD8+ CD45RA-CD45RO+CD62L TEM, central memory hCD8+ CD45RACD45RO+CD62L+ TCM, CD4+CD25+CD127low/− Tregs, CD14+ CD16++ non-classical, CD14++ CD16+ intermediate and CD14++ CD16 classical monocytes and CD14+HLADRlow/− M-MDSCs using flow cytometry. C The mean values ± SDs of the relative contributions of BCL2 expressing immune cells from patients with CLL and healthy donor controls and are shown in the graph. D The mean values ± SDs of the absolute numbers of BCL2 expressing immune cells from patients with CLL and healthy donor controls are shown in the graph. E The mean values ± SDs of the relative contributions of PD-L1+ CD14+ CD16++ non-classical, PD-L1+ CD14++ CD16+ intermediate, PD-L1+ CD14++ CD16 classical monocytes and PD-L1+ CD14+HLADRlow/− M-MDSCs from patients with CLL and healthy donor controls are shown in graph. F The mean values ± SDs of the relative contributions of PD1+ CD8+ CD45RACD45RO+CD62L TEM and PD1+ CD8+ CD45RA-CD45RO+CD62L+ TCM from patients with CLL and healthy donor controls are shown in graph. G MISTRG mice were adoptively transferred on day 0 with monocytes and M-MDSCs (i.v.: 50,000-546,000 cells depending on the patient, including NC, I, C monocyte subsets and M-MDSCs) separated using fluorescence-activated cell sorting from the PBMCs of patients 413, 680, 915 (Table S2) and NS-transfected for 15 min with 50pM of either miR-16-1 miRNA mimic or miRNA mimic control. Mice were euthanized 7 days later for the analysis of patient-derived macrophages. H miR-16-1 expression relative to U6 control in myeloid cell pools (including NC, I, C monocytes and M-MDSCs) separated from PBMCs of CLL patients (n = 3, patients 413, 680, 915, Table S2) and then NS-transfected with miR-16-1 miRNA mimic (miR-16-1 mimic), with mimic control (mimic control) or left untreated (Unt) is shown in the graph. I The percentages of BCL2+, PD-L1+, CD206+, CD163+ to the whole CD68+ macrophage pool gated on live cells detected in the PB of MISTRG mice are shown in the graphs. J Flow cytometry detection of BCL2, PD-L1, CD206 and CD163 by human CD68+ macrophages in the PB of MISTRG mice transplanted with cells from representative patient 915. The percentage of BCL2, PD-L1, CD206 and CD163-expressing macrophages is indicated. A statistical analysis was performed using the Student’s t test *P < 0.05, **P < 0.01, ***P < 0.001.

References

    1. Dohner H, Stilgenbauer S, Benner A, Leupolt E, Krober A, Bullinger L, et al. Genomic aberrations and survival in chronic lymphocytic leukemia. N. Engl J Med. 2000;343:1910–6. - PubMed
    1. Svanberg R, Janum S, Patten PEM, Ramsay AG, Niemann CU. Targeting the tumor microenvironment in chronic lymphocytic leukemia. Haematologica. 2021;106:2312–24. - PMC - PubMed
    1. Rassenti LZ, Balatti V, Ghia EM, Palamarchuk A, Tomasello L, Fadda P, et al. MicroRNA dysregulation to identify therapeutic target combinations for chronic lymphocytic leukemia. Proc Natl Acad Sci USA. 2017;114:10731–6. - PMC - PubMed
    1. Calin GA, Ferracin M, Cimmino A, Di Leva G, Shimizu M, Wojcik SE, et al. A MicroRNA signature associated with prognosis and progression in chronic lymphocytic leukemia. N. Engl J Med. 2005;353:1793–801. - PubMed
    1. Scaglione BJ, Salerno E, Balan M, Coffman F, Landgraf P, Abbasi F, et al. Murine models of chronic lymphocytic leukaemia: role of microRNA-16 in the New Zealand Black mouse model. Br J Haematol. 2007;139:645–57. - PMC - PubMed

Publication types

MeSH terms