. 2024 Oct 22;14(1):446.
doi: 10.1038/s41398-024-03162-w.

Resting-state brain activation patterns and network topology distinguish human sign and goal trackers

Affiliations

Resting-state brain activation patterns and network topology distinguish human sign and goal trackers

Martino Schettino et al. Transl Psychiatry. .

Abstract

The "Sign-tracker/Goal-tracker" (ST/GT) is an animal model of individual differences in learning and motivational processes attributable to distinctive conditioned responses to environmental cues. While GT rats value the reward-predictive cue as a mere predictor, ST rats attribute it with incentive salience, engaging in aberrant reward-seeking behaviors that mirror those of impulse control disorders. Given its potential clinical value, the present study aimed to map such model onto humans and investigated resting state functional magnetic resonance imaging correlates of individuals categorized as more disposed to sign-tracking or goal-tracking behavior. To do so, eye-tracking was used during a translationally informed Pavlovian paradigm to classify humans as STs (n = 36) GTs (n = 35) or as Intermediates (n = 33), depending on their eye-gaze towards the reward-predictive cue or the reward location. Using connectivity and network-based approach, measures of resting state functional connectivity and centrality (role of a node as a hub) replicated preclinical findings, suggesting a major involvement of subcortical areas in STs, and dominant cortical involvement in GTs. Overall, the study strengthens the translational value of the ST/GT model, with important implications for the early identification of vulnerable phenotypes for psychopathological conditions such as substance use disorder.


Conflict of interest statement

The authors declare no competing interests.

Figures
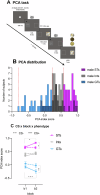
Fig. 1
Fig. 1. Timeline of the PCA task.
Timeline of the Pavlovian conditioning approach task (PCA) (A). Distribution of PCA scores for male (darker colors) and female (lighter colors) participants (B). PCA scores across the two blocks between the phenotypes (STs, GTs and Ints) for CS+ and CS− trials (C). Note. PCA Pavlovian conditioning approach, STs sign trackers, Ints intermediate trackers, GTs goal trackers. Red dotted lines in panel (B) indicate the phenotype split. Bars represent standard error of the mean. *p < 0.05; **p < 0.001; ***p < 0.0001.
Fig. 2
Fig. 2. Dwell Time Analysis.
Dwell time on the Cue (panel A) and the Goal (panel B) for CS+ and CS− trials across the four blocks examined in the random effect regression models for the three phenotypes (STs, GTs, and Ints). Note. STs sign-trackers, Ints intermediates, GTs goal-trackers. Bars represent standard error of the mean. *p < 0.05; **p < 0.001; ***p < 0.0001.
Fig. 3
Fig. 3. Correlations between the PCA score and Eigenvector centrality.
The node colors depict the normalized group mean of centrality (STs − GTs/STs + GTs) where more positive values corresponds to STs (pink) and more negative values to GTs (blue). The node size indicates the amount of Bayesian evidence for the alternative hypothesis where larger circles correspond to stronger Bayesian evidence for a significant mean difference of node centrality (A). Statistically significant group differences in resting state functional connectivity patterns. The strength of the connection indicates the amount of Bayesian evidence for the alternative hypothesis (B). Note. STs sign-trackers, GTs goal-trackers, OFC orbitofrontal cortex, mPFC medial prefrontal cortex, NAcc nucleus accumbens, NAcsh nucleus accumbens shell, Cau caudate, Ins insula, Put putamen, GP globus pallidus, Amy amygdala, aThv anterior ventral thalamus, pThv posterior ventral Thalamus, aThd Anterior dorsal Thalamus, pThd posterior dorsal thalamus.
Fig. 4
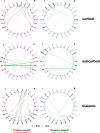
Fig. 4. Group specific resting state functional connectivity patterns in sign-trackers (STs) and goal-trackers (GTs) in the selected cortical, subcortical and thalamic regions.
Note. The thickness of the lines reflects the strength of the correlation ( > thickness = > Pearson’s correlation coefficients). STs sign-trackers, GTs goal-trackers, OFC orbitofrontal cortex, mPFC medial prefrontal cortex, NAcc nucleus accumbens, NAcsh nucleus accumbens shell, Cau caudate, Ins insula, Put putamen, GP globus pallidus, Amy amygdala, aThv anterior ventral thalamus, pThv posterior ventral thalamus, aThd anterior dorsal thalamus, pThd posterior dorsal thalamus.

References

    1. Robinson TE, Flagel SB. Dissociating the predictive and incentive motivational properties of reward-related cues through the study of individual differences. Biol Psychiatry. 2009;65:869–73. 10.1016/j.biopsych.2008.09.006. - PMC - PubMed
    1. Robinson TE, Yager LM, Cogan ES, Saunders BT. On the motivational properties of reward cues: individual differences. Neuropharmacol. 2014;76:450–9. 10.1016/j.neuropharm.2013.05.040 - PMC - PubMed
    1. Flagel SB, Clark JJ, Robinson TE, Mayo L, Czuj A, Willuhn I, et al. A selective role for dopamine in stimulus-reward learning. Nature. 2011;469:53–7. - PMC - PubMed
    1. Lesaint F, Sigaud O, Flagel SB, Robinson TE, Khamassi M. Modelling individual differences in the form of Pavlovian conditioned approach responses: a dual learning systems approach with factored representations. PLoS Comput Biol. 2015;10:e1003466. 10.1371/journal.pcbi.1003466 - PMC - PubMed
    1. Clark JJ, Hollon NG, Phillips PEM. Pavlovian valuation systems in learning and decision making. Curr Op Neurobiol. 2012. 10.1016/j.conb.2012.06.004. - PMC - PubMed