. 2024 Oct 22;15(1):9092.
doi: 10.1038/s41467-024-53347-6.

Oral reovirus reshapes the gut microbiome and enhances antitumor immunity in colon cancer

Affiliations

Oral reovirus reshapes the gut microbiome and enhances antitumor immunity in colon cancer

Won Suk Lee et al. Nat Commun. .

Abstract

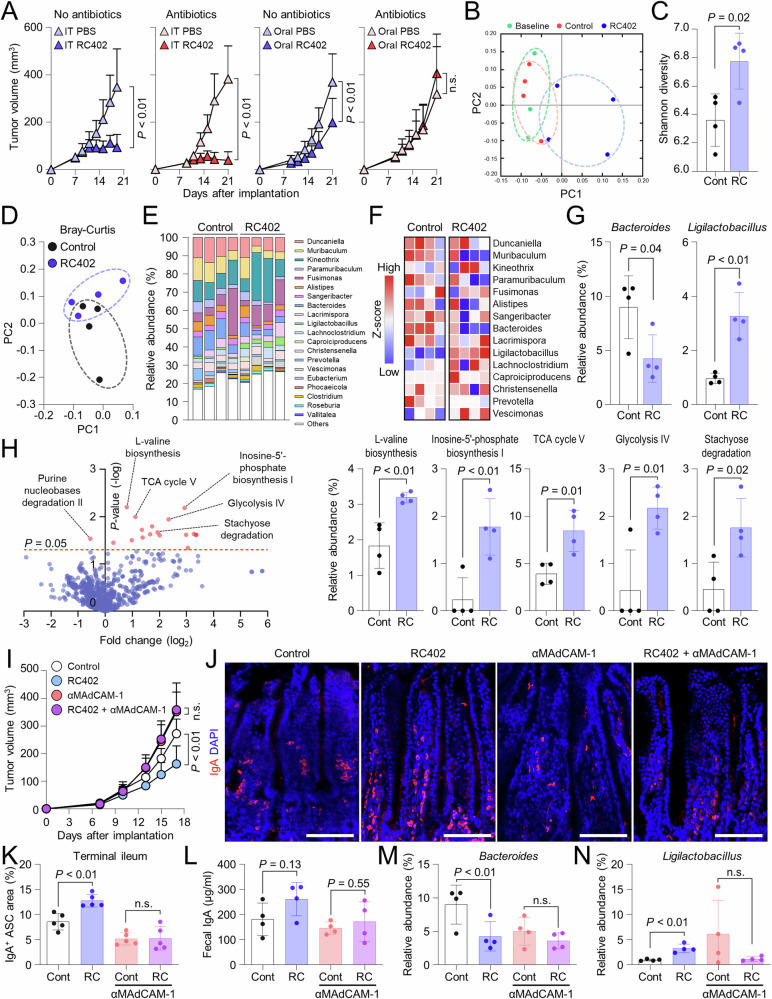
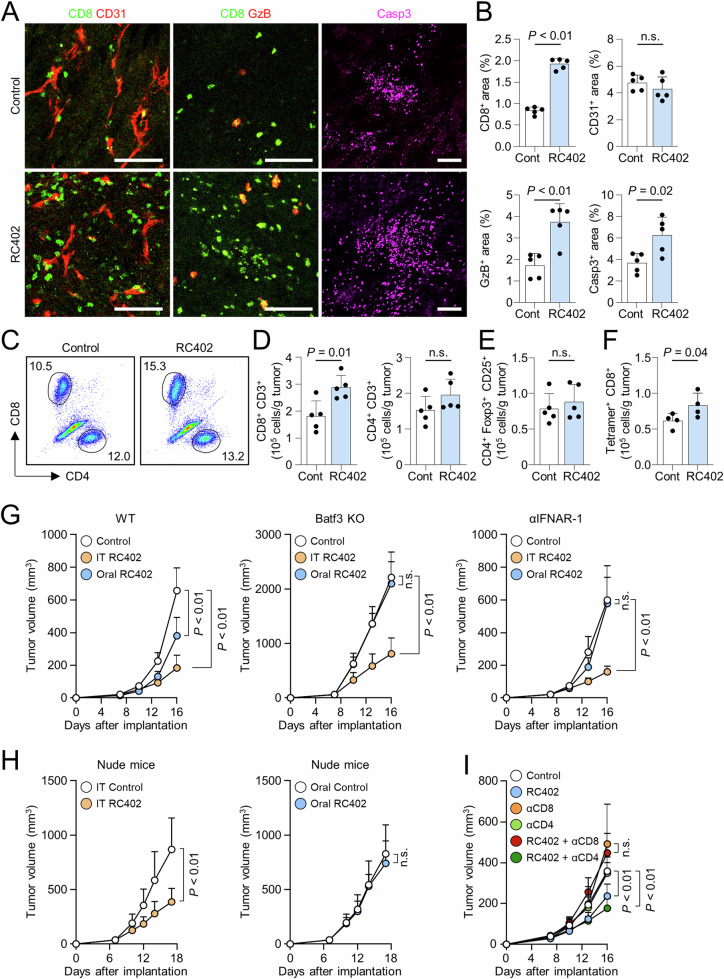
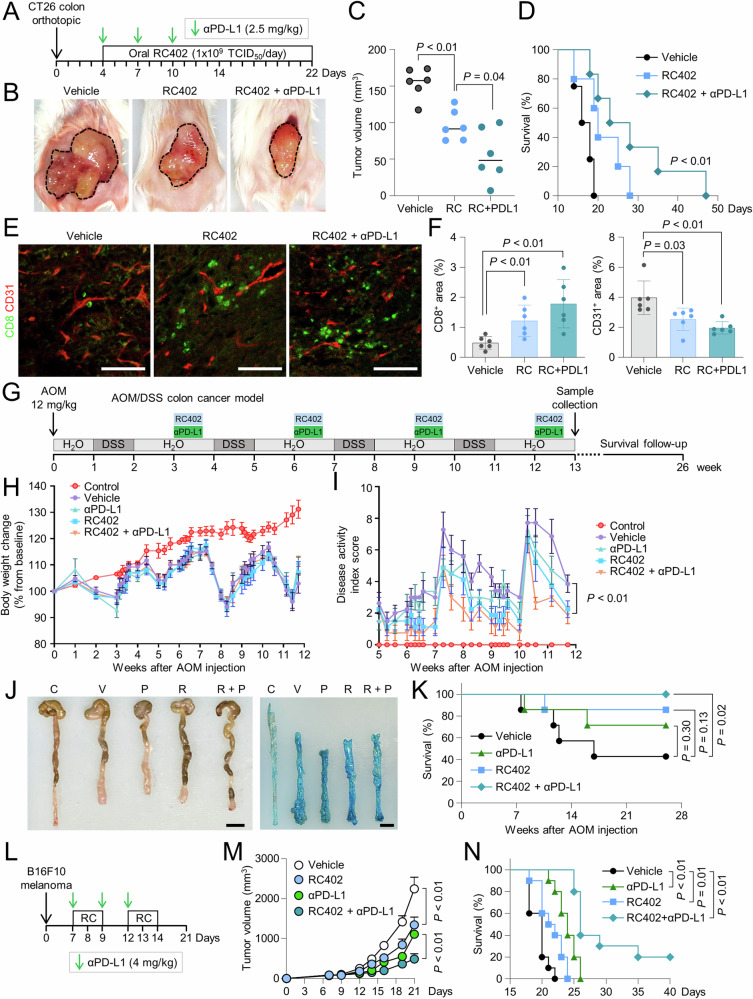
The route of oncolytic virotherapy is pivotal for immunotherapeutic efficacy in advanced cancers. In this preclinical study, an oncolytic reovirus (RC402) is orally administered to induce antitumor immunity. Oral reovirus treatment shows no gross toxicities and effectively suppresses multifocal tumor lesions. Orally administered reovirus interacts with the host immune system in the Peyer's patch of the terminal ileum, increases IgA+ antibody-secreting cells in the lamina propria through MAdCAM-1+ blood vessels, and reshapes the gut microbiome. Oral reovirus promotes antigen presentation, type I/II interferons, and T cell activation within distant tumors, but does not reach or directly infect tumor cells beyond the gastrointestinal tract. In contrast to intratumoral reovirus injection, the presence of the gut microbiome, Batf3+ dendritic cells, type I interferons, and CD8+ T cells are indispensable for orally administered reovirus-induced antitumor immunity. Oral reovirus treatment is most effective when combined with αPD-1(L1) and/or αCTLA-4, leading to complete colon tumor regression and protective immune memory. Collectively, oral reovirus virotherapy is a feasible and effective immunotherapeutic strategy in preclinical studies.


Conflict of interest statement

C.K. has a consulting or advisory role at Roche, MSD, BMS, ONO, Oncocross, Virocure, and Sillajen, and has received research grants from Panolos Bioscience, Boryung Pharmaceuticals, Oncocross, Sillajen, and Virocure. H.J.C. has a consulting or advisory role at Roche, Bayer, ONO, MSD, BMS, Celgene, Sanofi, Servier, AstraZeneca, Eisai, Sillajen, Menarini, GreenCross Cell, and Virocure and has received research grants from Panolos Bioscience, Roche and Boryung Pharmaceuticals. E.G., K-H.S. and D.G.P. are employees of Virocure. T.A. has a consulting and advisory role at Virocure, CuroV Science and Genvira Biosciences. The other authors declare no competing interests.

Figures

Fig. 1
Fig. 1. Oral administration of reovirus shows potent antitumor efficacy in a multifocal tumor model.
Mice were subcutaneously implanted with CT26 or MC38 tumor cells in single (AD) or multifocal (EH) lesions and treated with RC402 (R) and/or αPD-1 (PD1). A Schematic diagram of the treatment schedule in single tumor-bearing mice. Arrows indicate treatments. B Comparison of tumor growth in single tumor-bearing mice treated with phosphate buffered saline (PBS, n = 5), intratumoral (IT) RC402 (n = 6), or oral RC402 (n = 6). C Comparison of tumor growth suppression in single tumor-bearing mice. Each bar indicates the % change in each tumor volume compared to the mean of control tumor volumes at the end of treatment. D Comparison of MC38 tumor growth in single tumor-bearing mice treated with PBS, IT RC402, or oral RC402 (n = 6 per group). E Schematic diagram of the treatment schedule in multifocal tumor-bearing mice. The tumor in the right upper quadrant was labeled as tumor 1, and others are labeled as 2, 3, and 4 in a counterclockwise direction. Mice were treated with PBS, IT RC402, or oral RC402, and/or αPD-1. Arrows indicate treatments. Comparison of tumor growth suppression in multifocal tumor-bearing mice treated with IT RC402 (F) or oral RC402 (G) (n = 5 per group). Each bar indicates the % change in each tumor volume compared to the mean of control tumor volumes at the end of treatment. H Comparison of the sum of all tumor volumes per mouse. Overall tumor volume was calculated by summing the volume of every tumor per mouse and normalizing it to the mean overall tumor volume of the control group. Dotter line indicates the mean of overall tumor burden in control group (n = 5 per group). Data are pooled from two independent experiments. Values are expressed as the mean ± standard deviation (SD). Two-tailed Student’s t test and ANOVA with Tukey post-hoc test were used. Source data are provided as a Source Data file.
Fig. 2
Fig. 2. Oral RC402 interacts with the host immune system in Peyer’s patch and triggers robust T cell immunity within the tumor microenvironment.
CT26 tumor-bearing mice were orally administered with AF647-fluorescent labeled RC402 and the reovirus distribution was serially monitored. A Schematic diagram depicting the gastrointestinal (GI) migration and distribution of orally administered RC402. B, C Representative images and quantifications of the fluorescent labeled RC402 localization in each organ over time (n = 3 per group). D Representative images showing reovirus and CD45+ leukocytes within terminal ileum and Peyer’s patch (PP). Arrows indicate RC402 infected mucosal epithelial cells. E Representative images showing the absence of RC402 within mesenteric lymph nodes (LN), spleen, and tumor tissues. F Comparison of reovirus transcripts within PP, LN, spleen, and tumor tissue after oral RC402 treatment (n = 4 per group). G Volcano plot showing transcriptome changes in reovirus-treated PP, LN, and tumor tissues compared with PBS-treated matched-control tissues after 7 days of oral RC402 treatment (n = 3 per group). Colored dots indicate significantly upregulated genes after oral RC402 treatment (one-tailed Student’s t test). Red lines denote P = 0.05. H Enrichment of Gene Ontology (GO) biological processes in each tissue after 7 days of oral RC402 treatment (n = 3 per group, one-tailed Fisher’s Exact test). I Heatmap showing the expression of genes related to innate immunity, interferons (IFNs), Th1/Th2 responses, T cell activation, immune checkpoints, and tumor microenvironment after 7 days of RC402 treatment (n = 3 per group). Values are fold changes in RC402-treated tissues compared with matched-control tissues. Data are pooled from two independent experiments. Values are expressed as the mean ± SD. Scale bars, 100 μm. Source data are provided as a Source Data file.
Fig. 3
Fig. 3. Oral RC402 reshapes the gut microbiome by increasing IgA+ antibody-secreting cells (ASCs) in the terminal ileum via MAdCAM-1.
Mice were subcutaneously implanted with CT26 tumor cells, orally administered with RC402 (RC), and gut microbiomes were analyzed using shotgun metagenomic sequencing (BH). A The gut microbiome was depleted with a cocktail of antibiotics. Then, mice were implanted with CT26 tumor cells and treated with PBS, IT, or oral RC402. Comparison of tumor growth (n = 5 for IT PBS without antibiotics; n = 6 for IT RC402 without antibiotics; n = 6 for oral PBS or oral RC402 without antibiotics; n = 8 for other groups). B Principal coordinate analysis (PCoA) showing distinct clustering of gut microbiome in baseline and PBS- or RC402-treated mice (n = 3 for baseline; n = 4 for other groups). C Comparisons of gut microbiome diversity in terms of Shannon index. D PCoA plot showing Bray-Curtis dissimilarity. E Relative abundance of gut microbiota at the genus level (n = 4 per group). F Heatmap showing the relative abundance of gut microbiota at the genus level. Values are z-scores (n = 4 per group). G Abundance of specific genus in PBS- or RC402-treated mice. H Volcano plot showing differentially expressed microbial metabolic pathways and abundance of specific metabolic pathways between PBS- or RC402-treated mice (one-tailed Student’s t test). IN CT26 tumor-bearing mice were treated with oral PBS or RC402 in the presence and absence of αMAdCAM-1 neutralization antibody. I Comparison of CT26 tumor growth. (n = 6 for RC402; n = 7 for other groups). J, K Representative images and comparisons of IgA+ ASCs within lamina propria of terminal ileum. L Comparisons of fecal IgA levels. Expression was normalized to total fecal protein. M, N Abundance of specific genus in PBS-, RC402-, and/or αMAdCAM-1-treated mice. Data are pooled from two independent experiments. Values are expressed as the mean ± SD. Unless otherwise denoted, two-tailed Student’s t test and ANOVA with Tukey post-hoc test were used. Scale bars, 100 μm. Source data are provided as a Source Data file.
Fig. 4
Fig. 4. Oral reovirus suppresses tumor growth by inducing tumor-specific CD8+ T cells.
AF Mice were subcutaneously implanted with CT26 tumor cells and treated orally with PBS or RC402. A, B Representative images and comparisons of CD8+ T cells, CD31+ tumor vasculatures, granzyme B (GzB)+ T cells, and caspase 3 (Casp3)+ apoptotic cells within tumor tissues (n = 5 per group). C, D Comparison of CD8+ T cells and CD4+ T cells in tumors (n = 5 per group). E Comparisons of CD4+Foxp3+CD25+ Tregs (n = 5 per group). F Comparison of the AH-1 tetramer+ CD8+ T cells (n = 4 per group, one-tailed Student’s t test). G MC38 tumor cells were subcutaneously implanted into wild-type (WT) (n = 7), Batf3 knockout (KO) (n = 6), and αIFNAR-1-treated WT mice (n = 7), and the mice were treated with PBS, IT, or oral RC402.Comparisons of tumor growth. H Nude mice were subcutaneously implanted with CT26 tumor cells and treated with PBS, IT, or oral RC402. Comparisons of tumor growth (n = 9 for IT PBS; n = 8 for IT RC402; n = 9 for oral PBS; n = 8 for oral RC402). I Mice were subcutaneously implanted with CT26 tumor cells and treated with oral RC402 and depleting antibodies for CD8+ T cells (αCD8) or CD4+ T cells (αCD4) (n = 5 per group). Comparisons of tumor growth. Data are pooled from two independent experiments. Values are expressed as the mean ± SD. Unless otherwise denoted, two-tailed Student’s t test and ANOVA with Tukey post-hoc test were used. Scale bars, 100 μm. Source data are provided as a Source Data file.
Fig. 5
Fig. 5. Oral reovirus synergizes with αPD-L1 in orthotopic tumors and colitis-associated colon cancer.
AF Mice were orthotopically implanted with CT26 colon and treated with oral RC402 (RC) and/or intraperitoneal αPD-L1 (PDL1). A Schematic diagram showing the treatment schedule for orthotopic CT26 colon cancer. B, C Representative images and comparisons of orthotopic colon cancer growth at the end of treatment (n = 6 per group). D Kaplan−Meier curves for overall survival (n = 4 for vehicle; n = 5 for RC402; n = 6 for RC402 and αPD-L1). E, F Representative images and comparison of CD8+ T cells and CD31+ tumor vasculatures within tumor tissues (n = 6 per group). GK Mice with colitis-associated colorectal cancers were treated with oral RC402 (R) and/or intraperitoneal αPD-L1 (P) for a longer duration. G Schematic diagram showing the treatment schedule. After the initial administration of azoxymethane (AOM), mice were orally administered with drinking water containing 3% dextran sodium sulfate (DSS) for a week every three-week interval. Oral RC402 and αPD-L1 were administered at the indicated time points. H Comparison of body weight changes from baseline (n = 4 for control; n = 8 for other groups). I Comparison of the disease activity index score (n = 4 for control; n = 8 for other groups). J Comparisons of the colon length and tumor nodules. K Kaplan−Meier curves for overall survival (n = 7 per group). LN Mice were subcutaneously implanted with B16F10 melanoma cells and treated with oral RC402 and/or αPD-L1. L Schematic diagram showing the treatment schedule. M Comparison of B16F10 tumor growth in mice (n = 15 for vehicle; n = 10 for other groups). Mean tumor growth curves over time. N Kaplan−Meier curves for overall survival (n = 10 per group). Data are pooled from two independent experiments. Values are expressed as the mean ± SD. Two-tailed Student’s t test, ANOVA with Tukey post-hoc test, and log-rank test were used. Scale bars, 1 cm. Source data are provided as a Source Data file.
Fig. 6
Fig. 6. Triple combination immunotherapy of oral reovirus with αPD-1 and/or αCTLA-4 induces complete tumor regressions and protective immune memory.
AD Mice were subcutaneously implanted with CT26 tumor cells and treated with RC402 (RC), αPD-1 (P), αCTLA-4 (C) and/or a cocktail of antibiotics. A Schematic diagram of the treatment schedule. B Comparison of CT26 tumor growth. The number of tumor-free mice is indicated. C, D Representative images and comparisons of CD8+ T cells (n = 7 for control; n = 6 for other groups), CD31+ tumor vasculatures (n = 7 for control; n = 6 for other groups), GzB+ activated CD8+ T cells (n = 5 per group), and Casp3+ apoptotic cells (n = 5 per group) within tumors. EK CT26 tumor-bearing mice treated with the triple combination therapy of oral RC402, αPD-1, and αCTLA-4. Mice experiencing complete regression (CR) of tumors were rechallenged with CT26 tumor cells (n = 5 for naïve; n = 4 for CR). E Scheme of the triple combination immunotherapy and tumor rechallenge. F Comparison of tumor growth in naïve mice or mice experiencing CR with combination immunotherapy. G Representative plot showing the tumor-specific AH-1 tetramer+ fraction of CD8+ T cells in the spleen. H, I Comparison of CD8+ T cell and AH-1 tetramer+ CD8+ T cell fractions in the spleen. J, K Representative plot and comparison of the naïve, central memory (CM, CD44+CD62L+), and effector memory (EM, CD44+CD62L) T cells among CD8+ T cells within the spleen. Data are pooled from two independent experiments. Values are expressed as the mean ± SD. Two-tailed Student’s t test was used. Scale bars, 100 μm. Source data are provided as a Source Data file.

References

    1. Shalhout, S. Z., Miller, D. M., Emerick, K. S. & Kaufman, H. L. Therapy with oncolytic viruses: progress and challenges. Nat. Rev. Clin. Oncol.20, 160–177 (2023). - PubMed
    1. Bell, J. C. Check and checkmate: battling cancer with multiplex immunotherapy. Mol. Ther.28, 1236–1237 (2020). - PMC - PubMed
    1. Bourhill, T., Mori, Y., Rancourt, D. E., Shmulevitz, M. & Johnston, R. N. Going (Reo)viral: factors promoting successful reoviral oncolytic infection. Viruses10, 421 (2018). - PMC - PubMed
    1. Kim, M. et al. Amplification of oncolytic vaccinia virus widespread tumor cell killing by sunitinib through multiple mechanisms. Cancer Res.78, 922–937 (2018). - PMC - PubMed
    1. Oh, C. M., Chon, H. J. & Kim, C. Combination immunotherapy using oncolytic virus for the treatment of advanced solid tumors. Int. J. Mol. Sci.21, 7743 (2020). - PMC - PubMed

Publication types

MeSH terms

Associated data