. 2024 Oct 22;15(1):8802.
doi: 10.1038/s41467-024-52867-5.

In situ visualization of endothelial cell-derived extracellular vesicle formation in steady state and malignant conditions

Affiliations

In situ visualization of endothelial cell-derived extracellular vesicle formation in steady state and malignant conditions

Georgia K Atkin-Smith et al. Nat Commun. .

Erratum in

Abstract

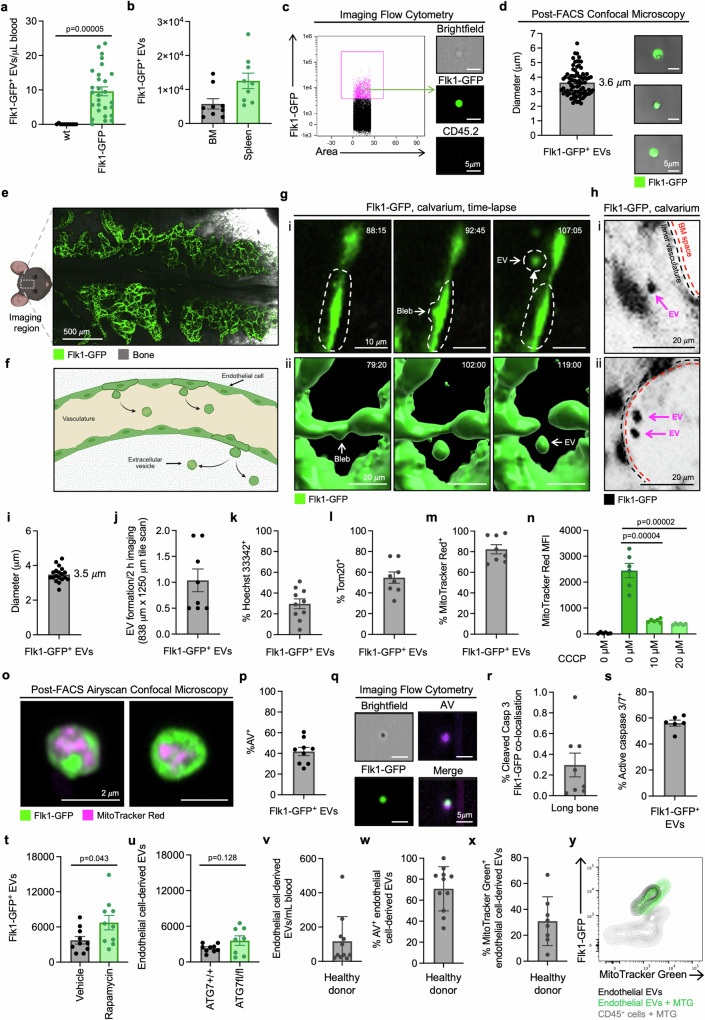
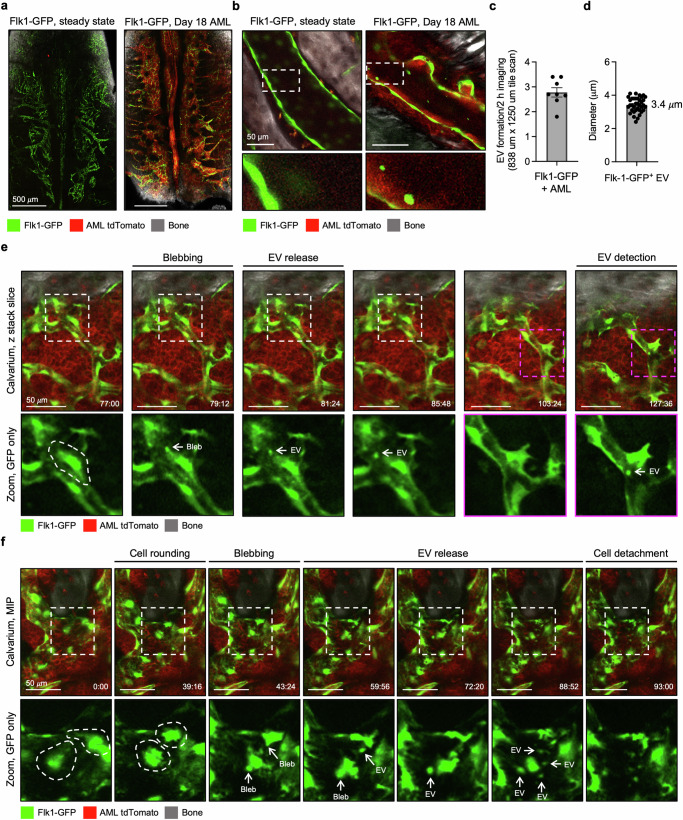
Endothelial cells are integral components of all vasculature within complex organisms. As they line the blood vessel wall, endothelial cells are constantly exposed to a variety of molecular factors and shear force that can induce cellular damage and stress. However, how endothelial cells are removed or eliminate unwanted cellular contents, remains unclear. The generation of large extracellular vesicles (EVs) has emerged as a key mechanism for the removal of cellular waste from cells that are dying or stressed. Here, we used intravital microscopy of the bone marrow to directly measure the kinetics of EV formation from endothelial cells in vivo under homoeostatic and malignant conditions. These large EVs are mitochondria-rich, expose the 'eat me' signal phosphatidylserine, and can interact with immune cell populations as a potential clearance mechanism. Elevated levels of circulating EVs correlates with degradation of the bone marrow vasculature caused by acute myeloid leukaemia. Together, our study provides in vivo spatio-temporal characterization of EV formation in the murine vasculature and suggests that circulating, large endothelial cell-derived EVs can provide a snapshot of vascular damage at distal sites.


Conflict of interest statement

The authors declare no competing interests.

Figures

Fig. 1
Fig. 1. Endothelial cells generate large, mitochondria-rich EVs under homoeostatic conditions.
a Quantification of steady-state levels of circulating GFP+ endothelial cell-derived EVs in Flk1-GFP+ and wt mice by flow cytometry (n = 11–28). b Absolute numbers of Flk1-GFP+ EVs in the BM (representative of one tibia/femur) and spleen (n = 9). c Representative imaging flow cytometry analysis of BM-derived Flk1-GFP+ EVs. Green = Flk1-GFP, Yellow = CD45.2. d Quantification of EV diameter and representative confocal microscopy of FACS-isolated BM-derived Flk1-GFP+ EVs. Data points represent individual EVs (n = 79). Green = Flk1-GFP. e Maximum Intensity Projection (MIP) of intravital microscopy tile scan data showing the imaging area within the BM calvarium of a Flk1-GFP+ mouse. Green = Flk1-GFP, Grey = SGH. f Schematic diagram of blood vessel architecture in the BM calvarium made with BioRender. g Representative time-lapse intravital microscopy data demonstrating endothelial cell blebbing and EV formation: (i) MIP and (ii) 3D rendering. Timestamp presented as min:s. Green = Flk1-GFP. h Intravital microscopy illustrating detection of EVs inside the calvarium vasculature (i) or marrow (ii). Black = Flk1-GFP. i Quantification of Flk1-GFP+ EV diameter from intravital microscopy images. Data points represent individual EVs (n = 19). j Quantification of EV formation rates during in situ time-lapse imaging. Data points represent the average number of EV formation events observed per 2 h of imaging per mouse (n = 8). Quantification of (k) DNA+ (Hoechst 33342, n = 10) and (l, m) mitochondria+ (Tom20, MitoTracker Red, n = 8) BM-derived Flk1-GFP+ EVs. n Quantification of MitoTracker Red in BM-derived Flk1-GFP+ EVs after CCCP treatment. Black bar represents unstained cells, green bars represent MitoTracker Red stained (n = 6, two independent repeats). o Representative Airyscan confocal microscopy of BM-derived Flk1-GFP+ EVs showing MitoTracker Red staining. Green = Flk1-GFP, magenta = MitoTracker Red FM. Quantification of Annexin V (AV) staining of BM-derived Flk1-GFP+ EVs by flow cytometry (p, n = 9) and imaging flow cytometry (q). r Quantification of cleaved caspase 3+ Flk1-GFP+ endothelial cells in long bone sections under steady-state conditions captured with dual confocal multiphoton microscopy (n = 8). s Quantification of caspase 3/7+ BM-derived Flk1-GFP+ EVs as measured by flow cytometry (n = 6). t Quantification of BM-derived Flk1-GFP+ EVs numbers following Rapamycin (4 mg/kg) or vehicle treatment (n = 10). u Endothelial cell-derived EV levels in wt (ATG7+/+;UBCCreERT2cre/+) and ATG7 floxed (ATG7fl/fl;UBCCreERT2Cre/+) mice (n = 8–9). Quantification of (v) Flk1+, CD144+, CD31+, CD133- endothelial cell-derived EV levels in healthy human peripheral blood (n = 10), and the proportion of (w) AV+ and (x, y) MitoTracker Green+ EVs (n = 8–10). Flk1, CD144 and CD31 are markers for endothelial cell, whereas CD133 is a marker for hematopoietic stem and progenitor cells. Data points represent individual donors. At least three independent experiments were performed for all experiments unless otherwise specified. Data points represent individual mice unless otherwise specified. Error bars represent SEM. Statistical analysis: Unpaired Student’s two-tailed t-test, *p < 0.05, ***p < 0.001.
Fig. 2
Fig. 2. Zebrafish generate large, endothelial cell-derived extracellular vesicles in vivo.
a Confocal microscopy tile scan of a kdrl-mCherry zebrafish embryo at 3 dpf highlighting the imaging area for time-lapse experiments. Magenta = kdrl-mcherry. b Representative images from time-lapse confocal microscopy data of kdrl-mCherry embryo shown as a Maximum Intensity Projection (MIP). Magenta = kdrl-mCherry c Quantification of kdrl-mCherry+ EV diameter from confocal microscopy experiments. Data acquired from n = 3 individual embryos, dots represent individual EVs (n = 65). d Quantification of the total number of kdrl-mCherry+ EVs per pool of dissociated wt or kdrl-mCherry zebrafish embryos. Each data point represents a pool of 10 embryos (n = 12–13). Quantification of Annexin V+ (AV) (e, n = 13), MitoTracker Green+ (f, n = 12)) and active caspase 3/7+ (g, n = 12) kdrl-mCherry+ EVs by flow cytometry. kdrl-mCherry embryos at 57 hpf were treated with CQ for 14 h and EVs were assessed by confocal microscopy (h, black = kdrl-mCherry) and flow cytometry (i). Data points represent a pool of 10 embryos (n = 11). Error bars represent SEM. Statistical analysis: Unpaired Student’s two-tailed t-test, *p < 0.05, ***p < 0.001. At least three independent experiments were performed for all experiments. DLVA dorsal longitudinal anastomotic vessel; SV segmental vein.
Fig. 3
Fig. 3. Endothelial cell-derived EVs interact with and are engulfed by immune cells.
a Representative confocal microscopy images demonstrating uptake of CypHer-5E labelled BM-derived Flk1-GFP+ EVs by J774 macrophages. Green = Flk1-GFP, magenta = CypHer-5E. b Representative flow cytometry data monitoring GFP fluorescence of CD45.2+ immune cells in bone marrow (BM) from wt and Flk1-GFP mice. Quantification of total GFP+ CD45.2+ immune cells (c) or immune cell subsets (d, e) in the blood, BM or spleen of Flk1-GFP mice (n = 12). BM data is representative of one tibia/femur. Dark grey = neutrophils, light grey = B cells, dark green = Ly6C monocytes, light green = Ly6C+ monocytes, dark blue = macrophages, light blue = dendritic cells, pink = natural killer cells, purple = T cells. f Confocal microscopy of BM-derived GFP+ CD45.2+ immune cells isolated by fluorescence-activated cell sorting. Green = Flk1-GFP. g Quantification of internal and external (peripheral) GFP+ puncta of confocal microscopy data in (f) (n = 3). h Representative imaging flow cytometry data of BM-derived GFP+ neutrophils (Ly6G+) and monocytes (Ly6C+). Green = Flk1-GFP, purple = Ly6C, pink = Ly6G. i Quantification of Annexin V (AV) binding to Flk1-GFP+ EVs in the blood, BM and spleen (n = 9). j Time course quantification of AV binding to blood-derived Flk1-GFP+ EVs during ex vivo incubation at 37°C (n=6–7). k Fold change in GFP+ CD45.2+ immune cells after incubation of wt BM with supernatant from Flk1-GFP BM in the context of recombinant AV blocking (n = 12). l Quantification of endothelial cell-derived EVs (Flk1+, CD31+, CD146, CD45.2, FSClow) in the blood, BM or spleen of MerTKfl/fl Cx3CR1+/+ or MerTKfl/fl Cx3CR1cre/+ mice (n = 6, two independent repeats). Error bars represent SEM. Statistical analysis: Unpaired Student’s two-tailed t-test, ns = p > 0.05, *p < 0.05, **p < 0.01, ***p < 0.001. At least three independent repeats were performed for all experiments unless otherwise specified. Data points represent individual mice.
Fig. 4
Fig. 4. AML elevates levels of circulating endothelial cell-derived EVs at late-stage disease.
Quantification of circulating Flk1-GFP+ EVs in steady state and AML-burdened mice at (a) 18–19 days post-transplantation (DPT, n = 12–30) and (b) at regular intervals following transplantation (n = 12–13). c Absolute number of Flk1-GFP+ EVs in the BM and spleen of steady-state or AML-burdened mice, 18 DPT (n = 8). BM data is representative of one tibia/femur. d Maximum intensity projection (MIP) of the calvarium endothelium in steady state or AML-burdened mice (17 and 21 DPT) showing endothelial cell loss. Green = Flk1-GFP, red = MLL-AF9 tdTomato. e Quantification of the total GFP pixel count of intravital microscopy data of the calvarium in steady state or AML-burdened mice, harvested at ethical endpoint (n = 8–10). f Quantification of dual confocal multiphoton microscopy of long bones harvested from steady-state or AML-burdened mice at ethical endpoint showing the mean GFP pixel count (i, n = 13–14) and vessel density (ii, n = 8). g Representative MIPs. Green = Flk1-GFP, red = MLL-AF9 tdTomato, grey = SGH. h, i NLO dual confocal multiphoton microscopy of cleaved caspase 3+ Flk1-GFP+ cells in steady state and AML-burdened long bone sections (18 DPT, n = 7–8). Images shown as MIP. Steady-state control data also shown in Fig. 1r. Green = Flk1-GFP, magenta = cleaved caspase 3. j Intravital microscopy of Annexin V+ (AV) endothelial cells and fragments in the calvarium of AML-burdened mice (18–21 DPT). Green = Flk1-GFP, red = MLL-AF9 tdTomato, grey = SGH, cyan = AV-BV605. Error bars represent SEM. Statistical analysis: Unpaired Student’s two-tailed t-test, ns = p > 0.05, *p < 0.05, **p < 0.01, ***p < 0.001. At least three independent repeats were performed for all experiments. Data points represent individual mice unless otherwise specified.
Fig. 5
Fig. 5. In vivo imaging of endothelial cell EV formation and cell fragmentation during AML.
a Representative calvarium Maximum Intensity Projection (MIP) of steady-state or AML-burdened Flk1-GFP mice. b MIP of time-lapse intravital microscopy analysis performed on individual blood vessels in steady state or AML-burdened mice (projection of merged images taken every 1 s for 5 min). c Quantification of EV formation by intravital microscopy of AML-burdened mice. Each data point represents the average number of EV formation events observed per 2 h of imaging per mouse (n = 8). d Quantification of Flk1-GFP+ EV diameter derived from intravital microscopy data. Each data point represents an individual EV (n = 37). e, f Example of Flk1-GFP+ cell blebbing and EV formation in AML-burdened mice. Timestamp presented as min:s. Error bars represent SEM. Statistical analysis: Unpaired Student’s two-tailed t-test, ns = p > 0.05, *p < 0.05, ***p < 0.001. At least three independent experiments were performed for all experiments. AML-burdened mice assessed at 18 days post-transplantation (DPT). For all microscopy images shown, green = Flk1-GFP, red = MLL-AF9 tdTomato and grey = SGH.
Fig. 6
Fig. 6. Circulating endothelial cell-derived EV numbers correlate with endothelial cell loss in blood malignancies.
Flk1-GFP mice were transplanted with either (a) EμMyc B cell lymphoma or (b) dsRed T cell leukaemia (T-ALL) that overexpresses Intracellular Notch (ICN) and circulating levels of Flk1-GFP+ EVs quantified by flow cytometry on 14 and 18 days post-transplantation (DPT), respectively (n = 9–12). Steady state control data also shown in Fig. 4a. cf Quantification of GFP+ pixels in the calvarium and long bones from EμMyc and T-ALL burdened mice at ethical endpoint (g, h) (n = 6–10). Representative images of the calvarium (g, h) and long bones (i, j). Data are shown as Maximum Intensity Projection (MIP) of whole organ, a zoomed section and 3D render for each condition. Error bars represent SEM. Statistical analysis: Unpaired Student’s two-tailed t-test, ns = p > 0.05, *p < 0.05, ***p < 0.001. At least three independent repeats were performed for all experiments unless otherwise specified. Data points represent individual mice unless otherwise specified. For all microscopy images shown, green = Flk1-GFP and grey = SGH.

References

    1. Lampugnani, M. G. et al. VE-cadherin regulates endothelial actin activating Rac and increasing membrane association of Tiam. Mol. Biol. Cell.13, 1175–1189 (2002). - PMC - PubMed
    1. Giannotta, M., Trani, M. & Dejana, E. VE-cadherin and endothelial adherens junctions: Aactive guardians of vascular integrity. Dev. Cell.26, 441–454 (2013). - PubMed
    1. Nelson, C. M., Pirone, D. M., Tan, J. L. & Chen, C. S. Vascular endothelial-cadherin regulates cytoskeletal tension, cell spreading, and focal adhesions by stimulating RhoA. Mol. Biol. Cell.15, 2943–2953 (2004). - PMC - PubMed
    1. Liebner, S., Cavallaro, U. & Dejana, E. The multiple languages of endothelial cell-to-cell communication. Arterioscler. Thromb. Vasc. Biol.26, 1431–1438 (2006). - PubMed
    1. Grellier, M. et al. Role of vascular endothelial growth factor in the communication between human osteoprogenitors and endothelial cells. J. Cell. Biochem.106, 390–398 (2009). - PubMed

Publication types

Substances