. 2024 Oct 22;15(1):9106.
doi: 10.1038/s41467-024-53376-1.

Modeling NK-cell lymphoma in mice reveals its cell-of-origin and microenvironmental changes and identifies therapeutic targets

Affiliations

Modeling NK-cell lymphoma in mice reveals its cell-of-origin and microenvironmental changes and identifies therapeutic targets

Junji Koya et al. Nat Commun. .

Abstract

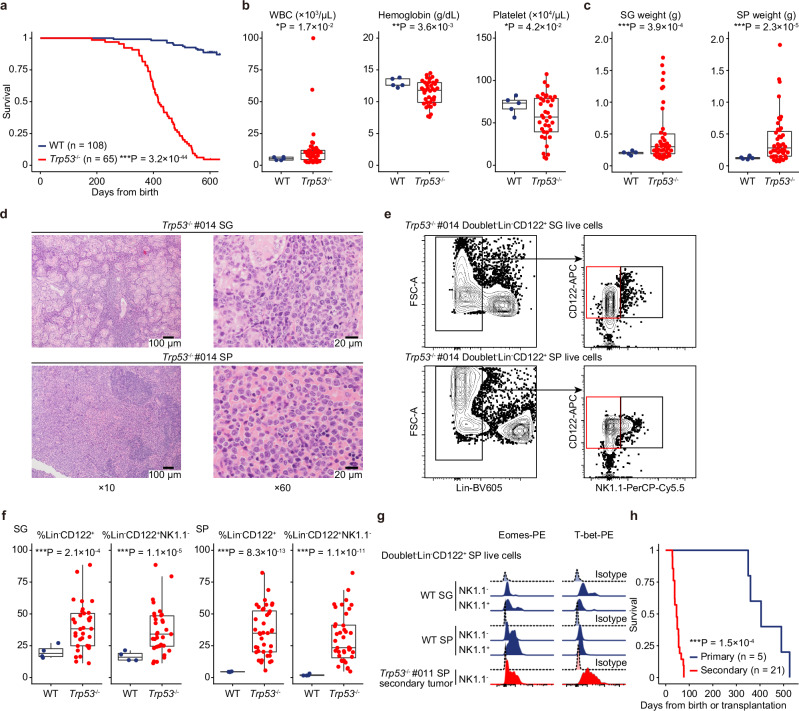
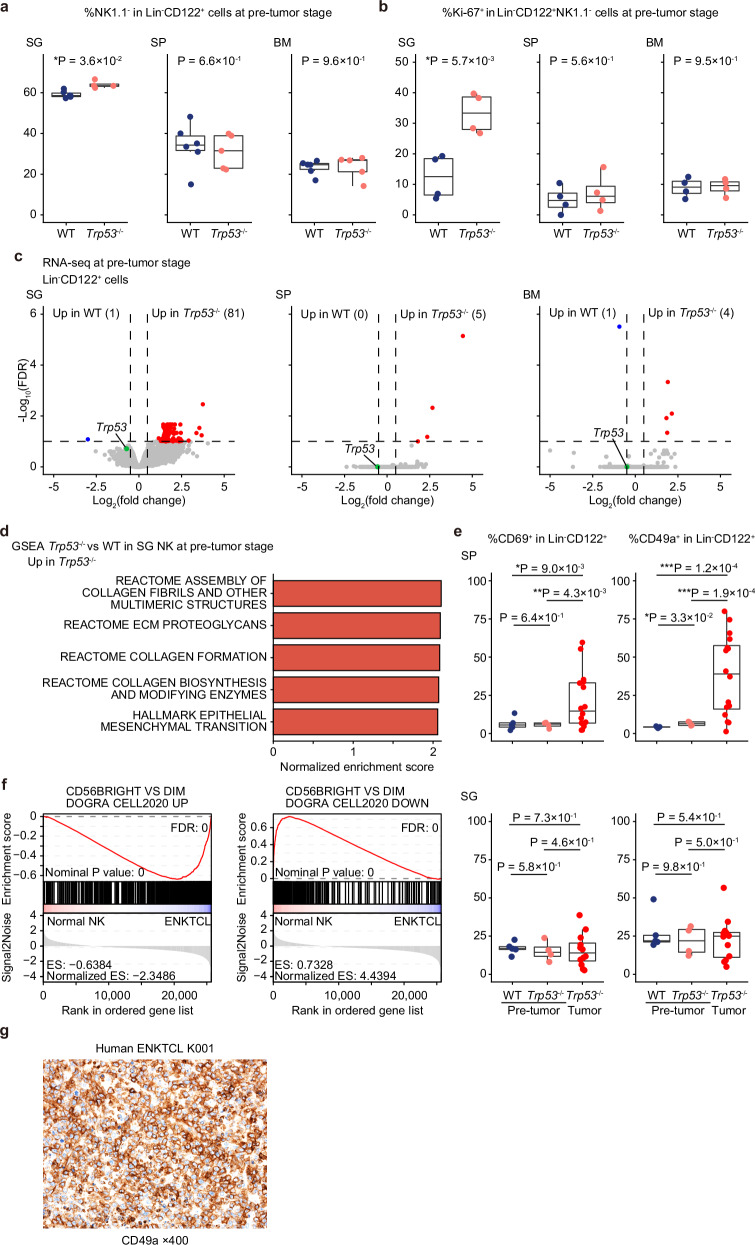
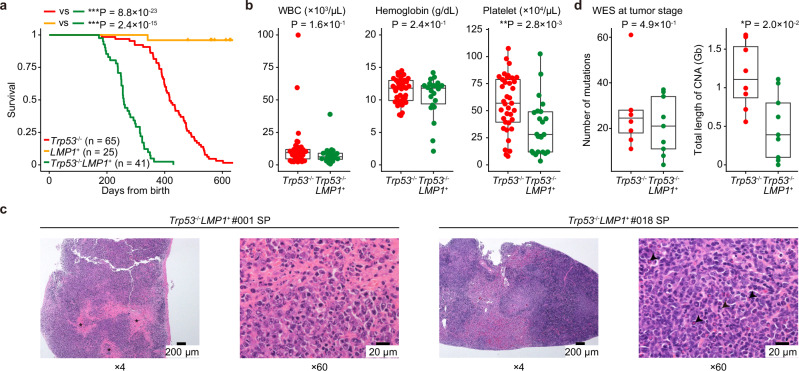
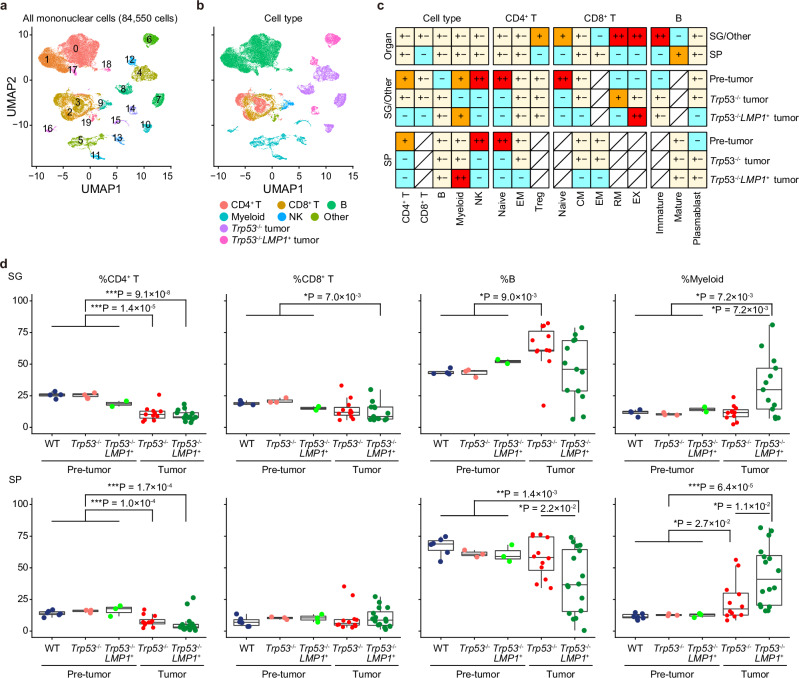
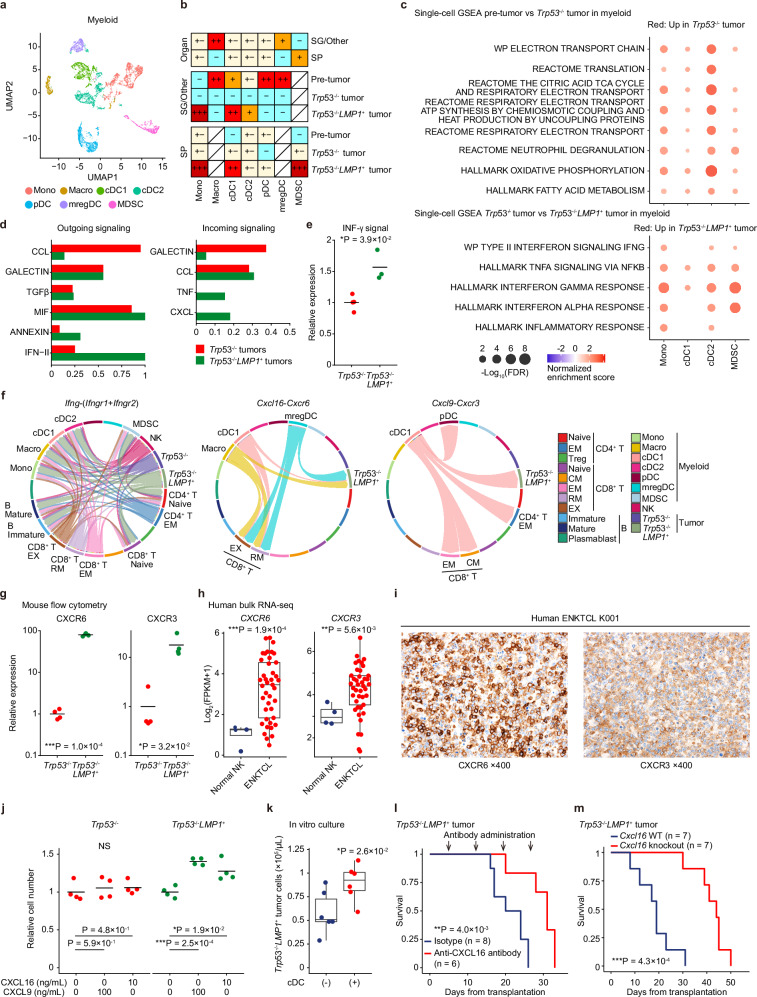
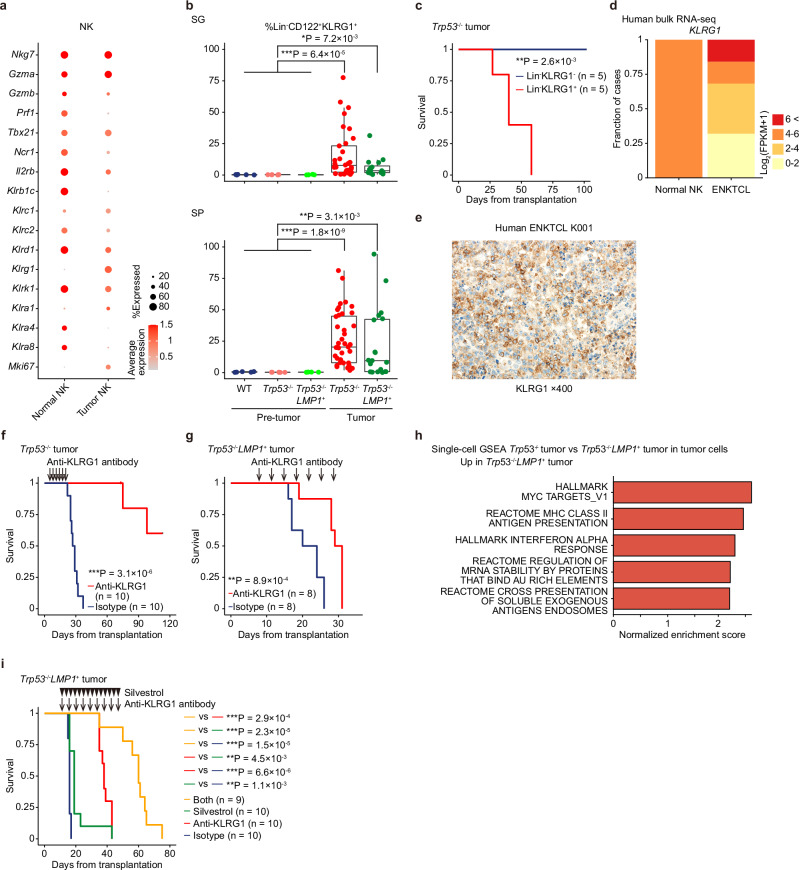
Extranodal NK/T-cell lymphoma (ENKTCL) is an Epstein-Barr virus (EBV)-related neoplasm preferentially involving the upper aerodigestive tract. Here we show that NK-cell-specific Trp53 disruption in mice leads to the development of NK-cell lymphomas after long latency, which involve not only the hematopoietic system but also the salivary glands. Before tumor onset, Trp53 knockout causes extensive gene expression changes, resulting in immature NK-cell expansion, exclusively in the salivary glands. Both human and murine NK-cell lymphomas express tissue-resident markers, suggesting tissue-resident NK cells as their cell-of-origin. Murine NK-cell lymphomas show recurrent Myc amplifications and upregulation of MYC target gene signatures. EBV-encoded latent membrane protein 1 expression accelerates NK-cell lymphomagenesis and causes diverse microenvironmental changes, particularly myeloid propagation, through interferon-γ signaling. In turn, myeloid cells support tumor cells via CXCL16-CXCR6 signaling and its inhibition is effective against NK-cell tumors in vivo. Remarkably, KLRG1-expressing cells expand in the tumor and are capable of repopulating tumors in secondary recipients. Furthermore, targeting KLRG1 alone or combined with MYC inhibition using an eIF4 inhibitor is effective against NK-cell tumors. Therefore, our observations provide insights into the pathogenesis and highlight potential therapeutic targets, including CXCL16, KLRG1, and MYC, in ENKTCL, which can help improve its diagnostic and therapeutic strategies.


Conflict of interest statement

The authors declare no competing interests.

Figures

Fig. 1
Fig. 1. Targeted disruption of Trp53 causes NK-cell lymphomas after long latency.
a Kaplan–Meier survival curves of WT (n = 108) and Trp53/ (n = 65) mice. Log-rank test. b CBC in PB of WT (n = 5 at 60 weeks old) and Trp53/ (n = 37 at tumor onset) mice. c SG and SP weights of WT (n = 5 at 60 weeks old) and Trp53/ (n = 41 at tumor onset) mice. d Representative images of hematoxylin and eosin staining of Trp53/ tumors in SG and SP. e Representative plots of immature NK cells (LinCD122+NK1.1) in Trp53/ tumors in SG and SP. f Proportion of LinCD122+, and LinCD122+NK1.1 cells in SG (n = 4) and SP (n = 4) from WT (at 60 weeks old) and in SG (n = 33) and SP (n = 40) from Trp53/ (at tumor onset) mice. g Representative histograms of Eomes and T-bet expression in LinCD122+NK1.1 and LinCD122+NK1.1+ cells in SG and SP from WT mice (at 8 weeks old) and Trp53/ secondary tumors in SP. Isotype controls are shown as shaded histograms. h Kaplan–Meier survival curves of secondary mice (n = 21) transplanted with 1 × 106 Trp53/ tumor cells compared with the corresponding primary mice. (n = 5). Log-rank test. b, c, and f Box plots show medians (lines), IQRs (boxes), and ±1.5× IQR (whiskers). *P < 0.05, **P < 0.005, ***P < 0.0005, two-sided Welch’s t-test. a, b, c, f, and h Source data are provided as a Source Data file.
Fig. 2
Fig. 2. Differential effects of Trp53 disruption on NK cells across tissues at the pre-tumor stage.
a Proportion of NK1.1 cells in LinCD122+ cells in SG, SP, and BM from WT (n = 6) and Trp53/ (n = 5) mice (at 8 weeks old). b Proportion of Ki-67+ cells in LinCD122+NK1.1 cells in SG, SP, and BM from WT (n = 4) and Trp53/ (n = 4) mice (at 8 weeks old). c Volcano plots showing differentially expressed genes between WT and Trp53/ LinCD122+ NK cells in SG, SP, and BM (at 8 weeks old). Genes with FDR < 0.1 and |log2(fold change)| ≥ 0.5 are considered significant and colored red (upregulated) or blue (downregulated). d The top five upregulated signatures in GSEA analysis of expression data comparing WT (n = 5) and Trp53/ (n = 3) LinCD122+ NK cells in SG (at 8 weeks old). Signatures with FDR < 0.25 are considered significant. e Proportion of CD69+ and CD49a+ cells in LinCD122+ NK cells in SG (n = 5 at 8 weeks old) and SP (n = 5 at 8 weeks old) from WT and in SG (n = 6 at 8 weeks old and n = 12 at tumor onset) and SP (n = 6 at 8 weeks old and n = 16 at tumor onset) from Trp53/ mice. f Significant enrichment of tissue-resident (left) and circulating (right) NK-cell signatures in GSEA analysis of expression data comparing human normal NK cells (n = 4) and ENKTCL tumors (n = 41). g Representative image of CD49a immunostaining in a human ENKTCL sample. a, b, and e, Box plots show medians (lines), IQRs (boxes), and ±1.5× IQR (whiskers). *P < 0.05, **P < 0.005, ***P < 0.0005, two-sided Welch’s t-test. No adjustments were made for multiple comparisons. Source data are provided as a Source Data file.
Fig. 3
Fig. 3. Combined effects of Trp53 loss and LMP1 expression on normal and malignant NK cells.
a Kaplan–Meier survival curves of Trp53/ (n = 65), LMP1+ (n = 25), and Trp53/LMP1+ (n = 41) mice. Log-rank test. No adjustments were made for multiple comparisons. Trp53/ data are the same as in Fig. 1a. b CBC in PB of Trp53/ (n = 37) and Trp53/LMP1+ (n = 22) mice (at tumor onset). Trp53/ data are the same as in Fig. 1b. c Representative image of hematoxylin and eosin staining of Trp53/LMP1+ tumors in SP. Asterisks and arrowheads show coagulative necrosis and myeloid infiltration, respectively. d Number of somatic mutations and total length of CNAs per sample in Trp53/ (n = 7) and Trp53/LMP1+ (n = 9) tumors detected by WES. b, d Box plots show medians (lines), IQRs (boxes), and ±1.5× IQR (whiskers). *P < 0.05, **P < 0.005, ***P < 0.0005, two-sided Welch’s t-test. a, b, and d Source data are provided as a Source Data file.
Fig. 4
Fig. 4. Single-cell analysis reveals dynamic changes in the tumor microenvironment in NK-cell tumors.
a UMAP plot of 84,550 CD45+ mononuclear cells from SG and SP of WT (n = 1) and Trp53/ (n = 1) mice at the pre-tumor stage (at 8 weeks old), Trp53/ tumors in SG (n = 3) and SP (n = 6), and Trp53/LMP1+ tumors in other sites (n = 2) and SP (n = 2). Seven malignant and 13 nonmalignant clusters are shown in different colors. b UMAP plot (same as a) colored by cell type. c The distribution of broad and specific cell types in each group in SG and SP revealed by Ro/e analysis (ratio of observed cell number to expected cell number). ++, 2 ≤ Ro/e < 3; +, 1.5 ≤ Ro/e < 2; +/−, 0.67 ≤ Ro/e < 1.5; −, 0 ≤ Ro/e < 0.67. d Proportion of CD4+ T, CD8+ T, B, and myeloid cells from SG (n = 4) and SP (n = 6) of WT, SG (n = 3) and SP (n = 3) of Trp53/, and SG (n = 2) and SP (n = 3) of Trp53/LMP1+ mice at the pre-tumor stage (at 8 weeks old), Trp53/ tumors in SG (n = 11) and SP (n = 12), and Trp53/LMP1+ tumors in SG (n = 13) and SP (n = 16). Proportion in nonmalignant cells is shown for tumor-bearing mice. Box plots show medians (lines), IQRs (boxes), and ±1.5× IQR (whiskers). *P < 0.05, **P < 0.005, ***P < 0.0005, two-sided Welch’s t-test. Only significant P values (<0.05) are shown. No adjustments were made for multiple comparisons. Source data are provided as a Source Data file.
Fig. 5
Fig. 5. LMP1 causes prominent myeloid propagation supporting malignant NK-cell proliferation.
a UMAP plot of subclustering of myeloid cells. b The distribution of myeloid subclusters in each group in the extranodal tissues and SP revealed by Ro/e analysis. +++ indicates Ro/e ≥ 3; ++, 2 ≤ Ro/e < 3; +, 1.5 ≤ Ro/e < 2; +/−, 0.67 ≤ Ro/e < 1.5; −, 0 ≤ Ro/e < 0.67. c GSEA analysis of scRNA-seq data comparing each myeloid cell subcluster from pre-tumor samples (SG and SP from WT and Trp53/ mice) and Trp53/ tumor samples (top) and from Trp53/ and Trp53/LMP1+ tumor samples (bottom). Signatures significant (FDR < 0.1) across at least two subclusters are shown. d Comparison of outgoing and incoming signals between Trp53/ and Trp53/LMP1+ tumors in CellChat analysis. e Relative IFN-γ expressions in LinCD122+ cells from Trp53/ (n = 4) and Trp53/LMP1+ (n = 3) tumors by intracellular flow cytometry. f Chord diagram of Ifng-(Ifngr1+Ifngr2) (left), Cxcl16-Cxcr6 (middle), and Cxcl9-Cxcr3 (right) signaling network across subclusters in Trp53/ and Trp53/LMP1+ tumors. g Relative CXCR6 (left) and CXCR3 (right) expressions in LinCD122+ cells from Trp53/ (n = 4) and Trp53/LMP1+ (n = 4) tumors by flow cytometry. h CXCR6 (left) and CXCR3 (right) gene expressions in human normal NK cells (n = 4) and ENKTCL tumors (n = 41) by RNA-seq. i Representative images of CXCR6 (left) and CXCR3 (right) immunostaining in a human ENKTCL sample. j Relative cell number of Trp53/ and Trp53/LMP1+ tumor cells 48 h after CXCL16 or CXCL9 treatment at indicated concentrations (n = 4). k The number of Trp53/LMP1+ tumor cells after one week of co-culture with and without cDC (n = 6). l Kaplan–Meier survival curves of mice transplanted with 5 × 105 Trp53/LMP1+ tumor cells and administered with anti-CXCL16 antibody (n = 6) or isotype control (n = 8). Log-rank test. m Kaplan–Meier survival curves of WT or Cxcl16 knockout mice transplanted with 5 × 105 Trp53/LMP1+ tumor cells and administered with control vehicle or anti-KLRG1 antibody (n = 7 per group). Log-rank test. g, j lines show means. h, k Box plots show medians (lines), IQRs (boxes), and ±1.5× IQR (whiskers). e, g, h, j, and k NS: not significant, *P < 0.05, **P < 0.005, ***P < 0.0005, two-sided Welch’s t-test. No adjustments were made for multiple comparisons. e, g, h, and jm Source data are provided as a Source Data file.
Fig. 6
Fig. 6. KLRG1 and MYC as potential therapeutic targets in NK-cell neoplasms.
a Bubble plot comparing NK-cell gene expressions between normal and malignant (Trp53/ and Trp53/LMP1+) NK cells in scRNA-seq data. b Proportion of LinCD122+KLRG1+ cells in SG and SP from WT (n = 5 at 8 weeks old), Trp53/ (n = 6 at 8 weeks old and n = 40 at tumor onset), and Trp53/LMP1+ (n = 4 at 8 weeks old and n = 19 at tumor onset) mice. Box plots show medians (lines), IQRs (boxes), and ±1.5× IQR (whiskers). *P < 0.05, **P < 0.005, ***P < 0.0005, two-sided Welch’s t-test. Only significant P values (<0.05) are shown. No adjustments were made for multiple comparisons. c Kaplan–Meier survival curves of mice transplanted with 2 × 104 LinKLRG1 (n = 5) and LinKLRG1+ (n = 5) cells from Trp53/ NK-cell tumors. Log-rank test. d Proportion of human normal NK (n = 4) and ENKTCL samples (n = 41) classified by KLRG1 expression in RNA-seq. e Representative image of KLRG1 immunostaining in a human ENKTCL sample. f, g Kaplan–Meier survival curves of mice transplanted with 5×10⁵ Trp53/ (f) or Trp53/LMP1+ tumor cells (g) and administered with anti-KLRG1 antibody or isotype control (n = 10 and n = 8 for Trp53/ and Trp53/LMP1+, respectively). Log-rank test. h, GSEA analysis of scRNA-seq data comparing Trp53/ and Trp53/LMP1+ malignant NK cells. Top five upregulated signatures in Trp53/LMP1+ malignant NK cells are shown. Signatures with FDR < 0.25 are considered significant. i Kaplan–Meier survival curves of mice transplanted with 5 × 105 Trp53/LMP1+ tumor cells and administered with control vehicle, silvestrol, anti-KLRG1 antibody, or both (n = 10 for control, silvestrol, and anti-KLRG1 antibody; n = 9 for both). Log-rank test. No adjustments were made for multiple comparisons. b, c, f, g, and i Source data are provided as a Source Data file.

References

    1. S. H. Swerdlow, et al. WHO Classification of Tumours of Haematopoietic and Lymphoid Tissues (International Agency for research on cancer, 2017).
    1. Tse, E., Zhao, W.-L., Xiong, J. & Kwong, Y.-L. How we treat NK/T-cell lymphomas. J. Hematol. Oncol.15, 74 (2022). - PMC - PubMed
    1. Yamaguchi, M., Suzuki, R. & Oguchi, M. Advances in the treatment of extranodal NK/T-cell lymphoma, nasal type. Blood131, 2528–2540 (2018). - PubMed
    1. Münz, C. Latency and lytic replication in Epstein-Barr virus-associated oncogenesis. Nat. Rev. Microbiol17, 691–700 (2019). - PubMed
    1. de Mel, S., Hue, S. S., Jeyasekharan, A. D., Chng, W. J. & Ng, S. B. Molecular pathogenic pathways in extranodal NK/T cell lymphoma. J. Hematol. Oncol.12, 33 (2019). - PMC - PubMed

Publication types

MeSH terms

LinkOut - more resources