. 2024 Oct 22;15(1):9093.
doi: 10.1038/s41467-024-53414-y.

Preexisting risk-avoidance and enhanced alcohol relief are driven by imbalance of the striatal dopamine receptors in mice

Affiliations

Preexisting risk-avoidance and enhanced alcohol relief are driven by imbalance of the striatal dopamine receptors in mice

Miriam E Bocarsly et al. Nat Commun. .

Abstract

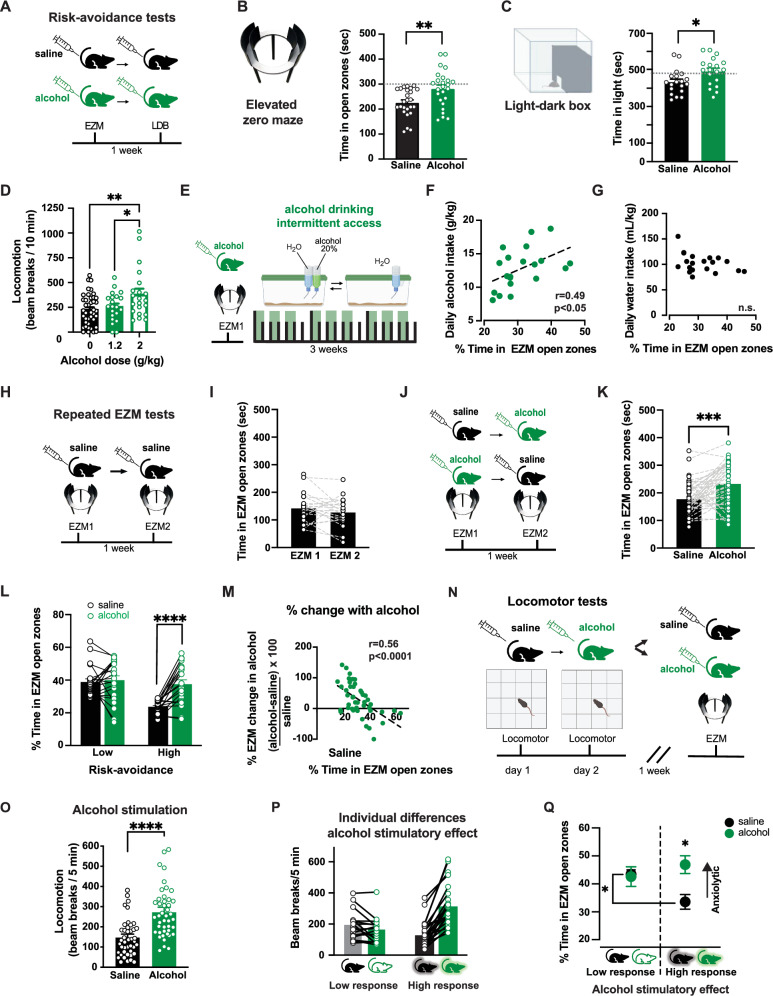
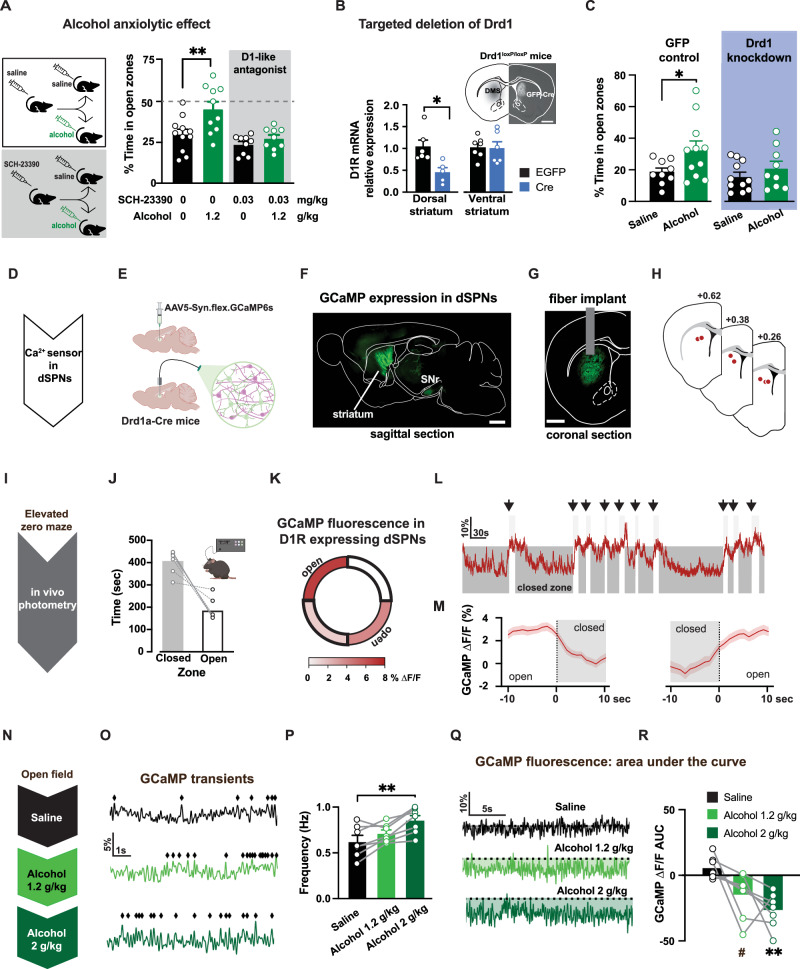
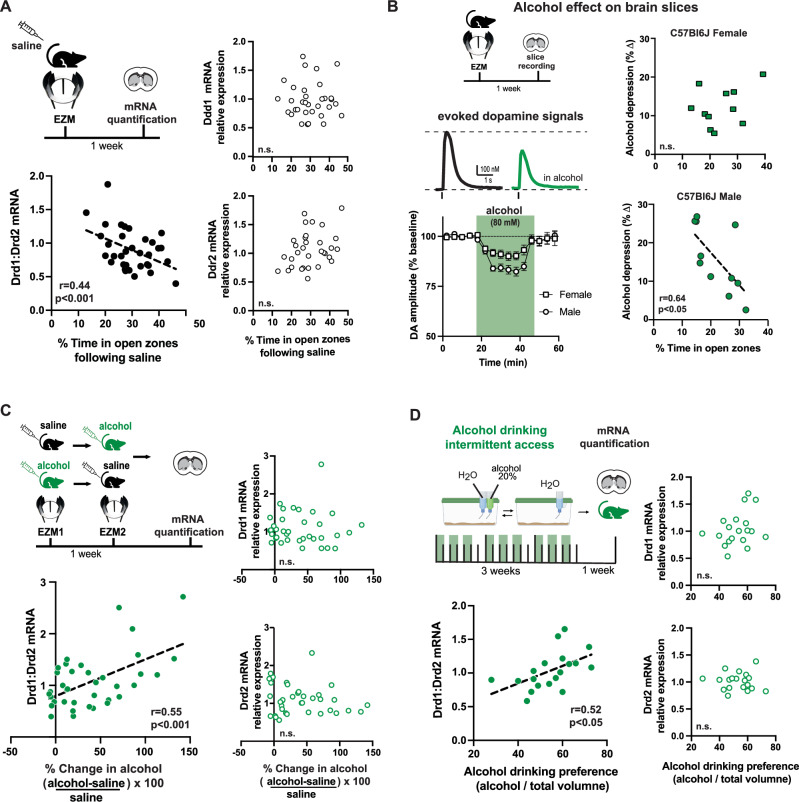
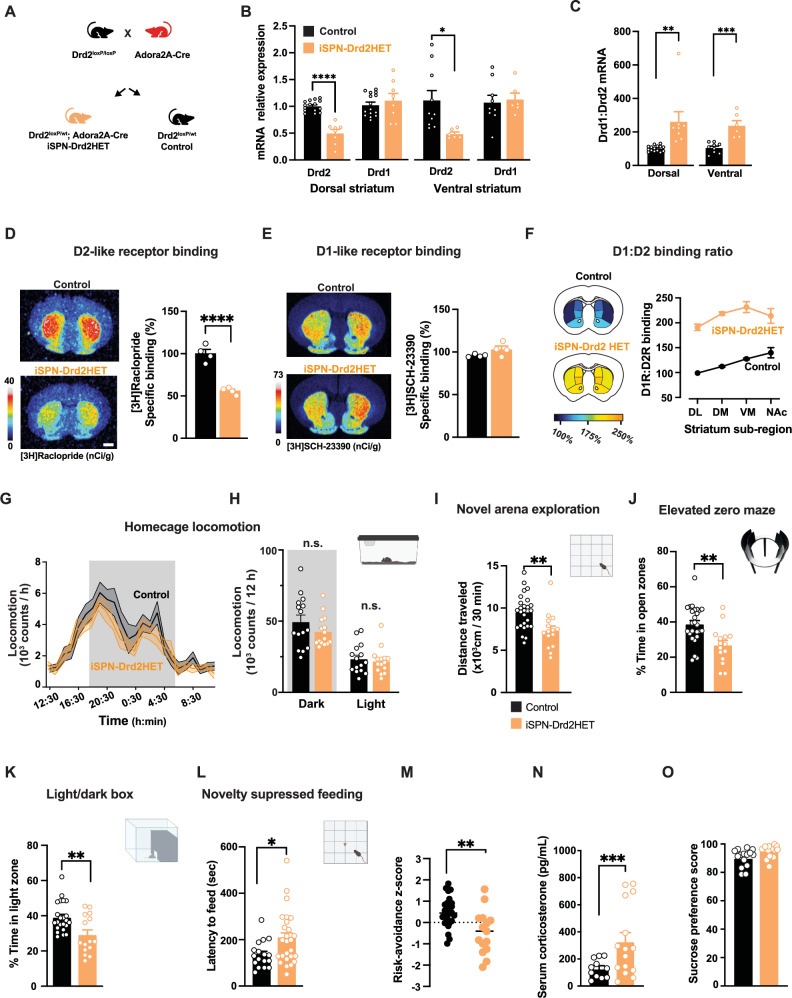
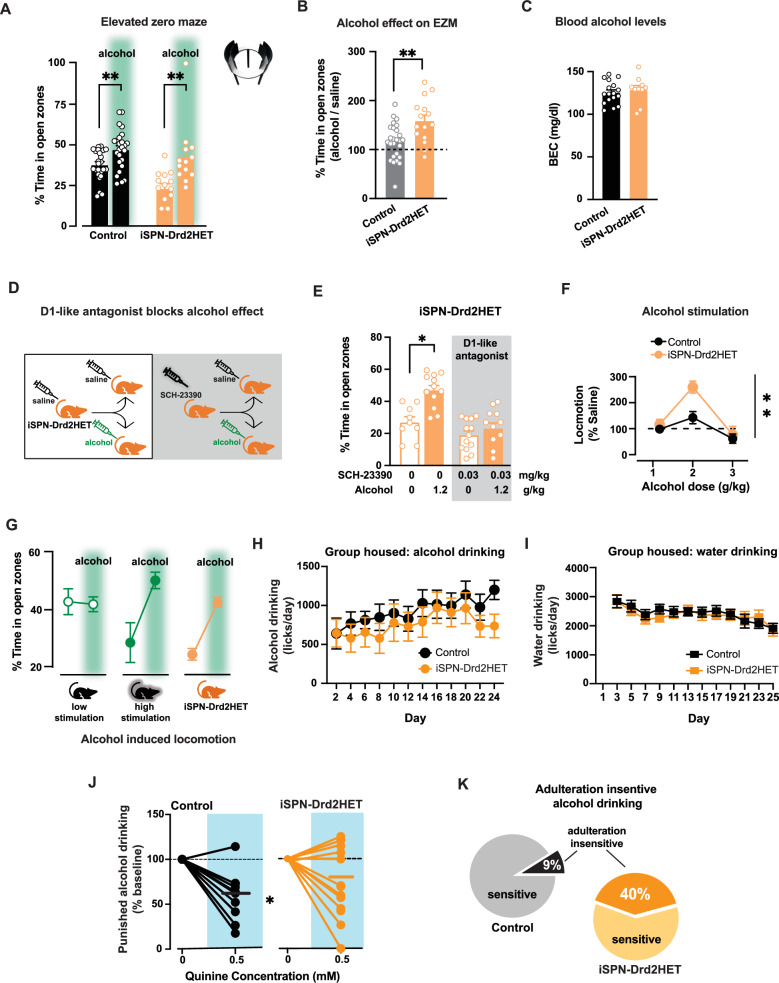
Alcohol use disorder (AUD) is frequently comorbid with anxiety disorders, yet whether alcohol abuse precedes or follows the expression of anxiety remains unclear. Rodents offer control over the first drink, an advantage when testing the causal link between anxiety and AUD. Here, we utilized a risk-avoidance task to determine anxiety-like behaviors before and after alcohol exposure. We found that alcohol's anxiolytic efficacy varied among inbred mice and mice with high risk-avoidance showed heightened alcohol relief. While dopamine D1 receptors in the striatum are required for alcohol's relief, their levels alone were not correlated with relief. Rather, the ratio between striatal D1 and D2 receptors was a determinant factor for risk-avoidance and alcohol relief. We show that increasing striatal D1 to D2 receptor ratio was sufficient to promote risk-avoidance and enhance alcohol relief, even at initial exposure. Mice with high D1 to D2 receptor ratio were more prone to continue drinking despite adverse effects, a hallmark of AUD. These findings suggest that an anxiety phenotype may be a predisposing factor for AUD.


Conflict of interest statement

M.M. has received research funding from AstraZeneca, Redpin Therapeutics, Attune Neuroscience, and Dompé farmaceutici. All other authors report no competing interest.

Figures

Fig. 1
Fig. 1. Individual variation in the expression of anxiety-like behaviors and relief by alcohol in C57BL/6J mice.
A Experimental design for C57BL/6J mice. B, C Time spent in EZM open zones (two-tailed t-test t(48) = 3.0, p = 0.004, n = 25 mice/group) and LDB (t(36) = 2.5, p = 0.017, n = 19 mice/group) for mice receiving saline (black) or 1.2 g/kg alcohol (green). Symbols represent individual mice data; bars and lines represent mean ± SEM of each group. D Locomotor assessment after saline, 1.2, or 2 g/kg alcohol. Only 2 g/kg alcohol significant increased beam breaks compared to saline (p = 0.007) and to 1.2 g/kg alcohol (p > 0.05; 1-Way ANOVA F(2,80) = 5.27, n = 40 saline mice, 21 mice with 1.2 g/kg and 21 mice with 2 g/kg). Symbols represent individual mice data; bars and line represent mean ± SEM of each group. E Mice were tested on EZM after alcohol (1.2 g/kg) followed by 2-bottle intermittent alcohol drinking task. F Positive correlation between EZM performance after alcohol and voluntary alcohol intake (linear regression fit F(1,17) = 5.82, p = 0.027, n = 19 mice). G No correlation was found between EZM performance and water intake (linear regression fit F(1,17) = 2.73, p > 0.05, n = 19 mice). H Mice were tested on EZM twice following saline, one week apart. I EZM performance was similar across saline tests (two-tailed t-test t(20) = 1.31, p = 0.21, n = 21 mice). J, K Separate cohort tested twice on EZM following saline (black) or alcohol (1.2 g/kg; green), using within-subjects counterbalanced design. Time in EZM open zones was higher after alcohol than saline (two-tailed t-test t(42) = 4.23, p = 0.0001, n = 43). L Median split of time spent in EZM open zones after saline (173 s) was used to sort mice into “high” and “low” risk-avoidance groups. Only “high” group shows increased time in EZM open zone following alcohol compared to saline (RM 2-way ANOVA Group x Alcohol interaction: F(1,41) = 11.13, p = 0.002; main effect of Alcohol and Group: Fs(1,41) < 13.22 p = 0.0003, post hoc test p < 0.0008; n = 43). Symbols represent individual mice data; bars and lines represent mean ± SEM of each group. M Inverse correlation between time spent in EZM open zones after saline and percent change in time after alcohol (linear regression fit F(1,41) = 18.74, p < 0.0001, n = 43). Symbols represent individual mice data. N Mice were tested in locomotor boxes after saline and 2 g/kg alcohol and then tested on EZM following saline OR alcohol (1.2 g/kg). O Beam-breaks in locomotor boxes were higher following alcohol than saline (two-tailed t-test t(43) = 5.24, p < 0.0001, n = 44 mice). Symbols represent individual mice data; bars and lines represent mean ± SEM of each group. P Low response mice show no increase after alcohol and high response mice show increase (RM 2-way ANOVA Drug x Group interaction: F(1,42) = 25.58, p < 0.0001; post-hoc test Saline vs Alcohol locomotion p < 0.0001 in “high” group, n = 28 mice and p > 0.05 in “low” group; n = 16 mice). Symbols represent individual mice data; bars and lines represent mean ± SEM of each group. Q Low response mice showed similar EZM performance after saline and 1.2 g/kg alcohol. High response mice showed less time in EZM open zones after saline than low response and time in open is increased after 1.2 g/kg alcohol compared to saline (RM 2-way ANOVA group x EZM interaction: F(1,42) = 4.52, p = 0.039; the difference in saline EZM between low vs high t(20) = 2.10, p = 0.049, n = 22 mice; difference in saline vs alcohol in high response mice t(26) = 3.19, p = 0.004, n = 28 mice). Symbols and line represent mean ± SEM of each group. For all panels, *p < 0.05, **p < 0.01, ****p < 0.0001. Cartoons in panels (B, C, N) are modified BioRender template license Alvarez, V. (2024) BioRender.com/m14d797.
Fig. 2
Fig. 2. Open zone exploration engages striatal projection neurons expressing D1R, which are required for alcohol’s anxiolytic effect.
A Mice were pre-treated with saline or dopamine D1-like antagonist SCH-23390 (0.03 mg/kg) and tested on the EZM after alcohol (1.2 g/kg) or saline (2-way ANOVA pretreatment x EZM drug interaction: F(1,37) = 17.06, p = 0.0002, n = 39 mice). Only saline pre-treated mice showed differences in EZM performance between saline and alcohol (post hoc Sidak test p < 0.01, n = 10,11 mice/group). SCH-23390 pre-treated mice showed similar EZM performance (post hoc Sidak test p > 0.05; n = 9 mice/group). B Drd1 mRNA levels in dorsal and ventral striatum from Drd1loxP/loxP mice with bilateral intracranial injections of either EGFP- or Cre-expressing vectors in dorsomedial striatum. Lower Drd1 mRNA levels in dorsal, but not ventral, striatum of mice with Cre-vector compared to EGFP (dorsal: t(9) = 3.10, p = 0.013, ventral: t(9) = 0.26, p = 0.801, n = 6 mice/group, t-test). Inset, Fluorescent image of coronal section showing Cre expression in dorsal striatum of Drd1loxP/loxP mice. Scale bar is 1 mm. C Mice expressing Cre in dorsal striatum displayed similar EZM performance after alcohol (1.2 g/kg) compared to saline (2-way ANOVA F(3,41) = 3.60, p = 0.021; post hoc Sidak test saline vs. alcohol: p = 0.03 control EGFP mice and p > 0.05 for Cre-expressing mice; n = 9,11,11,9 mice/group). D, E Ca2+ sensor GCaMP6s expressed in D1R-containing neurons in dorsal striatum of Drd1a-Cre mice. Cartoon made from modified BioRender template (license Alvarez, V. 2024 BioRender.com/f17i932) F, G Fluorescent images of sagittal and coronal sections showing on left GCaMP6s expression in dorsal striatum and axon projections in substantia nigra (SNr) and on right, the placement of photometry fiber relative to GCaMP expression. Similar images were repeatedly and independently obtained from the six mice used in this experiment. Scale bar is 1 mm. H Fiber placement locations obtained from postmortem histology. I Fiber photometry measurements of GCaMP6s signals were made while mice were tested in the EZM. J Mice with fiber implants spent less time in the open than closed zones (n = 6 mice). KM ΔF/F signals were higher during the exploration of open zones compared to closed (n = 6 mice). N GCaMP6s ΔF/F signals were measured after mice received increasing doses of alcohol (0, 1.2 and 2 g/kg). O, P Increased frequency of transients were observed as alcohol concentration increased (RM 1-way ANOVA F(2,12) = 8.62, p < 0.01; post hoc Tukey test saline vs. 2 g/kg alcohol, p = 0.005, n = 6). Q, R Overall GCaMP fluorescence dropped after alcohol (RM 1-way ANOVA main effect of Dose: F(2,12) = 7.85, p = 0.007; post hoc Tukey test saline vs 2 g/kg alcohol p = 0.007;saline vs 1.2 g/kg alcohol p = 0.06, n = 6 mice). Data presented as mean ± SEM, #p = 0.06, *p < 0.05, **p < 0.01.
Fig. 3
Fig. 3. High ratio of striatal Drd1 over Drd2 mRNA expression is associated with risk-avoidance, stronger alcohol relief and high alcohol preference.
A Mice were tested on EZM after saline and striatal samples collected for mRNA quantification. Neither Drd1 nor Drd2 mRNA levels in the striatum were correlated with EZM performance (linear regression fit Drd1: F(1,32) = 1.06, p = 0.311 and Drd2: F(1,32) = 2.47, p = 0.1259). The ratio of Drd1/Drd2 mRNA showed negative correlation with time in EZM open zones (F(1,32) = 7.59, p < 0.00096, n = 34). B Mice were tested on EZM and striatal brain slices were prepared for in vitro analysis of alcohol’s effect on evoked dopamine. Sample traces of evoked dopamine signals at baseline (black) and after application of 80 mM alcohol (green). Time course of the change in amplitude of evoked dopamine in slices from male (circle) and female (square) mice. Symbols and lines represent mean ± SEM of evoked dopamine amplitude normalized to baseline before alcohol application. Male mice showed larger depression of evoked dopamine than females (RM 2-way ANOVA significant interaction Alcohol x Sex F(14,420) = 3.51 p < 0.0001, n = 14,18 slices; 11 mice/sex). While there was no relationship between EZM performance and alcohol’s in vitro effect on dopamine in females, an inverse relationship was found in males (linear regression fit male: F(1,9) = 7.51, p = 0.023, n = 11 males; female: F(1,10) = 2.1, p = 0.178, n = 12 females). C Following repeated EZM experiments (Fig. 1I), striatal tissue samples were collected for assessment of Drd1 and Drd2 mRNA levels. While neither Drd1 nor Drd2 mRNA levels were correlated with EZM performance following alcohol (linear regression fit Drd1: F(1,35) = 2.19, p = 0.148; Drd2: F(1,35) = 0.97, p = 0.331), the ratio of Drd1/Drd2 was correlated with EZM performance following alcohol (F(1,35) = 15.10, p < 0.0004, n = 36 mice). D Mice were given access to 20% alcohol for 3 weeks on two-bottle choice task, and dorsal striatal tissue collected for mRNA quantification. While neither Drd1 levels nor Drd2 mRNA levels were correlated with alcohol drinking preference (linear regression fits Drd1: F(1,17) = 1.94, p = 0.182; Drd2: F(1,17) = 0.02, p = 0.889), the ratio of Drd1/Drd2 was correlated with alcohol preference (F(1,17) = 6.29, p = 0.023, n = 19 mice). EZM and cage cartoons in panels (A, B, C, D) are modified BioRender template license Alvarez, V. (2024) BioRender.com/m14d797.
Fig. 4
Fig. 4. Generation of mice with high ratio of striatal D1 over D2 receptor availability promoted expression of risk-avoidance phenotype.
A Mice with low levels of striatal dopamine D2R (iSPN-Drd2HET) and littermate controls were generated by breeding Drd2loxP/loxP with Adora-2A-Cre mice. B iSPN-Drd2HET showed decreased Drd2 mRNA in dorsal and ventral striatum, but no significant change in Drd1 mRNA (2 W ANOVA dorsal striatum: receptor x genotype interaction F(1,21) = 39.36, p < 0.0001, main effect of receptor type F(1,21) = 43.34, p < 0.0001 and genotype F(1,21) = 6.62, p = 0.018, n = 8,15 mice/group; ventral striatum: receptor x genotype interaction F(1,13) = 7.47, p = 0.017, main effect of receptor type F(1,13) = 7.31, p = 0.018, n = 6,9,10 mice/group). C Drd1/Drd2 mRNA ratio is higher in iSPN-Drd2HET (orange) compared to littermate controls (black), both in dorsal and ventral striatum (main effect of genotype (2-way ANOVA main effect of genotype F(1,34) = 26.49, p < 0.0001; dorsal: t(21) = 3.73, p = 0.001, n = 8–15 mice/genotype and ventral: t(13) = 4.97, p = 0.0003, n = 6–10 mice/genotype). D, E Representative saturation plots of D2-like ligand [3H]raclopride (D) and D1-like ligand [3H]SCH-23391 E binding to coronal brain sections from control (black) and iSPN-Drd2HET mice (orange; scale bar is 1 mm). Bar graphs show specific binding quantification across replicates (t-test control vs. iSPN-Drd2HET: t(6) = 9.73, p < 0.0001 for raclopride; t(6) = 1.90, p = 0.106 for SCH-23390; n = 4/genotype). F Ratio of ligand binding for D1-like and D2-like ligands in iSPN-Drd2HET and littermate control mice (n = 4 mice/genotype). G Locomotion in the home cage is similar for iSPN-Drd2HET (orange) and littermate control mice (black) over 24-hours (RM 2-way ANOVA F(23,644) = 0.73, p > 0.05). Data collapsed cross “light” and “dark” phase of light-cycle are also similar (H) RM 2-way ANOVA F(1,28) = 1.76, p > 0.05, n = 15/genotype). I iSPN-Drd2HET mice showed reduced exploration of a novel arena relative to controls (t-test t(39) = 3.27, p = 0.002, n = 15,26 mice/genotype). J iSPN-Drd2HET mice show decreased time in EZM open zones (t-test t(39) = 3.48,p = 0.001, n = 15,26 mice/genotype), K decreased time spent in light compartment of light-dark box (t-test t(36) = 3.14, p = 0.003, n = 15,23 mice/genotype), and L longer latency to feed on the novelty suppressed feeding task in iSPN-Drd2HET (t-test t(41) = 2.35, p = 0.024, n = 17,26 mice/genotype). M Composite z-scores across all tasks for iSPN-Drd2HET (orange) and littermate control (black) (t-test t(39) = 3.47, p = 0.001, n = 15,26 mice/genotype). N Serum corticosterone levels are higher in iSPN-Drd2HET mice (orange) compared to littermate controls (black) (t-test t(24) = 3.88, p = 0.0007, n = 11,15 mice/genotype). (O) No genotypic difference in a sucrose anhedonia test (t-test t(27) = 1.92, p > 0.05, n = 12,15 mice/genotype). Data presented as mean ± SEM, *p < 0.05 **p < 0.01, ***p < 0.001, ****p < 0.0001. Cartoons in panels h, i, j, k, l are modified BioRender template license Alvarez, V. (2024) BioRender.com/m14d797.
Fig. 5
Fig. 5. Stronger alcohol relief and aversive-resistant consumption in mice with high ratio of D1 to D2 receptors.
A Time in the EZM open zones for control (black) and iSPN-Drd2HET (orange) mice after receiving either saline or 1.2 g/kg alcohol (green; i.p.; 2-way ANOVA main effect of alcohol F(1,73) = 2.95, p = 0.09; control mice: saline vs. alcohol t(48) = 3.01, p = 0.004; iSPN-Drd2HET: saline vs. alcohol t(25) = 3.31, p = 0.004, n = 15,26 mice/genotype). EZM cartoon is modified BioRender template license Alvarez, V. (2024) BioRender.com/m14d797. B Normalized time spent on EZM open zones following alcohol relative to time spent following saline for iSPN-Drd2HET (orange) and controls (black) (t-test t(39) = 3.31, p = 0.002, n = 15,26 mice/genotype). C Blood ethanol concentrations (BEC) 10 min after 1.2 g/kg alcohol (i.p.; t-test t(25) = 0.60, p > 0.05, n = 10,17mice/genotype). D iSPN-Drd2HET mice were pretreated with either saline or D1-like antagonist SCH-23390 (0.03 mg/kg; i.p.) then tested on EZM following saline or alcohol (1.2 g/kg; i.p.). E iSPN-Drd2HET mice pretreated with saline showed increased time in EZM open zones after alcohol (2-way ANOVA significant interaction SCH-23390 x Alcohol F(3,41) = 13.5, p < 0.0001; saline versus alcohol: p < 0.05, n = 9,12 mice/group), while mice pretreated with SCH-23390 did not show increased time in EZM open zones after alcohol compared to saline (p > 0.05, n = 11,13 mice/group). F iSPN-Drd2HET mice show stronger locomotor response at 2 g/kg alcohol than littermate controls (RM 2-way ANOVA main effect of Genotype F(2,62) = 5.10, p = 0.009; post hoc test p = 0.011, n = 10,23 mice/genotype). G Summary of EZM performance following saline or 1.2 g/kg alcohol (green shade) for control mice with low and high alcohol stimulation and iSPN-Drd2HET mice (n = 22, 28 control mice and 15 iSPN-Drd2HET mice). H Voluntary alcohol consumption in group-housed, intermittent access, operant paradigm. iSPN-Drd2HET (orange) and littermate controls (black) showed similar consumption of alcohol across sessions (RM 2-way ANOVA no effect of Genotype F(11,241) = 0.52, p > 0.05, n = 11,15 mice/genotype). I Water consumption was similar between genotypes on days alcohol was not available (RM 2-way ANOVA no effect of Genotype F(11,263) = 0.74, p > 0.05, n = 11,15 mice/genotype). J Alcohol intake was measured following quinine adulteration (0.5 mM), and normalized to intake before adulteration for iSPN-Drd2HET (orange) and control (black; RM 2-way ANOVA significant interaction Genotype x Quinine: F(1,23) = 4.95, p = 0.036, n = 11,14 mice/genotype). K Percent mice that drop intake during quinine adulteration (adulteration sensitive) and percent that did not drop (adulteration insensitive); two-tailed binomial test of observed findings (iSPN-Drd2HET) vs expected (control) p < 0.01; n = 11,14 mice/genotype). Data presented as mean ± SEM, *p < 0.05, **p < 0.01.

References

    1. Bloch, S. et al. Assessing negative affect in mice during abstinence from alcohol drinking: limitations and future challenges. Alcohol100, 41–56 (2022). - PMC - PubMed
    1. Brady, K. T. & Lydiard, R. B. The association of alcoholism and anxiety. Psychiatr Q64, 135–149 (1993). - PubMed
    1. Castillo-Carniglia, A., Keyes, K. M., Hasin, D. S. & Cerda, M. Psychiatric comorbidities in alcohol use disorder. Lancet Psychiatry6, 1068–1080 (2019). - PMC - PubMed
    1. Grant, B. F. et al. Prevalence and co-occurrence of substance use disorders and independent mood and anxiety disorders: results from the national epidemiologic survey on alcohol and related conditions. Arch Gen Psychiatry61, 807–816 (2004). - PubMed
    1. Garey, L. et al. The role of anxiety in smoking onset, severity, and cessation-related outcomes: a review of recent literature. Curr Psychiatry Rep22, 38 (2020). - PubMed

Publication types