. 2024 Oct 22;10(1):47.
doi: 10.1038/s41514-024-00176-y.

Aging and senescent fates of oligodendrocyte precursor cells in the mouse brain

Affiliations

Aging and senescent fates of oligodendrocyte precursor cells in the mouse brain

Paul T Gomez et al. NPJ Aging. .

Abstract

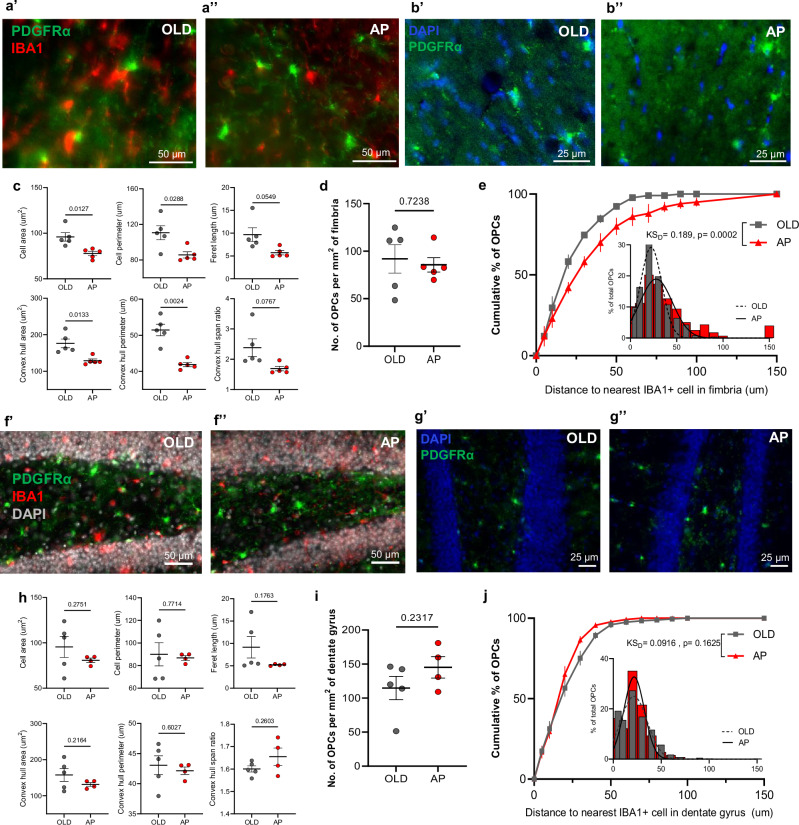
Age-related changes in oligodendrocyte precursor cells (OPCs) contribute to white matter dysfunction. In aged mice, we hypothesized that myelin-dense fimbria OPCs possess niche-specific properties, compared to hippocampal OPCs. Aged fimbria OPCs were fewer, larger, and localized to neighboring microglia. We identified age-increased p16/Cdkn2a-expressing OPCs enriched for senescence-related pathways and distinct senescence signatures between hippocampus and fimbria. Aged brain OPC populations differ in microenvironment properties and responses to senescence-directed intervention.


Conflict of interest statement

M.J.S., C.M.C., and Mayo Clinic have intellectual property related to senescence research. Research in the M.J.S. laboratory is reviewed by the Mayo Clinic Conflict of Interest Review Board and conducted in compliance with Mayo Clinic Conflict of Interest policies. All other authors declare no conflicts.

Figures

Fig. 1
Fig. 1. Differential features of aged versus young OPC populations in the mouse fimbria and hippocampus.
ab PDGFRα (green), IBA1 (red), and DAPI (blue) immunostaining images of OPCs in young (a’, b’) and old (a’’, b’’) fimbria, with high-magnification PDGFRα images in b. Plots of mean values of morphological parameters (c) and mean number of PDGFRα+ OPCs per square millimeter (d) of the fimbria in young (n = 6) and old mice (n = 9). Cumulative distributions of OPC distances to the nearest IBA1+ cell in the young (white circles) and old (gray squares) fimbria (e). fg PDGFRα (green), IBA1 (red), and DAPI (gray or blue) immunostaining images of OPCs in the young (f’, g’) and old (f’’, g’’) DG, with high-magnification PDGFRα images in g. Plots of mean values of morphological parameters (h) and mean number of PDGFRα+ OPCs per square millimeter (i) of the DG in young (n = 5) and old mice (n = 10). Welch’s t-test was used to compare young and old OPCs in each region. Cumulative distribution of OPC distances to the nearest IBA1+ cell in the young (white circles) and old (gray squares) DG (j). Kolmogorov–Smirnov test was used to compare cumulative distributions of the populations (KSD). For cumulative distribution plots, lines on individual points represent SEM and the inset show a histogram of the same data with a fitted Gaussian curve (young = dotted, old = solid). ROIs were isolated as described in Methods. Open circles indicate females, while open triangles indicate males. Bars represent mean ± SEM.
Fig. 2
Fig. 2. Transcriptomic profiles of senescent OPC subpopulations emerge in the aged mouse brain.
a T-distributed stochastic neighbor embedding (tSNE) plot of brain cells clustered according to cell-type markers in young (n = 8) and old (n = 8) male mouse brains from a publically available transcriptomic dataset18. b Cdkn2a/p16-expressing cells in young (b’) and old (b’’) brains. Inset = OPC cluster. c Plots showing mean number (c’) and mean percentage (c’’) of p16-expressing OPCs (total OPCs = 1134 young and 1005 old OPCs, n = 8 mice per age) (Welch’s t-test). d Visualization (as in a, b) of young and old cells expressing Cdkn2a/p16 (green) and Cdkn1a/p21 (red). Color gradient for co-expression is shown. e Bar plot displaying z-scores of significantly activated canonical pathways in p16-expressing OPCs derived from IPA. Exact p values are shown inside the bars (Fischer’s exact test). f Bar plot showing transcripts-per-million (TPM) fold change from young to old OPCs of precursor identity (light gray), mature lineage (black), and emerging OPC aging/senescence (dark gray) markers (f’). Relative change from young to old in the percentage of OPCs expressing the listed markers (f’’). g tSNE plot of OPCs from young (g’) and old (g’’) mice, showing average expression levels of OPC aging/senescence markers (Serpina3n, Meox1, Cdkn2b, Nol3, Skap2), derived from Seurat’s AddModuleScore function. h Plot of gene signature scores (visualized in g), calculated using AddModuleScore (h’) or UCell (h’’) in young and old OPCs24. Mann–Whitney test was used to compare ranks of module scores between young and old OPCs. i Relative expression of emerging OPC aging/senescence markers in the hippocampus and adjacent white matter of young (n = 11) and old (n = 13) mouse brains. Open circles indicate females, while open triangles indicate males. Bars represent mean ± SEM. Exact p values are shown.
Fig. 3
Fig. 3. Systemic targeting of p16-expressing senescent cells distinctly modulates age-associated changes in fimbria OPC populations.
a, b High-magnification PDGFRα (green), IBA1 (red), and DAPI (blue) immunostaining images of OPCs in the old (a’, b’) and AP-treated (a’’, b’’) fimbria. Plots of mean values of morphological parameters (c) and mean number of PDGFRα+ OPCs per square millimeter (d) of the fimbria in aged (n = 5) and AP-treated mice (n = 5). e Cumulative distribution of OPC distances to the nearest IBA1+ cell in the old (gray squares) and AP-treated (red triangles) fimbria. f–g High-magnification PDGFRα (green), IBA1 (red), and DAPI (gray or blue) immunostaining images of OPCs in the aged (f’, g’) and AP-treated (f’’, g’’) DG. Plots of mean values of the indicated morphological parameters (h) and mean number of PDGFRa+ OPCs per square millimeter (i) of the DG in old (n = 5) and AP-treated (n = 4) mice. Welch’s t-test was used to compare OPCs from old and AP-treated mouse brains in each region. j Cumulative distribution of OPC distances to the nearest IBA1+ cell in the old (gray squares) and AP-treated (red triangles) DG. Kolmogorov–Smirnov test was used to compare cumulative distributions of the populations (KSD). For cumulative distribution plots, lines on points represent SEM and the inset show a histogram of the same data with a fitted Gaussian curve (old = dotted, AP = solid). ROIs were isolated as described in Methods. All mice represented here are females. Bars represent mean ± SEM.

References

    1. Liu, H. et al. Aging of cerebral white matter. Ageing Res. Rev.34, 64–76 (2017). - PMC - PubMed
    1. Beiter, R. M. et al. Evidence for oligodendrocyte progenitor cell heterogeneity in the adult mouse brain. Sci. Rep.12, 12921 (2022). - PMC - PubMed
    1. Spitzer, S. O. et al. Oligodendrocyte progenitor cells become regionally diverse and heterogeneous with age. Neuron101, 459–471.e455 (2019). - PMC - PubMed
    1. Hill, R. A., Patel, K. D., Medved, J., Reiss, A. M. & Nishiyama, A. NG2 cells in white matter but not gray matter proliferate in response to PDGF. J. Neurosci.33, 14558–14566 (2013). - PMC - PubMed
    1. Dimou, L., Simon, C., Kirchhoff, F., Takebayashi, H. & Götz, M. Progeny of Olig2-expressing progenitors in the gray and white matter of the adult mouse cerebral cortex. J. Neurosci.28, 10434–10442 (2008). - PMC - PubMed

LinkOut - more resources