. 2024 Oct 23;15(1):9114.
doi: 10.1038/s41467-024-53561-2.

A splicing isoform of PD-1 promotes tumor progression as a potential immune checkpoint

Affiliations

A splicing isoform of PD-1 promotes tumor progression as a potential immune checkpoint

Xuetong Wang et al. Nat Commun. .

Abstract

The immune checkpoint receptor, programmed cell death 1 (PD-1, encoded by PDCD1), mediates the immune escape of cancer, but whether PD-1 splicing isoforms contribute to this process is still unclear. Here, we identify an alternative splicing isoform of human PD-1, which carries a 28-base pairs extension retained from 5' region of intron 2 (PD-1^28), is expressed in peripheral T cells and tumor infiltrating lymphocytes. PD-1^28 expression is induced on T cells upon activation and is regulated by an RNA binding protein, TAF15. Functionally, PD-1^28 inhibits T cell proliferation, cytokine production, and tumor cell killing in vitro. In vivo, T cell-specific exogenous expression of PD-1^28 promotes tumor growth in both a syngeneic mouse tumor model and humanized NOG mice inoculated with human lung cancer cells. Our study thus demonstrates that PD-1^28 functions as an immune checkpoint, and may contribute to resistance to immune checkpoint blockade therapy.


Conflict of interest statement

The authors declare no competing interests.

Figures

Fig. 1
Fig. 1. Identification and characterization of PD-1^28 in T lymphocytes.
A, B The schematic gene structures of PDCD1 (top) and PDCD1^28 (bottom) (A) or functional domains of PD-1 (top) and PD-1^28 (bottom) (B). C, D Immunoblot analysis (C) or silver staining (D) of endogenous immunoprecipitation of PD-1^28 in Jurkat cells treated with PHA or vehicle for 72 h. Polyclonal antibodies (PcAb). The specific band indicated by red arrow is the PD-1^28. E LC-MS analysis of specific peptides for PD-1^28 cytoplasmic tail obtained from D. F Representative confocal images of endogenous PD-1^28 (magenta) in Jurkat cells after treatment with PHA or vehicle. The cell membranes were stained with Na/K ATPase (green). The nuclei (blue) were stained with 4′,6-diamidino-2-phenylindole (DAPI). Scale bars, 10 µm. GL qRT-PCR analysis of PDCD1^28 (G, I, and K, left) and PDCD1 (G, I, and K, right) or FACS analysis of PD-1^28 (H, J and L, left) and PD-1 (H, J and L, right) and quantified as the MFI in Jurkat cells stimulated by CD3 and CD28 for 72 h (G, H), PMA and Ionomycin for 5 h (I and J) or PHA for 72 h (K, L) (n = 3 biologically independent experiments). M Quantified results of PD-1 and PD-1^28 populations in CD4+ and CD8+ T cells from PBMCs of 3 healthy human donors. N Quantified results of PD-1^28 proportion in CD4+ and CD8+ TILs derived from 7 lung cancer clinical specimens. Data represent the mean ± SD. Statistical significance was determined by two-tailed unpaired Student’s t-test (GJ, M) or one-way ANOVA with Tukey post hoc test (K, L). *p < 0.05, **p < 0.01, ***p < 0.001. Source data, including exact p-values, are provided as a Source Data file.
Fig. 2
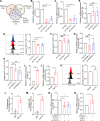
Fig. 2. Splicing of PDCD1^28 is regulated by TAF15.
A Venn diagram showing the three candidate RBPs. B qRT-PCR analysis for KD efficiency of TAF15 in Jurkat cells transfected with the indicated shRNAs. sh-Con as a negative control (n = 3 biologically independent experiments). C, D qRT-PCR analysis of PDCD1^28 (C) or representative FACS showing changes (D, left) and quantified as the MFI (D, right) of the PD-1^28 levels in TAF15 KD Jurkat cells (n = 3 biologically independent experiments). EH qRT-PCR analysis of PDCD1^28 (E, G) or quantitation of PD-1^28 levels as MFI (F, H) in FUS (E, F) or EWSR1 (G, H) KD Jurkat cells (n = 3 biologically independent experiments). IK qRT-PCR analysis for expression levels of TAF15 (I), PDCD1^28 (J), or representative FACS showing changes (K, left) and quantified as MFI of PD-1^28 (K, right) in Jurkat cells transfected with the indicated plasmids (n = 3 biologically independent experiments). L, M RIP qRT-PCR showing the enriched binding of TAF15 on the endogenous PDCD1^28 pre-mRNAs in Jurkat cells (L) or in minigene OE HEK293T cells (M) (n = 3 biologically independent experiments). N, O qRT-PCR analysis of PDCD1^28 in minigene OE HEK293T cells with TAF15 KD (N) or OE (O) (n = 3 biologically independent experiments). Data represent the mean ± SD. Statistical significance was determined by one-way ANOVA with Dunnett post hoc test (BH and N) or two-tailed unpaired Student’s t-test (IM and O). *p < 0.05, **p < 0.01, ***p < 0.001. Source data, including exact p-values, are provided as a Source Data file.
Fig. 3
Fig. 3. PD-1^28 negatively regulates the immune function of Jurkat cells.
A, B qRT-PCR analysis for PDCD1^28 (A), or representative FACS (B, left), quantified as MFI (B, top right) of PD-1^28 and representative immunoblot for PD-1 (B, bottom right) in Jurkat cells transfected with the indicated shRNAs (n = 3 biologically independent experiments). C Representative CFSE assay assessing the relative proliferation (left) and quantified as the MFI (right) in PDCD1^28 KD Jurkat cells (n = 3 biologically independent experiments). D Enzyme-linked immunosorbent assay (ELISA) assessing the relative IL-2 production in PDCD1^28 KD Jurkat cells (n = 3 biologically independent experiments). E Tumor cell killing of PDCD1^28 KD Jurkat cells against NCI-H1299 cells. The representative images (left) and the quantified ratio (right) of dead cancer cells measured by Annexin-V and 7-AAD staining (n = 3 biologically independent experiments). F qRT-PCR analysis for PDCD1 and PDCD1^28 in KO-1 and KO-2 Jurkat cells transfected with the indicated plasmids (n = 3 biologically independent experiments). G Immunoblot analysis for PD-1 and PD-1^28 in KO-1 and KO-2 Jurkat cells transfected with the indicated plasmids. H Representative CFSE assay assessing the relative proliferation in KO-1 and KO-2 Jurkat cells with OE of either PDCD1 or PDCD1^28 (left). Quantification data as MFI (right) (n = 3 biologically independent experiments). I ELISA assessing the relative IL-2 production of KO-1 and KO-2 Jurkat cells with OE of either PDCD1 or PDCD1^28 (n = 3 biologically independent experiments). J Tumor cell killing of KO-1 Jurkat cells with OE of either PDCD1 or PDCD1^28 against NCI-H1299 cells. The representative images (left) and the quantified ratio (right) of dead cancer cells measured by Annexin-V and 7-AAD staining (n = 3 biologically independent experiments). K, L, O qRT-PCR analysis for either wild-type CD28 (K, left) or CD28-PDCD1^28 (K, right) and either wild-type PDCD1 or PDCD1-PDCD1^28 (O, top), and immunoblot analysis for the indicated proteins (L and bottom of O) in KO-1 cells transfected with the indicated plasmids (n = 3 biologically independent experiments). M, P Representative CFSE assay assessing the relative proliferation of KO-1 Jurkat cells with OE of either wild-type CD28 or CD28-PDCD1^28 (M, left), and either wild-type PDCD1 or PDCD1-PDCD1^28 (P, left). Quantification data as MFI (M, P, right) (n = 3 biologically independent experiments). N, Q ELISA assessing the relative IL-2 production of KO-1 Jurkat cells with OE of either wild-type CD28 or CD28-PDCD1^28 (N), and either wild-type PDCD1 or PDCD1-PDCD1^28 (Q) (n = 3 biologically independent experiments). Data represent the mean ± SD. Statistical significance was determined by one-way ANOVA with Dunnett post hoc test (AF, HJ, MQ) or two-tailed unpaired Student’s t-test (K). *p < 0.05, **p < 0.01, ***p < 0.001. Source data, including exact p-values, are provided as a Source Data file.
Fig. 4
Fig. 4. PD-1^28 negatively regulates the immune function of primary T cells.
A Representative FACS (left) and quantified as MFI (right) for KD efficiency of PD-1^28 in primary T cells isolated from PBMCs transfected with the indicated shRNAs (n = 3 biologically independent experiments). B FACS assessing PD-1 surface levels and quantified as the MFI in PDCD1^28 KD primary T cells (n = 3 biologically independent experiments). C CFSE assay assessing the relative proliferation and quantified as the MFI in PDCD1^28 KD primary T cells (n = 3 biologically independent experiments). D, E FACS assessing the relative GzmB (D) and IFN-γ (E) production of PDCD1^28 KD primary T cells (n = 3 biologically independent experiments). F Tumor cell killing of PDCD1^28 KD primary T cells against NCI-H1299 cells. The representative images (left) and the quantified ratio (right) of dead cancer cells measured by Annexin-V and 7-AAD staining (n = 3 biologically independent experiments). G, H Representative FACS (left) and quantified as MFI (right) showing changes in the PD-1 (G) or PD-1^28 (H) levels of primary T cells transfection with the indicated plasmids (n = 3 biologically independent experiments). I CFSE assay assessing the relative proliferation and quantified as the MFI of primary T cells with OE of PDCD1 or PDCD1^28 (n = 3 biologically independent experiments). J, K FACS assessing the relative GzmB (J) and IFN-γ (K) production of primary T cells with OE of PDCD1 or PDCD1^28 (n = 3 biologically independent experiments). L Tumor cell killing of primary T cells with OE of PDCD1 or PDCD1^28 against NCI-H1299 cells. The representative images (left) and the quantified ratio (right) of dead cancer cells measured by Annexin-V and 7-AAD staining (n = 3 biologically independent experiments). Data represent the mean ± SD. Statistical significance was determined by one-way ANOVA with Dunnett post hoc test (AF, IL) or two-tailed unpaired Student’s t-test (G, H). *p < 0.05, **p < 0.01, ***p < 0.001. Source data, including exact p-values, are provided as a Source Data file.
Fig. 5
Fig. 5. PD-1^28 binding with PD-L1 inhibits T cells activation.
A FACS analysis for PD-L1 proportion in Jurkat cells with intact or permeabilized membrane (n = 3 biologically independent experiments). B ELISA assessing the relative IL-2 production of KO-1 and KO-2 Jurkat cells transfected with the indicated plasmids and treated with either Ig or PD-L1 Ig (n = 3 biologically independent experiments). C, D qRT-PCR analysis for PDCD1LG1 (C) and immunoblot analysis of the indicated proteins (D) in KO-1 and KO-2 Jurkat cells transfected with the indicated plasmids (n = 3 biologically independent experiments). E, F CFSE assay assessing the relative proliferation and quantified as MFI (E), or ELISA assessing the relative IL-2 production (F) of KO-1 and KO-2 Jurkat cells transfected with the indicated plasmids (n = 3 biologically independent experiments). G qRT-PCR analysis for PDCD1LG1 (top) and immunoblot (bottom) in KO-1 Jurkat cells transfected with the indicated plasmids (n = 3 biologically independent experiments). H qRT-PCR analysis for wild-type PDCD1, mutant PDCD1, wild-type PDCD1^28 and mutant PDCD1^28 (top) and immunoblot (bottom) in KO-1 Jurkat cells transfected with the indicated plasmids (n = 3 biologically independent experiments). I, J Representative CFSE assay assessing the relative proliferation (I, left) and quantification data as MFI (I, right), or ELISA assessing the relative IL-2 production (J) of KO-1 Jurkat cells transfected with the indicated plasmids (n = 3 biologically independent experiments). Data represent the mean ± SD. Statistical significance was determined by two-tailed unpaired Student’s t-test (A) or one-way ANOVA with Tukey (B, C, E, F, I, J) or Dunnett (G, H) post hoc test. *p < 0.05, **p < 0.01, ***p < 0.001. Source data, including exact p-values, are provided as a Source Data file.
Fig. 6
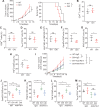
Fig. 6. PD-1^28 regulates T cell anti-tumor immunity in MC38 colorectal carcinoma mouse model.
A Tumor progression of MC38 colorectal carcinoma, indicated by tumor volume in mice (left) and the survival of mice (right) assessed in control and PDCD1^28CKI mice (n = 5). BH Tumor-infiltrating T cells isolated and analyzed after transplantation (n = 5). Frequencies of CD4+ T cells (B), CD8+ T cells (C), and Treg cell population (D). Quantified results of Ki-67 (E), GzmB (F), IFN-γ (G), and TNF (H) expressions of CD8+ TILs in the tumor microenvironment. IM Anti-Pd-l1 therapy against MC38 colorectal carcinoma (n = 5). Tumor volume (I), GzmB (J), IFN-γ (K), and TNF (L) expressions of CD8+ TILs and population of Treg cells (M) measured. Data represent the mean ± SD. Statistical significance was determined by two-tailed unpaired Student’s t-test (A, left and BH), log-rank (Mantel-Cox) test (A, right), or one-way ANOVA with Tukey post hoc test (IM). *p < 0.05, **p < 0.01, ***p < 0.001. Source data, including exact p-values, are provided as a Source Data file.
Fig. 7
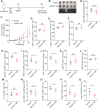
Fig. 7. PD-1^28 regulates T cell anti-tumor immunity in huPBMC-NOG mouse model.
A Experimental design of huPBMC-NOG mice model. PBMCs respectively transfected with a control and PDCD1^28. s.c., subcutaneous; i.v., intravenous. B Tumor size in control and PDCD1^28 OE huPBMC-NOG mice subcutaneously implanted with NCI-H1299 cells at the end point (n = 5). C Effects of PD-1^28 on tumor growth in subcutaneously implanted huPBMC-NOG mice (n = 5). DJ Phenotypic assessment of T cells in spleens isolated from control (n = 5) or PDCD1^28 OE huPBMC-NOG mice (n = 5). Frequency of CD4+ T cells (D), CD8+ T cells (E), and Treg cell population (F). Quantified results of Ki-67 (G), GzmB (H), IFN-γ (I), and TNF (J) expressions of CD8+ T cells in the spleen. KQ TILs of control (n = 5) and PDCD1^28 OE huPBMC-NOG mice (n = 5) isolated and analyzed after transplantation. Frequencies of CD4+ T cells (K), CD8+ T cells (L), and Treg cell population (M). Quantified results of Ki-67 (N), GzmB (O), IFN-γ (P), and TNF (Q) expressions of CD8+ TILs in the tumor microenvironment. Data represent the mean ± SD. Statistical significance was determined by two-tailed unpaired Student’s t-test (CQ). *p < 0.05, **p < 0.01, ***p < 0.001. Source data, including exact p-values, are provided as a Source Data file.

References

    1. Pardoll, D. M. The blockade of immune checkpoints in cancer immunotherapy. Nat. Rev. Cancer12, 252–264 (2012). - PMC - PubMed
    1. Nurieva, R. I., Liu, X. & Dong, C. Yin-Yang of costimulation: crucial controls of immune tolerance and function. Immunol. Rev.229, 88–100 (2009). - PMC - PubMed
    1. Ishida, Y., Agata, Y., Shibahara, K. & Honjo, T. Induced expression of PD-1, a novel member of the immunoglobulin gene superfamily, upon programmed cell death. EMBO J.11, 3887–3895 (1992). - PMC - PubMed
    1. Keir, M. E., Butte, M. J., Freeman, G. J. & Sharpe, A. H. PD-1 and its ligands in tolerance and immunity. Annu. Rev. Immunol.26, 677–704 (2008). - PMC - PubMed
    1. Wang, X. et al. Tumor cell-intrinsic PD-1 receptor is a tumor suppressor and mediates resistance to PD-1 blockade therapy. Proc. Natl Acad. Sci. USA117, 6640–6650 (2020). - PMC - PubMed

Publication types

MeSH terms

Associated data