. 2024 Oct 22;14(1):24846.
doi: 10.1038/s41598-024-74359-8.

Thioflavin-T: application as a neuronal body and nucleolar stain and the blue light photo enhancement effect

Affiliations

Thioflavin-T: application as a neuronal body and nucleolar stain and the blue light photo enhancement effect

Jin-Hong Min et al. Sci Rep. .

Erratum in

Abstract

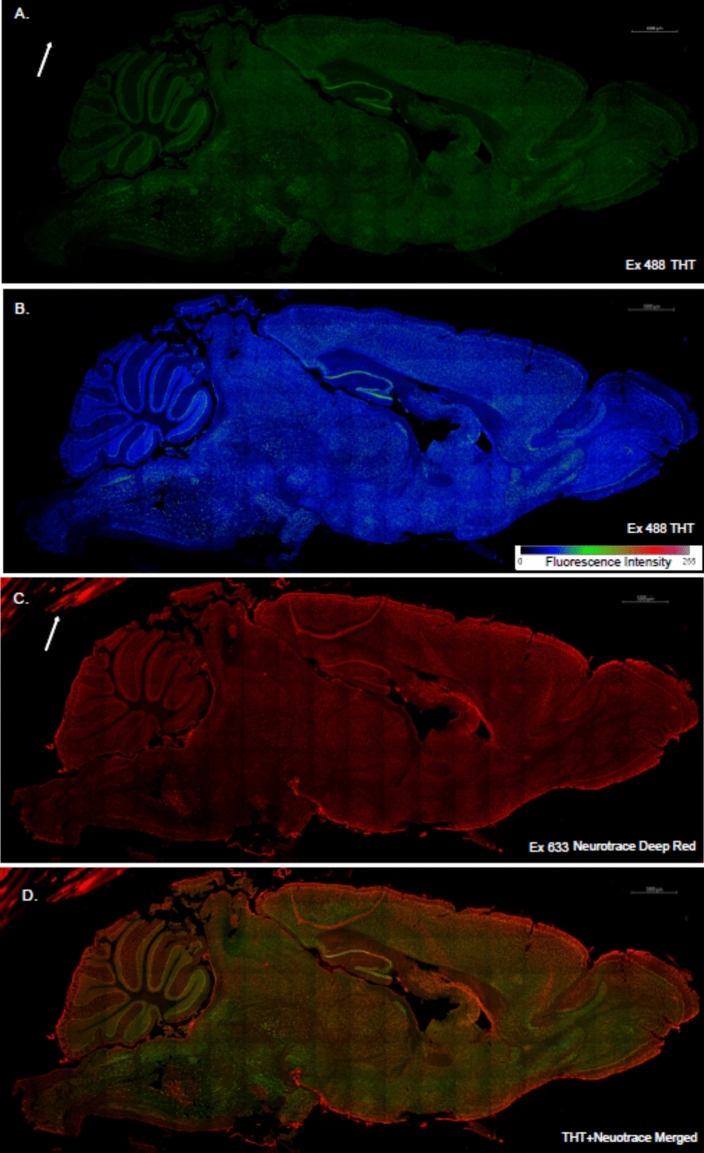
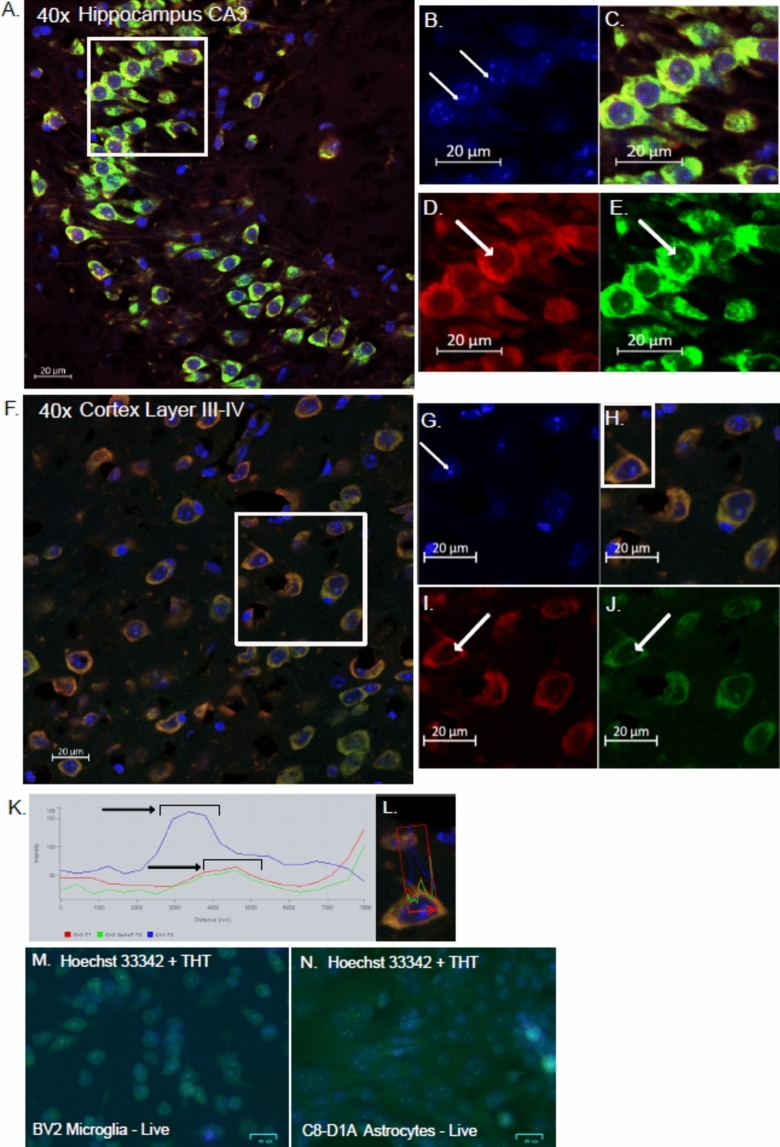
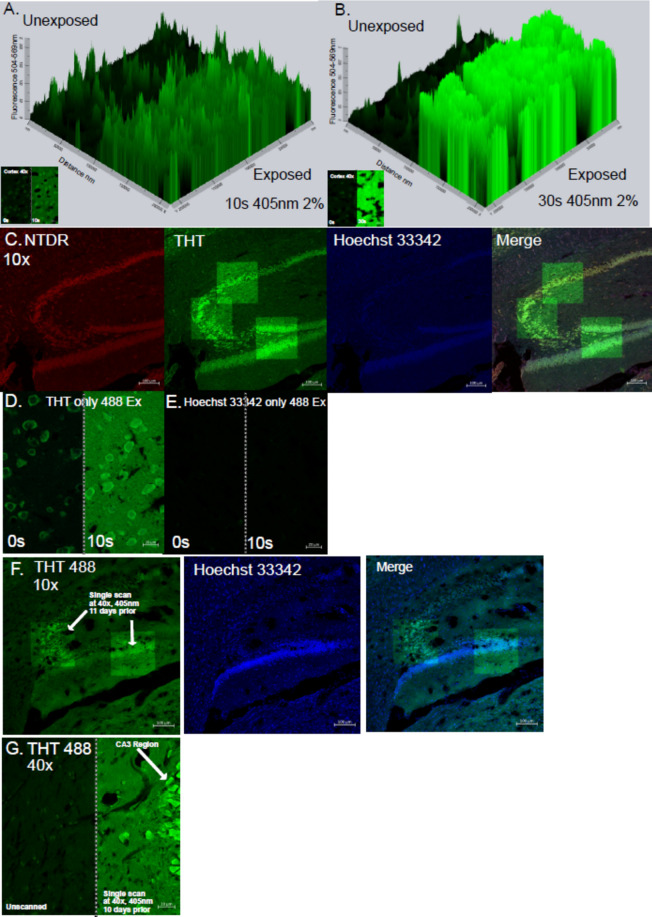
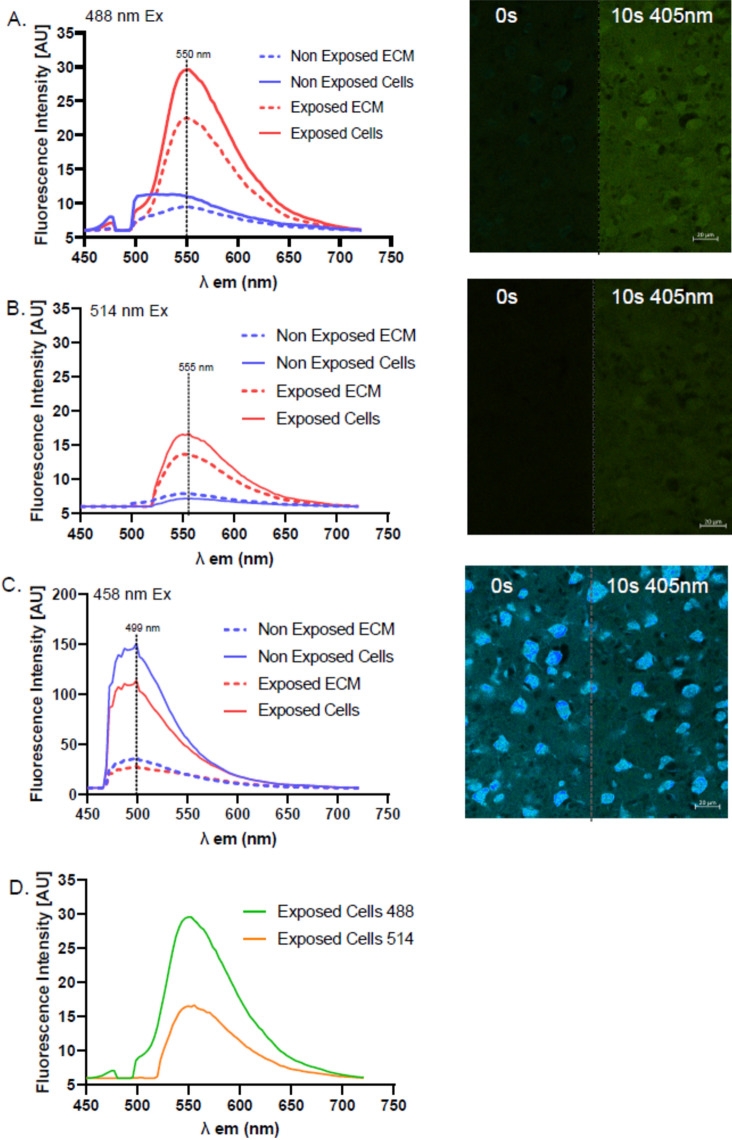
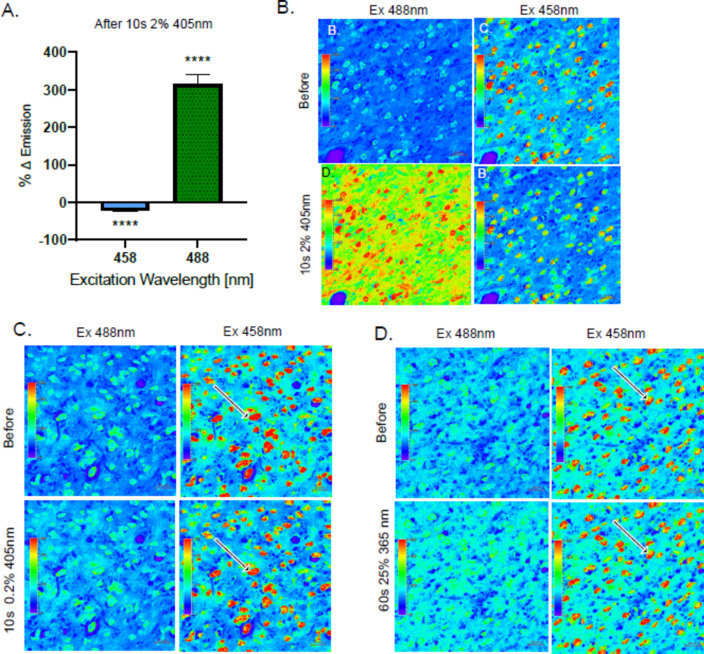
Thioflavin-T (THT) is a common and indispensable tool for the study of amyloid pathologies and protein aggregation, both in vitro and for histological samples. In this study we expand the use of THT beyond its canonical usage for staining amyloid plaques and demonstrate its novel use as an easy and rapid stain comparable to fluorescent Nissl staining, allowing for clear discernment of neuronal cell bodies and also nucleoli in fixed tissue and live cells. We believe that this is of value for any lab that studies central nervous system (CNS) tissues. Furthermore, we show that THT could potentially be used as a an alternative to the use of fluorescent reporters or other more costly RNA binding compounds in the study of nucleolar dynamics owing to its ability to clearly stain nucleoli in live cells. We also discovered the previously unreported effect of blue light exposure on the photo enhancement of THT excited by a 488 nm laser in stained tissue sample and how to avoid complications arising from this effect. Finally, we provide a simple protocol that can be easily adjusted either for using THT as a neuronal cell body and nucleoli stain, compatible with antibody based staining methods tested up to 4 fluorophores, or alternatively by using an additional washing step the protocol may be used for amyloid plaque detection in fixed brain tissue.

Keywords: Alzheimer’s disease; Amyloid Beta; Brain; Neuron; Nissl; Photo Enhancement; Thioflavin-T.


Conflict of interest statement

The authors declare no competing interests.

Figures

Fig. 1
Fig. 1
Representative staining of a mouse brain using THT and NTDR following protocol 1 at 10 × magnification. (A,B) THT intensity with 488 nm laser excitation in green pseudo color image (A) and heat map (B). (C,D) NTDR image with a 633 nm laser (C) and merge with THT (D). Scale bar: 1000 µm.
Fig. 2
Fig. 2
Co-localization analyses of brain regions stained with THT and NTDR, (A) Representative images of various brain regions in the brain section stained with NTDR, THT and Hoechst 33342. Scale bar: 20 µm. (B) Representative image of the CA3 region of the hippocampus for the intensity line profiles. (C) Comparison of line profiles between THT, NTDR and Hoechst 33342. Red: NeuroTrace DR (NTDR), Green: THT, Blue: Hoechst33342. Black brackets indicate the co-localization of NTDR and THT. (D) Pearson’s correlation analysis between THT and NTDR in various brain regions n = 5/6, (E) Spearman’s Rank Coefficient analysis for each of the brain regions (n = 6 all regions except Cerebellum & hippocampus n = 5, Average of all PCC and SRCC results respectively, an average score of > 0.7 was considered as evidence of co-localization for the PCC and SRCC, (F) Tabulated average SRCC and PCC corresponding to (E). A one sample T-test was conducted for each brain region in D,E.
Fig. 3
Fig. 3
THT as a nucleolar stain in fixed tissue and live cells, (A) Representative images of the hippocampus. Blue: Hoechst33342, Red: NTDR, Green: THT. (B-E) Cropped image at white square area shown in (A). (B) Hoechst 33342 with arrows indicating chromatin structures. (C) Cropped merge image. (D) NTDR with arrow indicating faint nucleolus. (E) THT at 488 nm excitation with arrow indicating nucleolus. (F) Representative images of the cortex layers III-IV. Blue: Hoechst33342, Red: NTDR, Green: THT. (GJ) Cropped image at white square area shown in (F). (G) Hoechst 33342 with arrows indicating chromatin structures. (H) Cropped merge image. (I) NTDR with arrow indicating nucleolus. (J) THT at 488 nm excitation with arrow indicating nucleolus. (K,L) Representative spectral intensity profile of an example nucleus in the white region of (H), (M,N) Representative image of live BV2 microglia (M) and C8-D1A astrocytes (N) staining with Hoechst 33342 and THT.
Fig. 4
Fig. 4
THT is compatible with antibody based fluorescent techniques. (A,B) Representative images of areas stained with THT, IBA1 (microglia/macrophage marker) and Hoechst 33342 at CA3 region (A) and Cortex (B). (C) Cortex imaged once with a 405 nm laser and then imaged again with THT, NTDR and Hoechst 33342 with THT excited by both 488 and 458 lasers. (D) Cortex stained with THT, NTDR and Hoechst 33342 demonstrating the spectral intensity overlap between THT excited with the 458 nm laser and NTDR, (E) Hippocampus stained with IBA1, GFAP, THT and Hoechst 33342, 40 × magnification, white arrows indicate IBA1+ microglia that partially stain positive for THT, red arrows indicate GFAP+ Astrocytes that microglia that partially stain positive for THT, (F) SRCC and PCC analyses for THT vs IBA1 or GFAP with corresponding mean values, pooled data from 2 experiments each with n = 3, Excitation laser wavelengths appear beside the stain used. A one sample T-Test was conducted for F.
Fig. 5
Fig. 5
THT photo-enhancement by blue-light exposure. (A,B) Representative 2.5D images of THT-stained cortex imaged using the 488 nm laser after the exposure of right half side to a 405 nm laser scanning (770 µW) for 10 s (A) and 30 s, 40 × magnification (B). (C) Hippocampus stained with THT, NTDR and Hoechst 33,=342 (each 10 × magnification) imaged immediately after the 405 nm-laser-induced photo-enhancement at 3 regions on the hippocampus using 40 × magnification. (D,E) Sample stained only with THT (D) or Hoechst 33342 (E) imaged with the 488 nm laser without/with the exposure of the 405 nm laser for 10 s. (F) Hippocampus previously exposed to 405 nm laser by 40 × magnification 11 days prior to imaging with a 488 nm excitation laser and 10 × magnification. (G) Sample previously exposed to 405 nm laser by 40 × magnification 10 days prior to imaging with the 488 nm excitation laser and 40 × magnification.
Fig. 6
Fig. 6
Spectral imaging analysis on blue-light photo-enhancement. (AD) Fluorescence spectral profile of cells and surrounding tissue with or without pre-exposure to 405 nm laser (770 µW) 10 s. Spectral imaging was performed using the 488 nm (A), 514 nm (B) and (C) 458 nm laser excitations. (D) Spectral profile comparison between the exposed cells at 488 vs 514 nm excitations. Green: 488 nm excitation laser, Orange: 514 nm excitation laser. Representative lambda profile overlays on the right, vertical dashed bar represents the peak fluorescence intensity from exposed cells (rounded to 3 significant figures). Each experiment with 3 repeats per wavelength, each graph made by pooling 3 experiments.
Fig. 7
Fig. 7
THT blue light photo enhancement and photo bleaching. (A) Change in emission intensity of cortex sample calculated from the images shown in (B), n = 3 pooled from 2 experiments. (B) Representative heat maps acquired by 458 nm/488 nm excitation laser before and after the 405 nm laser illumination (2%, 770 µW) for 10s by 40 × magnification lens. (C) Representative heat maps acquired by 458 nm/488 nm excitation laser before and after the 405 nm laser illumination (0.2%, 77 µW) for 10 s by 40 × magnification. (D) Representative heat maps acquired by 458 nm/488 nm excitation laser before and after the 365 nm halogen lamp (25%) for 60 s by 49wf blue filter (Carl Zeiss) and 40 × magnification. Arrows represent examples where loss of signal is evident after blue light exposure in the using 458 nm. A 2 sample T-test was conducted for A.
Fig. 8
Fig. 8
Establishment of THT staining protocols, (A) Illustration of THT staining protocols A and B with accompanying notes. (B) Representative image of a female 4 month-old C57B/6 mouse brain section viewed on the sagittal plane stained using protocol A imaged using the 458 nm excitation laser and 10 × magnification. (C) Representative image of a female 14 month-old APP NL-GLF brain section viewed on the sagittal plane stained using protocol B imaged using the 458 nm excitation laser and 10 × magnification lens with digital zoom to highlight the cortex and hippocampus. (D) Representative image of a THT-stained plaque in the molecular layer surround the dentate gyrus taken at 40 × magnification (left) digitally zoomed in to demonstrate the fibrillary plaque structure (right), (E) Fluorescence intensity plot of THT stained plaque in (D) compared to a nearby stained cell.

References

    1. Biancalana, M. & Koide, S. Molecular mechanism of Thioflavin-T binding to amyloid fibrils. Biochim. Biophys. Acta 1804, 1405–1412 (2010). - PMC - PubMed
    1. Sundaram, G. S. M., Binz, K., Sharma, V., Yeung, M. & Sharma, V. Live-cell fluorescence imaging: Assessment of thioflavin T uptake in human epidermal carcinoma cells. Medchemcomm 9, 946–950 (2018). - PMC - PubMed
    1. Xue, C., Lin, T. Y., Chang, D. & Guo, Z. Thioflavin T as an amyloid dye: Fibril quantification, optimal concentration and effect on aggregation. R. Soc. Open Sci. 4, 160696 (2017). - PMC - PubMed
    1. Naiki, H., Higuchi, K., Hosokawa, M. & Takeda, T. Fluorometric determination of amyloid fibrils in vitro using the fluorescent dye, thioflavine T. Anal. Biochem. 177, 244–249 (1989). - PubMed
    1. Srivastava, A. et al. Identifying the bond responsible for the fluorescence modulation in an amyloid fibril sensor. Chemistry 16, 9257–9263 (2010). - PubMed

LinkOut - more resources