. 2024 Oct 22;7(1):1371.
doi: 10.1038/s42003-024-07050-3.

MiR-21-3p inhibitor exerts myocardial protective effects by altering macrophage polarization state and reducing excessive mitophagy

Affiliations

MiR-21-3p inhibitor exerts myocardial protective effects by altering macrophage polarization state and reducing excessive mitophagy

Yujing Huang et al. Commun Biol. .

Abstract

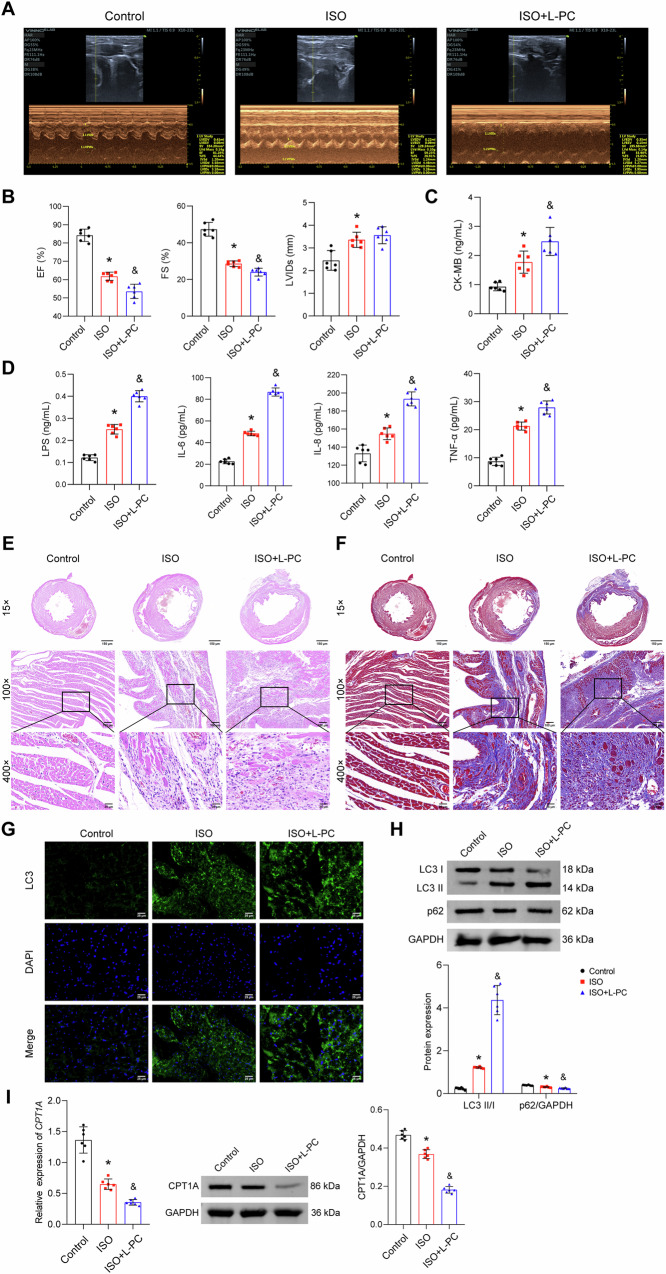
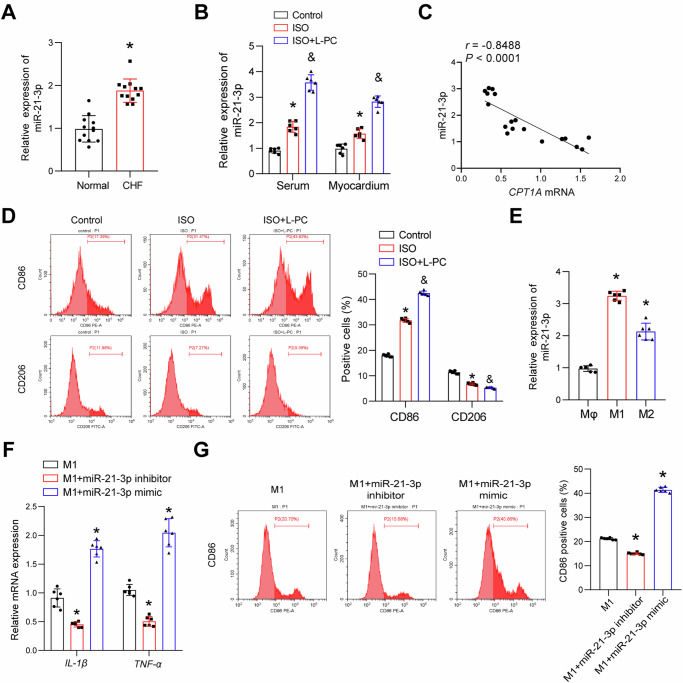
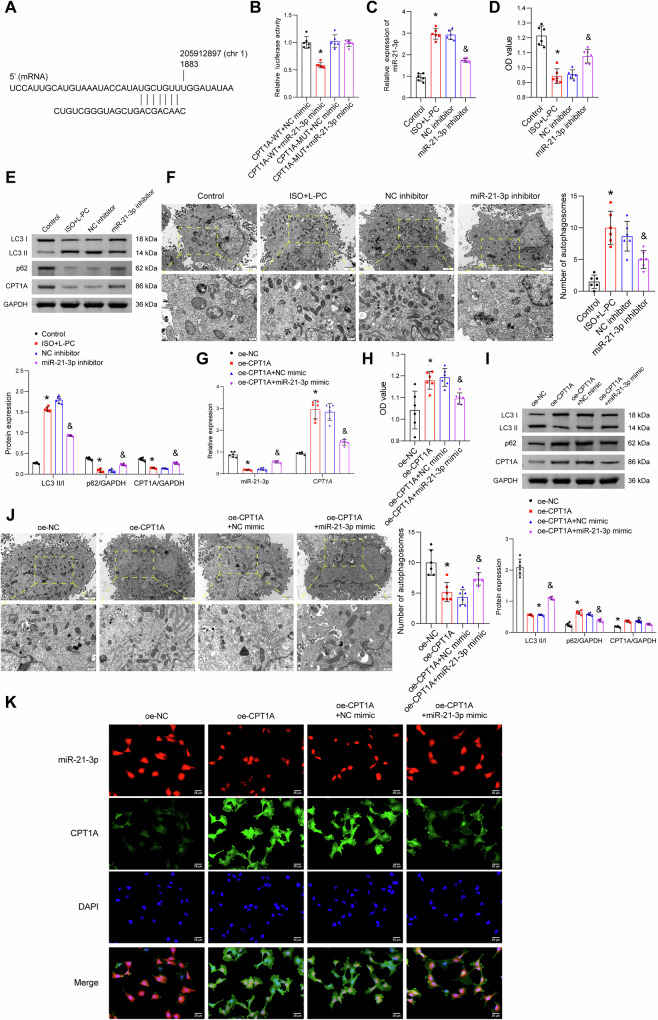
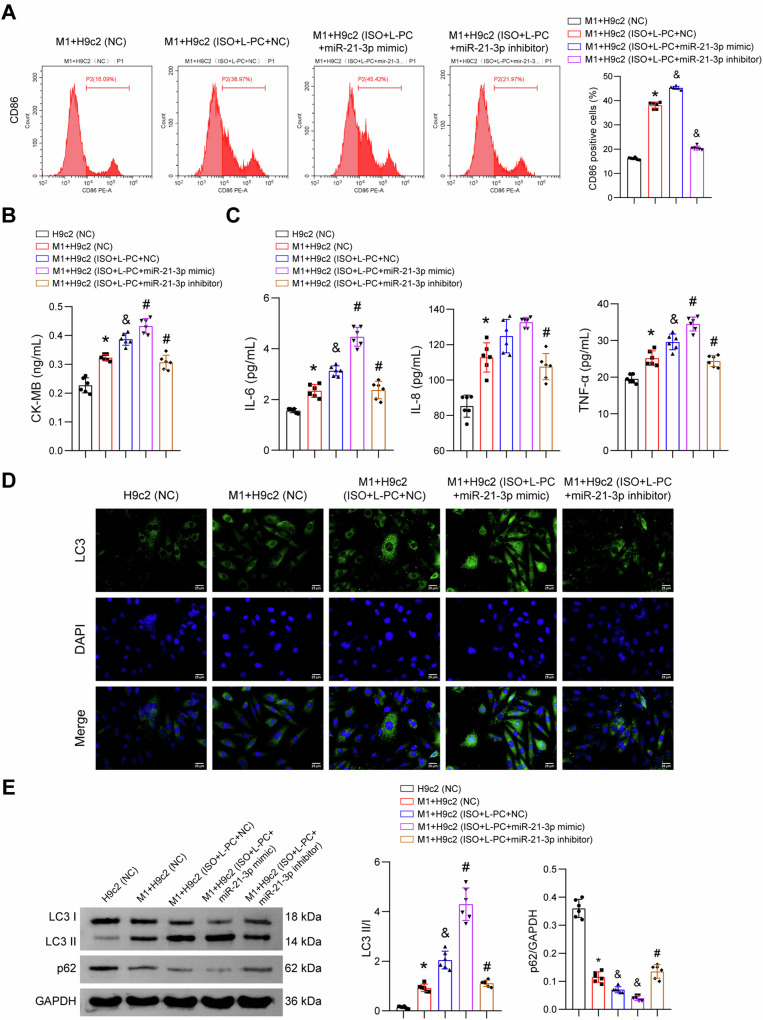
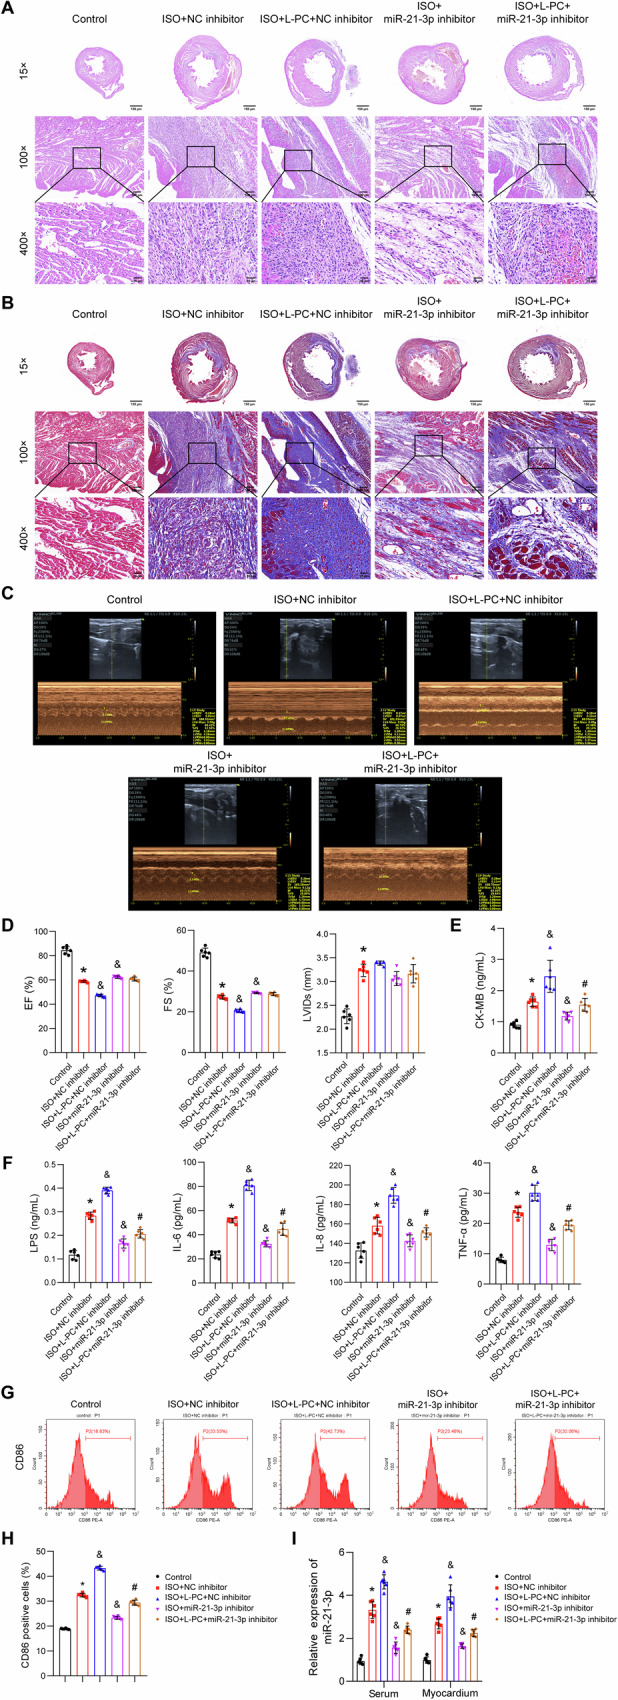
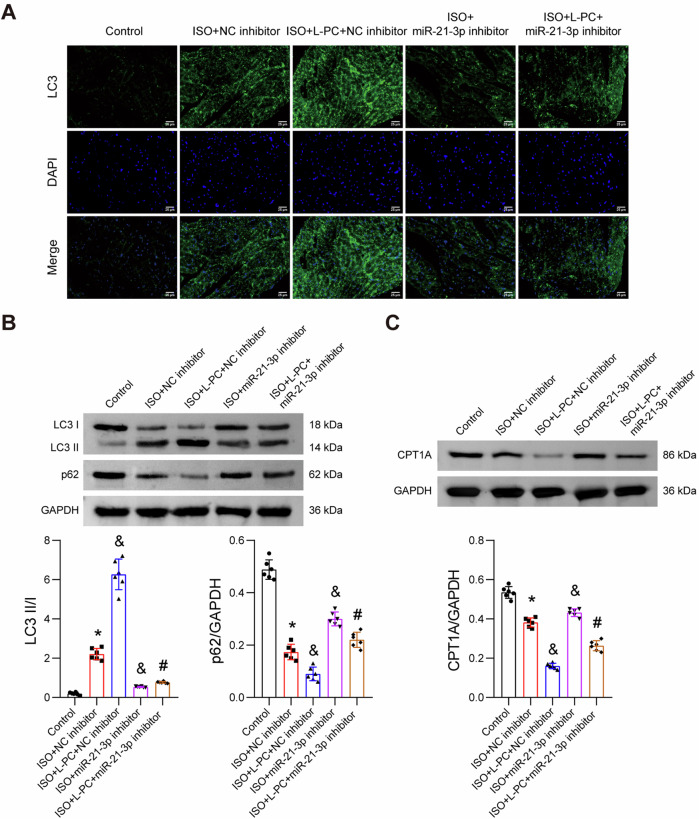
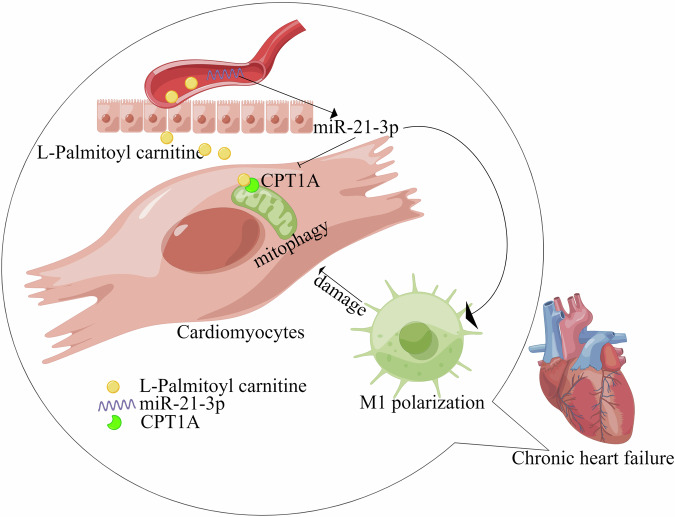
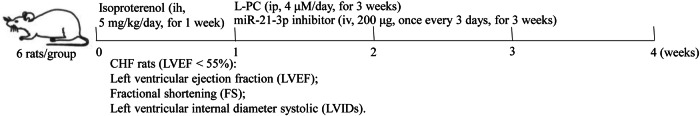
Chronic heart failure (CHF) is closely associated with inflammation and mitochondrial dysfunction in cardiomyocytes. This study attempts to investigate the effects of microRNA-21-3p (miR-21-3p) on macrophage polarization and mitophagy in CHF. Here we found miR-21-3p was upregulated in CHF and negatively correlated with carnitine palmitoyl transferase 1A (CPT1A). L-palmitoyl carnitine (L-PC) exacerbated isoproterenol (ISO)-induced myocardial structural disruption and fibrosis in rats, which was exacerbated by miR-21-3p. Mechanistically, miR-21-3p accelerated M1 macrophage polarization. Both miR-21-3p inhibitor and CPT1A overexpression suppressed mitophagy. The inhibition of CPT1A on mitophagy was reversed by miR-21-3p. MiR-21-3p targeted CPT1A mRNA and co-localized with CPT1A protein in cardiomyocytes. In the co-culture system of M1 macrophages and H9c2 cells, miR-21-3p mimics in H9c2 cells promoted M1 polarization, whereas miR-21-3p inhibitor reduced M1 phenotype. M1 macrophages exacerbated H9c2 cell damage. These findings support the potential therapeutic targeting of miR-21-3p to regulate inflammation and mitophagy by inducing CPT1A in CHF.


Conflict of interest statement

The authors declare no competing interests.

Figures

Fig. 1
Fig. 1. L-PC treatment exacerbates the development of ISO-induced CHF in rats.
A Representative echocardiographic images. B EF, FS, and LVIDs. C Changes in serum CK-MB levels by ELISA. D Changes in serum LPS, IL-5, IL-8, and TNF-α levels by ELISA. E Representative images of hematoxylin-eosin-stained cardiac tissue. Scale bar, 100 μm (top) and 25 μm (bottom). F Representative images of cardiac tissue stained with Masson trichrome stain. Scale bar, 100 μm (top) and 25 μm (bottom). G IF staining analysis of LC3 (green) and DAPI (blue) fluorescence in cardiac tissue. Scale bar, 25 μm. H Western blotting analysis of LC3II/I and p62 in cardiac tissue. I Evaluation of CPT1A expression in cardiac tissue after L-PC treatment by qRT-PCR and western blotting. *P < 0.05 vs. control. &P < 0.05 vs. ISO. All experiments consisted of 6 biological replicates, each representing the average of 3 technical replicates.
Fig. 2
Fig. 2. L-PC increases the level of miR-21-3p and miR-21-3p enhances the M1 phenotype in macrophages.
A qRT-PCR detection of miR-21-3p levels in serum of patients with CHF. *P < 0.05 vs. normal. Experiment A consisted of 12 biological replicates, each representing the average of 3 technical replicates. B qRT-PCR detection of miR-21-3p levels in serum and heart of rats. C Pearson correlation analysis of miR-21-3p levels and CPT1A levels in heart. D Flow cytometry analysis of the effect of L-PC on the enrichment of macrophage surface markers CD86 and CD206 in spleen tissues of ISO-induced model. *P < 0.05 vs. control. &P < 0.05 vs. ISO. E qRT-PCR detection of miR-21-3p levels in Mφ, M1 and M2 macrophages. *P < 0.05 vs. Mφ. F qRT-PCR detection of the secretion of cytokines IL-1β and TNF-α in M1 macrophages by miR-21-3p. G Flow cytometry analysis of the effect of miR-21-3p on the surface marker CD86 in M1 macrophages. *P < 0.05 vs. M1. Experiments B to G consisted of 6 biological replicates, each representing the average of 3 technical replicates.
Fig. 3
Fig. 3. miR-21-3p binds to CPT1A and promotes excessive mitophagy in H9c2 cells.
A Prediction of potential binding sites of miR-21-3p to CPT1A using miRmap. B Validation of miR-21-3p binding to CPT1A by dual-LUC assay. *P < 0.05 vs. CPT1A-WT+NC mimics. C qRT-PCR analysis of miR-21-3p levels in H9c2 cells. D Evaluation of the effect of miR-21-3p on cell viability in H9c2 cells using CCK8 assay. E Analysis of the effects of miR-21-3p on the protein levels of LC3 II, LC3I, p62 and CPT1A in H9c2 cells using Western blotting. F Observation of the effect of miR-21-3p on the number of autophagosome-like structures in H9c2 cells by transmission electron microscopy. Scale bars: 2 μm and 500 nm. *P < 0.05 vs. control. & P < 0.05 vs. NC inhibitor. G qRT-PCR analysis of miR-21-3p and CPT1A mRNA levels in H9c2 cells. H Evaluation of the effect of CPT1A and miR-21-3p on cell viability in H9c2 cells using CCK8 assay. I Western blotting analysis of the effects of CPT1A and miR-21-3p on the protein levels of LC3 II, LC3I, p62, and CPT1A in H9c2 cells. J Observation of the effects of CPT1A and miR-21-3p on the number of autophagosome-like structures in H9c2 cells by transmission electron microscopy. Scale bars: 2 μm and 500 nm. K IF staining showing the subcellular localization of miR-21-3p and CPT1A in H9c2 cells. Scale bar: 25 μm. *P < 0.05 vs. oe-NC. &P < 0.05 vs. oe-CPT1A+NC mimic. All experiments consisted of 6 biological replicates, each representing the average of 3 technical replicates.
Fig. 4
Fig. 4. MiR-21-3p regulates M1 macrophage polarization and H9c2 cell autophagy in the co-culture model.
A Establishment of a co-culture system between LPS/IFN-γ-induced M1 macrophages and H9c2 cells. Examination of the effect of H9c2 cells on the expression of the surface marker CD86 in macrophages by flow cytometry. *P < 0.05 vs. M1+H9c2 (NC). &P < 0.05 vs. M1+H9c2 (ISO+L-PC+NC). B Levels of CK-MB in the supernatant of H9c2 cells after co-culture by ELISA. C Levels of IL-6, IL-8 and TNF-α in the supernatant of H9c2 cells after co-culture by ELISA. D Observation of the punctate accumulation of LC3B in H9c2 cells after co-culture by immunofluorescence. Scale bar: 25 μm. E Western blotting analysis of LC3 II, LC3I and p62 in H9c2 cells after co-culture. *P < 0.05 vs. H9c2 (NC). & P < 0.05 vs. M1+H9c2 (NC). #P < 0.05 vs. M1+H9c2 (ISO+L-PC+NC). All experiments consisted of 6 biological replicates, each representing the average of 3 technical replicates.
Fig. 5
Fig. 5. MiR-21-3p inhibitor restores the development of rat HF induced by ISO and L-PC.
A Representative images of hematoxylin-eosin staining of cardiac tissue sections. Scale bar, 100 μm (up) and 25 μm (down). B Representative images of Masson’s trichrome staining of cardiac tissue sections. Scale bar, 100 μm (up) and 25 μm (down). C Representative echocardiographic images. D EF, FS, and LVIDs. E Levels of CK-MB in rat serum by ELISA. F Levels of LPS, IL-6, IL-8, and TNF-α in rat serum by ELISA. G, H Flow cytometry analysis of CD86 expression in rat spleen tissue. I qRT-PCR determined levels of miR-21-3p in rat serum and heart. *P < 0.05 vs. control. &P < 0.05 vs. ISO+NC inhibitor. #P < 0.05 vs. ISO+L-PC+NC inhibitor. All experiments consisted of 6 biological replicates, each representing the average of 3 technical replicates.
Fig. 6
Fig. 6. MiR-21-3p inhibitor inhibits excessive autophagy in heart tissue after ISO and L-PC treatment.
A Immunofluorescence images of LC3-labeled cells in the heart. Scale bar, 25 μm. B Western blotting analysis of LC3 II, LC3I and p62 expression in rat heart. C Western blotting analysis of CPT1A expression in rat heart. *P < 0.05 vs. control. &P < 0.05 vs. ISO+NC inhibitor. #P < 0.05 vs. ISO+L-PC+NC inhibitor. All experiments consisted of 6 biological replicates, each representing the average of 3 technical replicates.
Fig. 7
Fig. 7
A graphical abstract illustrating that L-PC promotes mitophagy in cardiomyocytes and M1 macrophage polarization through the miR-21-3p/CPT1A axis.
Fig. 8
Fig. 8
A graphical flow chart for the animal study.

References

    1. Kaspar, M. et al. Underestimated prevalence of heart failure in hospital inpatients: a comparison of ICD codes and discharge letter information. Clin. Res. Cardiol.107, 778–787 (2018). - PMC - PubMed
    1. Zhang, Y. et al. Propofol compared with sevoflurane general anaesthesia is associated with decreased delayed neurocognitive recovery in older adults. Br. J. Anaesth.121, 595–604 (2018). - PubMed
    1. Frangogiannis, N. G. Cardiac fibrosis: cell biological mechanisms, molecular pathways and therapeutic opportunities. Mol. Asp. Med.65, 70–99 (2019). - PubMed
    1. Lopaschuk, G. D., Karwi, Q. G., Tian, R., Wende, A. R. & Abel, E. D. Cardiac energy metabolism in heart failure. Circ. Res.128, 1487–1513 (2021). - PMC - PubMed
    1. Fillmore, N., Mori, J. & Lopaschuk, G. D. Mitochondrial fatty acid oxidation alterations in heart failure, ischaemic heart disease and diabetic cardiomyopathy. Br. J. Pharmacol.171, 2080–2090 (2014). - PMC - PubMed

MeSH terms

LinkOut - more resources