. 2024 Nov;25(11):2152-2165.
doi: 10.1038/s41590-024-01994-8. Epub 2024 Oct 22.

A longitudinal single-cell atlas of anti-tumour necrosis factor treatment in inflammatory bowel disease

Affiliations

A longitudinal single-cell atlas of anti-tumour necrosis factor treatment in inflammatory bowel disease

Tom Thomas et al. Nat Immunol. 2024 Nov.

Abstract

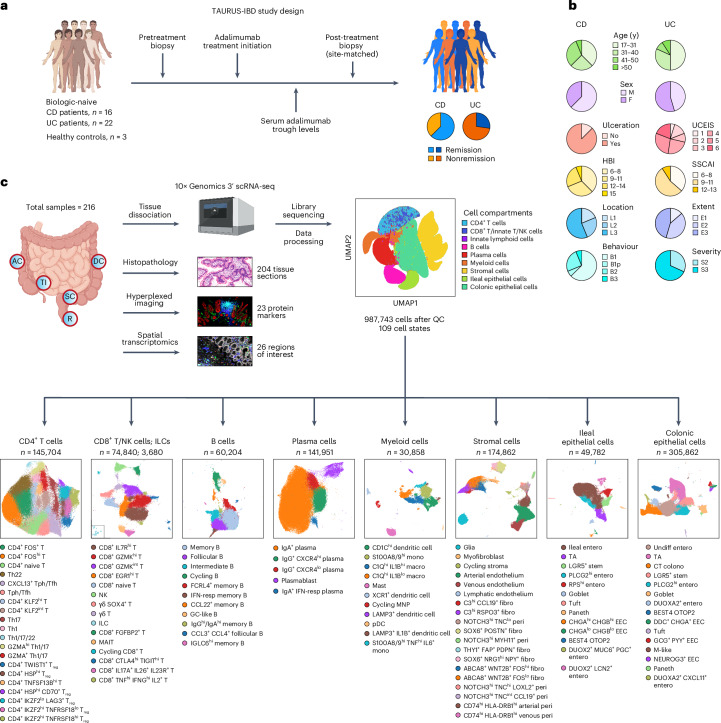
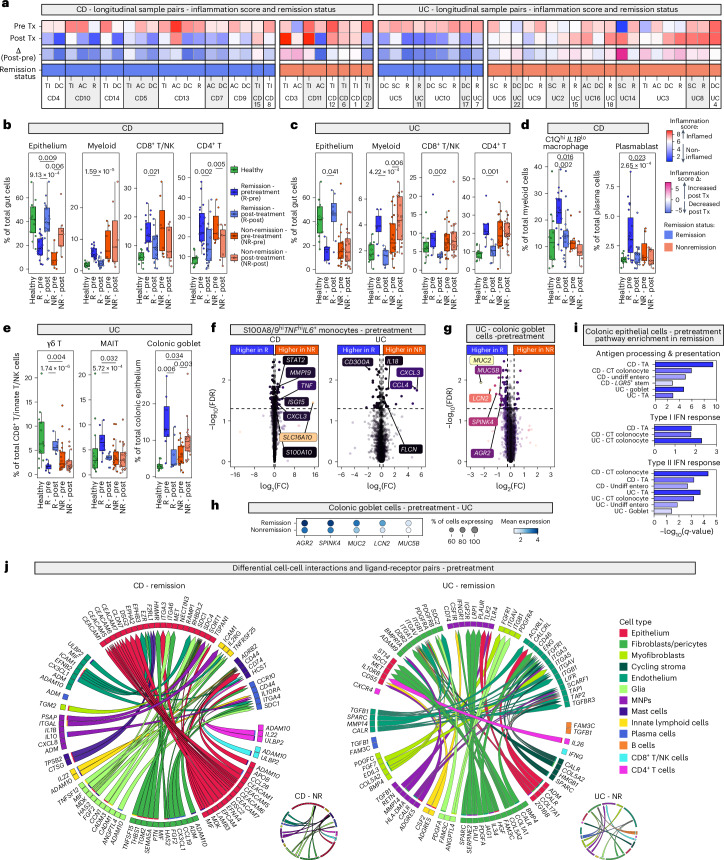
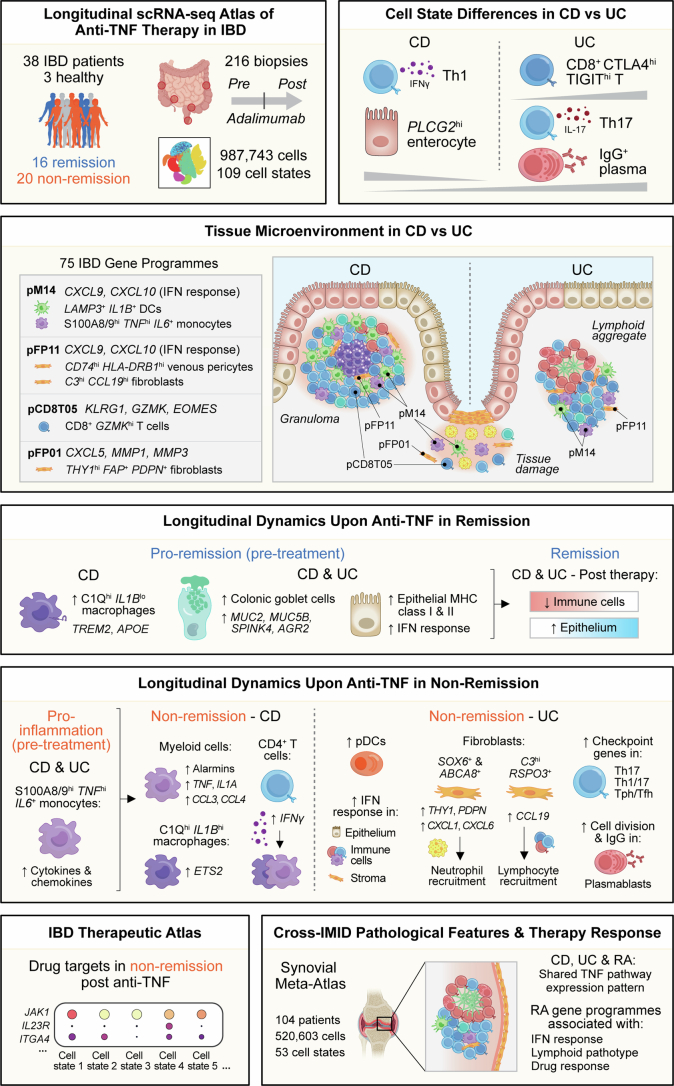
Precision medicine in immune-mediated inflammatory diseases (IMIDs) requires a cellular understanding of treatment response. We describe a therapeutic atlas for Crohn's disease (CD) and ulcerative colitis (UC) following adalimumab, an anti-tumour necrosis factor (anti-TNF) treatment. We generated ~1 million single-cell transcriptomes, organised into 109 cell states, from 216 gut biopsies (41 subjects), revealing disease-specific differences. A systems biology-spatial analysis identified granuloma signatures in CD and interferon (IFN)-response signatures localising to T cell aggregates and epithelial damage in CD and UC. Pretreatment differences in epithelial and myeloid compartments were associated with remission outcomes in both diseases. Longitudinal comparisons demonstrated disease progression in nonremission: myeloid and T cell perturbations in CD and increased multi-cellular IFN signalling in UC. IFN signalling was also observed in rheumatoid arthritis (RA) synovium with a lymphoid pathotype. Our therapeutic atlas represents the largest cellular census of perturbation with the most common biologic treatment, anti-TNF, across multiple inflammatory diseases.


Conflict of interest statement

T.T. has received research support from Celsius Therapeutics and consulting fees from Abbvie and ZuraBio. D.A. is an employee and shareholder of Novartis Pharma AG. This article reflects the authors’ personal opinions and not that of their employer. R.P. is employed by Scorpion Therapeutics and holds equity in Celsius Therapeutics. F.M.P. received research support from Roche and Janssen and consulting fees from GSK, Novartis and Genentech. H.H.U. received research support or consultancy fees from Janssen, Eli Lilly, UCB Pharma, BMS/Celgene, MiroBio, Mestag and OMass. A.F. has consulted for Janssen and Sonoma and has received research funding from BMS, Roche, UCB, Nascient, Mestag, GSK and Janssen. S.T. has received grants and research support from AbbVie, Buhlmann, Celgene, Celsius, ECCO, Helmsley Trust, IOIBD, Janssen, Lilly, Pfizer, Takeda, UKIERI, Vifor and Norman Collisson Foundation; consulting fees from AbbVie, ai4gi, Allergan, Amgen, Apexian, Arcturis, Arena, AstraZeneca, Bioclinica, Biogen, BMS, Buhlmann, Celgene, ChemoCentryx, Clario, Cosmo, Dynavax, Endpoint Health, Enterome, EQrX, Equillium, Ferring, Galapagos, Genentech/Roche, Gilead, GSK, Immunocore, Indigo, Janssen, Lilly, Mestag, Microbiotica, Novartis, Pfizer, Phesi, Protagonist, Sanofi, Satisfai, Sensyne Health, Sorriso, Syndermix, Takeda, Theravance, Topivert, UCB Pharma, VHsquared and Vifor; and speaker fees from AbbVie, Amgen, Biogen, BMS, Falk, Ferring, Janssen, Lilly, Pfizer and Takeda. C.D.B., M.B., M.C. and S.R. are founders of Mestag Therapeutics. M.F. received research support and consulting fees from Eli Lilly and Ono Pharmaceuticals. The remaining authors declare no competing interests.

Figures

Fig. 1
Fig. 1. An overview of the TAURUS study.
a, ‘Tissue biomarkers for AdalimUmab in inflammatory bowel disease and RheUmatoid arthritiS’ (TAURUS)-IBD study design outlining sample collection before and after treatment from biologic naïve patients with IBD. b, Clinical characteristics of patients included in TAURUS-IBD. See Supplementary Table 1 for more details. c, TAURUS workflow outlining number of high-quality transcriptomes (987,743 cells) generated across compartments with associated cell states and uniform manifold approximation and projection visualisations. AC, ascending colon; CD, Crohn’s disease; colono, colonocyte; DC, descending colon; EEC, enteroendocrine cell; entero, enterocyte; F, female; fibro, fibroblast; GC, germinal centre; hi, high; HBI, Harvey-Bradshaw Index; IFN-resp, interferon-responsive; ILC, innate lymphoid cell; lo, low; M, male; macro, macrophage; MAIT, mucosal-associated invariant T; MNP, mononuclear phagocyte; mono, monocyte; NK, natural killer cells; pDC, plasmacytoid dendritic cell; peri, pericyte; R, rectum; RPShi, ribosomal protein S-high; SSCAI, Simple Clinical Colitis Activity Index; SC, sigmoid colon; TA, transit-amplifying; Tfh, CD4+ follicular helper T cell; Tph, CD4+ peripheral helper T cell; Th, CD4+ T helper cell; TI, terminal ileum; Treg, CD4+ regulatory T cell; UCEIS, Ulcerative Colitis Endoscopic Index of Severity; UC, ulcerative colitis; Undiff, undifferentiated.
Fig. 2
Fig. 2. Epithelial and lymphocyte stoichiometry underpins cellular distinctions between CD and UC.
a, Stacked barplots showing proportion of cell compartments within individual gut samples and barplot of per sample cell counts. Samples are ordered according to inflammatory score. b, Violin plots showing distribution of inflammation scores across healthy (n = 12 samples from 3 patients), CD (n = 33 inflamed, 63 noninflamed samples from 16 patients) and UC (n = 50 inflamed, 53 noninflamed samples from 22 patients) samples. Wilcoxon rank-sum test used to test significance (two-sided). c–f, Boxplots showing cell state as a proportion of the ‘low’ resolution cell subpopulations (see Extended Data Fig. 1 for cellular hierarchy), for CD noninflamed (CD-NI), CD inflamed (CD-I), UC noninflamed (UC-NI) and UC inflamed (UC-I) gut samples. Boxplots show median, first (lower hinge) and third (upper hinge) quartiles; whiskers show 1.5× interquartile range. Sample numbers as in (b). MASC was used to test abundance across inflammation status and disease with nested random effects accounting for multiple samples per patient, and covariates (Methods). Only significant (two-sided Padj < 0.05) differences after multiple comparisons correction with Benjamini-Hochberg (BH) are shown. g, Cell-cell interaction plots showing ligand-receptor pairs enriched in inflamed CD versus inflamed UC. h, Mean expression of mRNA transcripts at the ‘intermediate’ cell resolution is shown for TNF, TNFRSF1A and TNFRSF1B in pretreatment inflamed samples in CD and UC. PROGENy was applied to pretreatment inflamed samples to calculate TNF signalling scores. Heatmap shows relative enrichment of TNF signalling scores. Barplots show median cell percentage of total cells. i, Spatial distribution of TNFRSF1A and TNFRSF1B in the gut compared to negative control (RNAscope); three serial sections per probe from one patient. DC, dendritic cell; EEC, enteroendocrine cell; entero, enterocyte; GC, germinal centre; hi: high; ILC, innate lymphoid cell; lo, low; MNP, mononuclear phagocyte; Th, CD4+ T helper cell.
Fig. 3
Fig. 3. Hubs of gene expression programmes are associated with spatial niches in CD and UC.
a,b, Network graph of covarying GEPs that constitute inflammatory hubs in (a) CD and (b) UC. Common weighted genes (within top 50) across constituent GEPs within hubs are shown below network graph. See Supplementary Table 5 for full list of cNMF GEPs in IBD and associated GO term enrichment in GEPs. c,d, Virtual H&E with multiplexed imaging highlighting representative regions of tissue and associated protein markers in (c) CD (n = 4 patients) and (d) UC (n = 5 patients). Sections shown from two patients from each disease. e, Representative GeoMx image of ROIs across submucosal aggregates (15 ROIs), mucosal aggregates (16 ROIs) and lamina propria (10 ROIs) from IBD samples, with antibody staining for CD45, CD3, CD20-CD38. f, Differential gene expression comparing mucosal aggregates (16 ROIs) and lamina propria (10 ROIs). g, GEP projection onto GeoMx samples; ROI numbers as in f, submucosal aggregates (15 ROIs). Boxplots show median, first (lower hinge) and third (upper hinge) quartiles; whiskers show 1.5× interquartile range. Kruskal-Wallis one-way analysis of variance conducted with subsequent pairwise testing with Wilcoxon rank-sum. DC, dendritic cell; FC, fold change; IL, innate lymphoid; pB, B cell GEP; pCD4T, CD4+ T cell GEP; pCD8T, CD8+ T cell/NK GEP; pFP, fibroblast and pericyte GEP; pM, myeloid cell GEP; pP, plasma cell GEP; pV, vascular cell GEP; ROI, region of interest.
Fig. 4
Fig. 4. Pretreatment differences in remission and nonremission patient groups in CD and UC.
a, Heatmap showing inflammation score for paired pre- and post-treatment samples (CD and UC). R, rectum; Tx, treatment. b, Boxplots showing proportion of cell compartment out of total cells in samples from 3 healthy individuals (12 samples), 10 CD remission patients (19 pretreatment and 19 post-treatment samples) and 5 CD nonremission patients (7 pretreatment and 7 post-treatment samples). Boxplots show median, first (lower hinge) and third (upper hinge) quartiles; whiskers show 1.5× interquartile range (be). Differential abundance testing at baseline and longitudinally using MASC (be). For baseline, only inflamed samples were included. BH-adjusted P values (two-sided) shown. c, Boxplots showing proportion of cell compartment out of total cells in sample across 3 healthy individuals (12 samples), 4 UC remission patients (8 pretreatment and 8 post-treatment samples) and 13 UC nonremission patients (21 pretreatment and 21 post-treatment samples). d, Boxplots showing proportion of cell state out of total myeloid cells (left) and total plasma cells (right). Sample numbers as in (b). e, Boxplots showing proportion of cell state out of total CD8+ T/innate T/NK cells (left and middle) and total colonic epithelium (right). Sample numbers as in (c). f, Differential expression comparing pretreatment remission and nonremission S100A8/9hi TNFhi IL6+ monocytes using MAST. Sample numbers as in (b) and (c) for CD and UC, respectively. g, Differential expression comparing pretreatment colonic goblet cells between remission and nonremission in UC using MAST. Sample numbers as in (c). h, Dotplot showing select genes in pretreatment colonic goblet cells in UC remission and nonremission subgroups at baseline using MAST. Sample numbers as in (c). i, Gene set enrichment analysis conducted on differential expression analysis of pretreatment samples in CD and UC comparing remission and nonremission epithelial cell states. j, Cell-cell interaction plots showing ligand-receptor pairs enriched in remission at baseline in CD (left) and UC (right). Insets show respective nonremission plots. AC, ascending colon; CT, crypt top; DC, descending colon; FC, fold change; IFN, interferon; MAIT, mucosal-associated invariant T cells; MNP, mononuclear phagocytes; NK, natural killer cells; NR, nonremission; SC, sigmoid colon; R, remission; TA, transit-amplifying cells; TI, terminal ileum; Tx, treatment; Undiff entero, undifferentiated enterocyte.
Fig. 5
Fig. 5. Cellular and molecular changes following adalimumab in CD and UC.
a, Schematic showing patterns of cell abundance changes by treatment status and outcome, compared to health. b,c, Heatmaps showing cell state abundances by treatment status and outcome, compared to health in (b) CD and (c) UC. Pattern numbers as in (a). Asterisks indicate BH-adjusted P value < 0.05. Pretreatment, asterisks indicate significant differences at baseline between remission outcomes. Post-treatment, asterisks indicate significant differences from baseline to post-treatment. Sample numbers for be are as outlined in Fig. 4b,c. d, Boxplots showing proportion of THY1+ FAP+ PDPN+ fibroblasts out of total fibroblast/pericytes across CD (left) and UC (right) treatment and outcome groups. Boxplots show median, first (lower hinge) and third (upper hinge) quartiles; whiskers show 1.5x interquartile range (d,e). Differential abundance testing at baseline and longitudinally using MASC; BH-adjusted P values (two-sided) shown (d,e). e, Boxplots showing proportion of pDCs out of total myeloid cells across UC treatment and outcome groups. f, Cell-cell interaction plots showing differential ligand-receptor pairs enriched in CD (left) and UC (right) post-treatment nonremission. Insets show remission plots. DC, dendritic cell; EEC, enteroendocrine cell; GC, germinal centre; hi, high; IFN, interferon; ILC, innate lymphoid cell; int, intermediate; lo, low; MAIT, mucosal-associated invariant T; MNP, mononuclear phagocyte; mono, monocyte; NK, natural killer cells; NR, nonremission; pDC, plasmacytoid dendritic cell; R, remission; TA, transit-amplifying; Tfh, CD4+ follicular helper T cell; Tph, CD4+ peripheral helper T cell; Th, CD4+ T helper cell; Treg, CD4+ regulatory T cell; Tx, treatment.
Fig. 6
Fig. 6. Inflammatory pathways shared between IBD and RA are associated with the lymphoid pathotype in the joint.
a, TAURUS-RA study design and integration with external datasets to create a synovial tissue meta-atlas,. b, Mean mRNA transcript expression at the cell-state resolution is shown for TNF, TNFRSF1A and TNFRSF1B in inflamed RA samples. TNF signalling scores in inflamed RA samples by PROGENy. Heatmap shows relative enrichment of TNF signalling scores. c, Gene expression programme (GEP) correlations. Asterisk indicates significantly correlated GEP pairs (Padj < 0.1). Solid lines demarcate highly correlated GEP hubs. d, Only AMP2 samples included in this analysis as only this dataset had H&E aggregate grading and infiltrate density. Spearman correlations between GEP expression and proportion of CD45+ cells per sample, worst grade of aggregates and mean infiltration as indicated by associated H&E with BH correction for GEP numbers within cell compartments. Number of asterisks indicates significance level (two-sided): *0.01 ≤ Padj < 0.05, **0.001 ≤ Padj < 0.01, ***0.0001 ≤ Padj < 0.001, ****Padj < 0.0001. e, Associations between GEP expression and histological pathotypes. Only AMP2 data were included in this analysis; diffuse (n = 30 patients), lymphoid (n = 33 patients) and pauci-immune (n = 7 patients) pathotypes. Boxplots show median, first (lower hinge) and third (upper hinge) quartiles; whiskers show 1.5x interquartile range. Kruskal-Wallis one-way analysis of variance conducted to test association between GEPs within cell compartments which were positively correlated with proportion of CD45+ cells, with FDR correction for GEP number within cell compartments. Pairwise Wilcoxon rank-sum tests only conducted for significant GEPs, with FDR correction for pairwise comparisons between histological pathotypes. Significant adjusted P values displayed above relevant comparisons. CRP, C-reactive protein; CDAI, clinical disease activity index; DC, dendritic cell; ESR, erythrocyte sedimentation rate; fibro, fibroblast; GC, germinal centre; HSPhi, heat shock protein-high; IFIThi, Interferon induced proteins with tetratricopeptide repeat genes-high; ILC, innate lymphoid cell; MAIT, mucosal-associated invariant T; MNP, mononuclear phagocyte; MThi, mitochondrial-high; NK, natural killer; OA, osteoarthritis; pB, B cell GEP; pDC, plasmacytoid dendritic cell; physglob, physician global assessment RA; pM, myeloid cell GEP; pP, plasma cell GEP; pS, stromal cell GEP; pT, T/NK cell GEP; RPShi, ribosomal protein S-high; Tph, CD4+ peripheral helper T cell; Treg, CD4+ regulatory T cell.
Extended Data Fig. 1
Extended Data Fig. 1. Sample processing, annotation hierarchy and gut cell state markers.
a, Schematic showing bioinformatic pre-processing strategy for gut samples. Panpipes pipeline was used for pre-processing. Uniform manifold approximation and projection (UMAP) visualisations show the cellular landscape of gut samples coloured by inflammation status, and batch. See Methods for more details. b, Hierarchy shows annotation across increasing cell type resolution: compartment, low, intermediate and cell state. Dotplots showing expression of marker genes of cell states in the scRNA-seq dataset: (c) CD4+ T cell, (d) CD8+ T/innate T/NK/IL cell, (e) B cell, (f) myeloid cell, (g) plasma cell, (h) stromal cell, (i) ileal epithelial cell and (j) colonic epithelial cell. Genes relate to Supplementary Table 2. Colono, colonocyte; DC, dendritic cell; EEC, enteroendocrine cell; entero, enterocyte; fibro, fibroblast; GC, germinal centre; hi, high; IFN-resp, interferon-responsive; ILC, innate lymphoid cell; lo, low; macro, macrophage; MAIT, mucosal-associated invariant T; MNP, mononuclear phagocyte; mono, monocyte; NK, natural killer; PC: principal components; pDC, plasmacytoid dendritic cell; peri, pericyte; TA, transit-amplifying; Tfh, CD4+ follicular helper T cell; Th, CD4+ helper T cell; Tph, CD4+ peripheral helper T cell; Treg, regulatory T cell; Undiff, undifferentiated.
Extended Data Fig. 2
Extended Data Fig. 2. Differences between the healthy ileum and colon.
a, Barplot summarising number of differentially expressed genes (DEGs) (Padj < 0.05) comparing healthy ileum (three samples) to healthy colon (nine samples) in three patients in each cell compartment. Limma-voom with DuplicateCorrelation used to adjust for multiple samples per patient. b,c, Cell state distribution within the epithelial compartment in (b) ileum and (c) colon displayed on a barplot. Error bar indicates standard error of mean. Sample numbers as in (a). d, prcomp from base R used to conduct PCA on CPM normalised and log-transformed read counts. Samples in context of principal components (PC) 1 and 2 along with associated percentage of variation explained. e, Loadings of genes associated with PC1 and PC2 shown in the barplots. f, Volcano plot showing results of differential expression (limma-voom) between ileum and colon in the epithelial compartment. Dashed lines demarcate two-sided BH-corrected Padj = 0.05 and log2 fold change (FC) = 0.5. g, Relative expression of vitamin-associated epithelial genes differentially expressed between ileum and colon shown in dotplot. Full results can be found in Supplementary Table 3. h,i, Overrepresentation analysis was performed by using the enrichGO function from clusterProfiler. All genes significantly associated with (h) ileum and (i) colon respectively tested for overrepresentation using gene ontology (GO) biological process gene sets. Red dashed line indicative of q-value = 0.05. j, Relative expression of mucin and mucin-associated genes differentially expressed between ileum and colon shown in dotplot. Full results can be found in Supplementary Table 3. k, Three-way DGE analysis of the healthy epithelium comparing descending, ascending colon and rectum. l, Dotplot of key differentially expressed genes by gut site.
Extended Data Fig. 3
Extended Data Fig. 3. The inflammation score in context of CD and UC.
a, Violin plot showing the distribution of the inflammation score across healthy and macroscopically noninflamed, as well as inflamed samples. b, PCA examining compartment abundance as a proportion of sample in CD. c, PCA of samples with CD with inflammation score plotted as a quantitative variable. d, PC1 loadings associated with cell compartment in samples with CD. e, PCA examining compartment abundance as a proportion of sample in UC. f, PCA of samples with UC with inflammation score plotted as a quantitative variable g, PC1 loadings associated with cell compartment in samples with UC h, Spearman correlation between inflammation score per sample and the recently described biopsy molecular inflammation score (bMIS). Line indicates linear regression with 95% confidence interval (grey band), two-sided P value shown. i, j, Differential abundance of cell states in CD (i) and UC (j) comparing noninflamed to inflamed tissue. Sample numbers as in Fig. 2b. Circles indicate odds ratios. Error bars show 95% confidence interval. DC, dendritic cell; hi, high; IFN-resp, interferon-responsive; ILC, innate lymphoid cell; lo, low; macro, macrophage; MAIT, mucosal-associated invariant T; MNP, mononuclear phagocyte; mono, monocyte; NK, natural killer; pDC, plasmacytoid dendritic cell; TA, transit-amplifying; Tfh, CD4+ follicular helper T cell; Th, CD4+ helper T cell; Tph, CD4+ peripheral helper T cell; Treg, regulatory T cell.
Extended Data Fig. 4
Extended Data Fig. 4. Correlation between cell state abundance, and clinical, endoscopic and histological measures of disease in CD and UC.
a-d, Spearman correlations between cell state abundance and (a) SSCAI and UCEIS (b) HBI (c) Nancy score in UC and (d) Nancy score in CD. For (a), and (b), the maximally inflamed sample for matched endoscopic procedure used. Asterisks indicate adjusted P values: *=0.01 ≤ Padj < 0.05, **=0.001 ≤ Padj <0.01, ***=Padj<0.001. CD, Crohn’s disease; colono, colonocyte; DC, dendritic cell; EEC, enteroendocrine cell; entero, enterocyte; fibro, fibroblast; GC, germinal centre; hi, high; HBI, Harvey-Bradshaw Index; IFN-resp, interferon-responsive; ILC, innate lymphoid cell; lo, low; macro, macrophage; MAIT, mucosal-associated invariant T; MNP, mononuclear phagocyte; mono, monocyte; NK, natural killer cells; pDC, plasmacytoid dendritic cell; RPShi, ribosomal protein S-high; SSCAI, simple clinical colitis activity index; TA, transit-amplifying; Tfh, CD4+ follicular helper T cell; Tph, CD4+ peripheral helper T cell; Th, CD4+ T helper cell; Treg, CD4+ regulatory T cell; UCEIS, ulcerative colitis endoscopic index of severity; UC, ulcerative colitis; Undiff, undifferentiated.
Extended Data Fig. 5
Extended Data Fig. 5. Expression of TNF and its receptors at the RNA and protein level in PBMCs.
a, PBMC subset gating strategy for intracellular staining of TNF protein. b, PBMC subset anti-TNF staining. c, TNF expression by scRNA-seq in PBMCs from patients with CD (top) and UC (bottom). d, PBMC subset gating strategy for cell surface staining of TNFR1 and TNFR2. e, PBMC subset anti-TNFR1 staining. f, PBMC subset anti-TNFR2 staining. g, TNFRSF1A and TNFRSF1B expression by scRNA-seq in PBMCs from patients with CD (top) and UC (bottom). MNP, mononuclear phagocyte; SSC, side scatter.
Extended Data Fig. 6
Extended Data Fig. 6. Enrichment of GEPs across cell states in the gut.
cNMF was used to derive GEP score for individual cells from inflamed samples with CD and UC in (a) CD4+ T, (b) CD8+ T, (c) B, (d) plasma, (e) vascular, (f) myeloid, and (g) fibroblast and pericyte cells. Mean expression of GEP quantified per cell state is plotted. pB: B cell GEP; pCD4T: CD4+ T cell GEP; pCD8T: CD8+ T cell/NK GEP; pFP: fibroblast and pericyte GEP; pM: myeloid cell GEP; pP: plasma cell GEP; pV: vascular cell GEP. DC, dendritic cell; fibro, fibroblast; GC, germinal centre; hi, high; IFN-resp, interferon-responsive; ILC, innate lymphoid cell; lo, low; macro, macrophage; MAIT, mucosal-associated invariant T; MNP, mononuclear phagocyte; mono, monocyte; NK, natural killer cell; pDC, plasmacytoid dendritic cell; peri, pericyte; Tfh, CD4+ follicular helper T cell; Tph, CD4+ peripheral helper T cell; Th, CD4+ T helper cell; Treg, CD4+ regulatory T cell.
Extended Data Fig. 7
Extended Data Fig. 7. Covarying GEPs in inflamed samples with CD and UC.
a,b, Correlogram demonstrating significant correlations (asterisks denote FDR < 0.1) between GEPs across cell compartments in inflamed samples with CD (a) and UC (b). Lines demarcate hubs. A module detection algorithm used for signed graphs was leveraged to detect hubs from a graph consisting of significantly correlated GEPs (nodes) and associated fisher-transformed correlations (edges). DC, dendritic cell; fibro, fibroblast; GC, germinal centre; hi, high; HSP, heat-shock proteins; IFN-resp, interferon-responsive; ILC, innate lymphoid cell; lo, low; macro, macrophage; MAIT, mucosal-associated invariant T; MNP, mononuclear phagocyte; mono, monocyte; MThi, mitochondrial-high; NK, natural killer cell; pB, B cell GEP; pCD4T, CD4+ T cell GEP; pCD8T, CD8+ T cell/NK GEP; pDC, plasmacytoid dendritic cell; peri, pericyte; pFP, fibroblast and pericyte GEP; pM, myeloid cell GEP; pP, plasma cell GEP; pV, vascular cell GEP; RPShi, ribosomal protein S-high; Tfh, CD4+ follicular helper T cell; Tph, CD4+ peripheral helper T cell; Th, CD4+ T helper cell; Treg, CD4+ regulatory T cell.
Extended Data Fig. 8
Extended Data Fig. 8. Longitudinal changes following adalimumab in CD and UC, and characterisation of the TNF pathway following adalimumab.
a-g, Volcano plot depicting cell state-specific differentially expressed genes in (a) CD, and (b-g) UC. Negative fold-change indicates increase in remission (post-pre). Positive fold-change indicates increase in nonremission (post-pre). h, Gene set enrichment analysis of UC longitudinal differential expression analysis (Supplementary Table 8) across compartments. i,j, Boxplots showing longitudinal differences in (i) pCD4T15 and (j) pCE08 enrichment UC nonremission post-treatment (Supplementary Table 8). Sample numbers as in Fig. 4. Boxplots show median, first (lower hinge) and third (upper hinge) quartiles; whiskers show 1.5x interquartile range. Differential abundance testing longitudinally using MASC. Differential GEP enrichment tested by generalised linear mixed models. BH-adjusted P values (two-sided) shown. Barplots show GEP top enriched pathways (Supplementary Table 5). k, PROGENy was used to calculate TNF signalling scores per cell. The 75th percentile score for TNF signalling in each ‘intermediate’ resolution level cell type was taken as representative of individual samples. Only paired samples were used to calculate median fold change (medFC) in remission and nonremission with significance testing using lmer function as part of the lmerTest package with individual patients modelled as random effects. Asterisks indicate BH-adjusted two-sided P values: *=0.01 ≤ Padj < 0.05, **=0.001 ≤ Padj <0.01, ***=Padj<0.001. l,m, Spearman correlation between TNF signalling fold change and TNF signalling score pre-therapy in patients achieving remission after adalimumab treatment in (l) CD and (m) UC. Line indicates linear regression with 95% confidence interval (grey band), two-sided P values shown. n, Dotplot showing expression of genes associated with approved advanced therapies, before and after adalimumab in UC nonremission. Bar chart shows median abundance of compartment in context of treatment (pre/post) as a proportion of total cells in sample. Ag, antigen; DC, dendritic cell; EEC, enteroendocrine cell; FC, fold change; fibro, fibroblast; GC, germinal centre; hi, high; IFN-resp, interferon-responsive; ILC, innate lymphoid cell; int, intermediate; lo, low; MAIT, mucosal-associated invariant T; MNP, mononuclear phagocyte; mono, monocyte; NK, natural killer cells; NR, nonremission; pDC, plasmacytoid dendritic cell; R, remission; RPShi, ribosomal protein S-high; TA, transit-amplifying; Tfh, CD4+ follicular helper T cell; Tph, CD4+ peripheral helper T cell; Th, CD4+ T helper cell; Treg, CD4+ regulatory T cell.
Extended Data Fig. 9
Extended Data Fig. 9. Synovial cell states, GEP enrichment of GEPs across cell states and treatment response associations.
a, Uniform manifold approximation and projections (UMAPs) of cell states in the scRNA-seq dataset. b-e, Dotplots showing the expression of cell state marker genes in (b) myeloid cells, (c) T/NK/IL cells, (d) B/plasma cells, and (e) stromal cells. f-j, cNMF was used to derive GEP scores for individual cells from inflamed samples with RA in (f) T/NK/IL, (g) B, (h) plasma, (i) myeloid, and (j) stromal cells. Mean expression of GEP quantified per cell state. k, Baseline visit samples in the R4RA study were selected for analysis; GEPs positively correlated with inflammation were tested for association with therapy nonresponse. Boxplots show median, first (lower hinge) and third (upper hinge) quartiles; whiskers show 1.5x interquartile range. Wilcoxon signed-rank test used to test for significance (Padj < 0.05, two-sided) between responders (29 patients) and non-responders (39 patients) to rituximab at baseline (also see Supplementary Table 9). l, GO term enrichment for GEPs associated with clinical response to rituximab. GO terms were generated by GOATOOLS overrepresentation analysis of the top 150 weighted genes in constituent GEPs. All genes tested were used as the gene universe. See Supplementary Table 9 for full list of cNMF GEPs in RA and associated GO term enrichment in GEPs. DC, dendritic cell; fibro, fibroblast; GC, germinal centre; hi, high; IFN-resp, interferon-responsive; ILC, innate lymphoid cell; lo, low; macro, macrophage; MAIT, mucosal-associated invariant T; MNP, mononuclear phagocyte; mono, monocyte; MThi, Mitochondrial-high; NK, natural killer cell; pDC, plasmacytoid dendritic cell; Tfh, CD4+ follicular helper T cell; Tph, CD4+ peripheral helper T cell; Treg, CD4+ regulatory T cell.
Extended Data Fig. 10
Extended Data Fig. 10. A longitudinal single-cell therapeutic atlas of adalimumab treatment in IBD.
Schematic summarising the TAURUS study design and key findings. Our resource provides a longitudinal, therapeutic scRNA-seq atlas comprising ~1 million cells organised into 109 cell states from 216 gut biopsies across 41 individuals (16 remission, 20 nonremission, 3 healthy). This atlas reveals differences in gut cell state abundance that distinguish CD and UC. Using a systems-biology approach we identify hubs of multi-cellular communities, based on 75 IBD gene programmes, which localise to distinct tissue microenvironments including granulomas specific to CD and areas of epithelial tissue damage and lymphoid aggregates found in both CD and UC. Upon investigating the inflammatory landscape of CD and UC pretreatment, we discern both pro-remission and pro-inflammatory cellular mediators that are associated with remission outcomes. Pro-remission encompasses specific epithelial and myeloid factors. Conversely, increased cytokine and chemokine expression in specific monocytes were seen in nonremission subgroups at baseline. Our longitudinal design has allowed us to elucidate persisting cellular drivers of nonremission post-adalimumab. In CD, we found a prominent role for specific myeloid autocrine signalling and CD4+ T cell-myeloid interactions. In UC, we dissected the multi-cellular nature of nonremission demonstrating the increase of pDCs, multi-compartmental interferon signalling, distinct fibroblast-derived recruitment signatures, specific T helper cell responses and IgG-skewed plasmablasts. Extending the study to RA through the generation of a synovial meta-atlas comprising 520,603 cells reveals a shared TNF pathway expression pattern in CD, UC and RA, as well IFN signalling associated with a lymphoid pathotype. Our therapeutic atlas informs drug positioning across IMIDs and suggests a rationale for the use of JAK and p19 inhibition following anti-TNF resistance. DC, dendritic cell; pCD8T, CD8+ T cell/NK GEP; pFP, fibroblast/pericyte GEP; pM: myeloid cell GEP; Th, CD4+ helper T cell; Tfh, CD4+ follicular helper T cell; Tph, CD4+ peripheral helper T cell.

References

    1. Brennan, F. M., Jackson, A., Chantry, D., Maini, R. & Feldmann, M. Inhibitory effect of TNF alpha antibodies on synovial cell interleukin-1 production in rheumatoid arthritis. Lancet2, 244–247 (1989). - PubMed
    1. Elliott, M. J. et al. Randomised double-blind comparison of chimeric monoclonal antibody to tumour necrosis factor alpha (cA2) versus placebo in rheumatoid arthritis. Lancet344, 1105–1110 (1994). - PubMed
    1. Derkx, B. et al. Tumour-necrosis-factor antibody treatment in Crohn’s disease. Lancet342, 173–174 (1993). - PubMed
    1. Ding, N. S., Hart, A. & De Cruz, P. Systematic review: predicting and optimising response to anti-TNF therapy in Crohn’s disease: algorithm for practical management. Aliment Pharm. Ther.43, 30–51 (2016). - PubMed
    1. Weinblatt, M. E. et al. Adalimumab, a fully human anti-tumor necrosis factor alpha monoclonal antibody, for the treatment of rheumatoid arthritis in patients taking concomitant methotrexate: the ARMADA trial. Arthritis Rheum.48, 35–45 (2003). - PubMed

MeSH terms