. 2024 Dec;21(12):1441-1458.
doi: 10.1038/s41423-024-01222-1. Epub 2024 Oct 23.

Ubiquitin regulatory X (UBX) domain-containing protein 6 is essential for autophagy induction and inflammation control in macrophages

Affiliations

Ubiquitin regulatory X (UBX) domain-containing protein 6 is essential for autophagy induction and inflammation control in macrophages

Young Jae Kim et al. Cell Mol Immunol. 2024 Dec.

Abstract

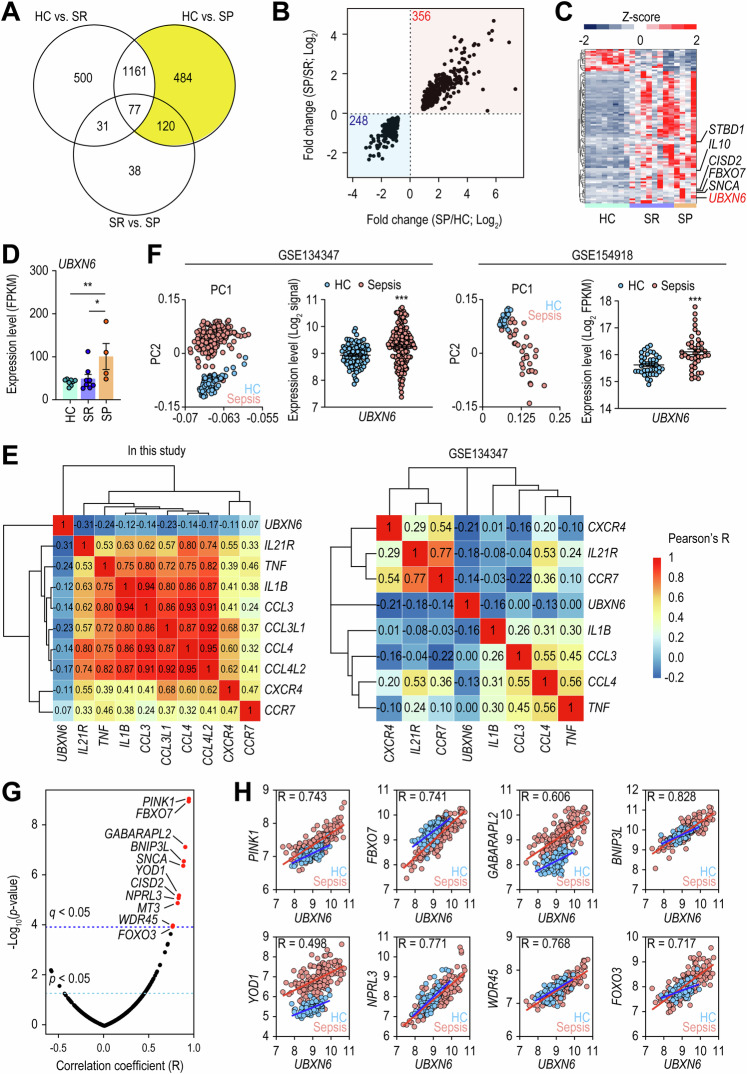
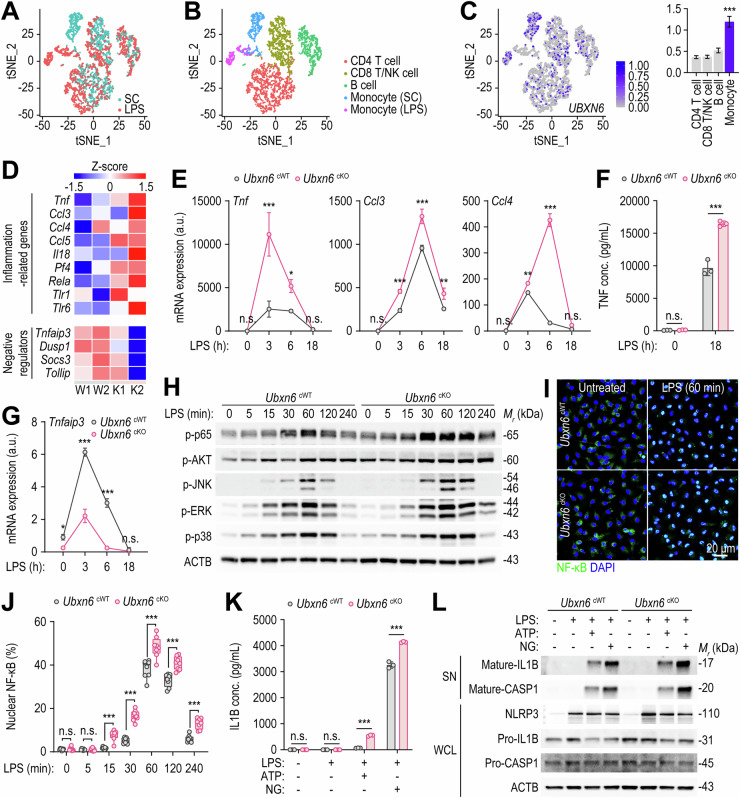
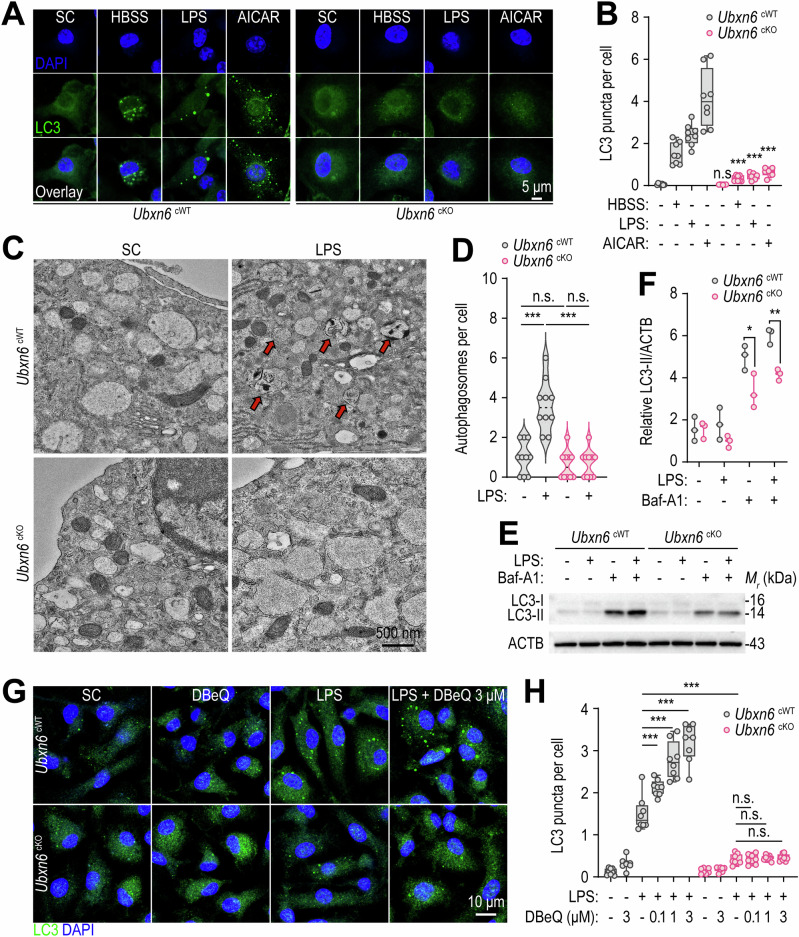
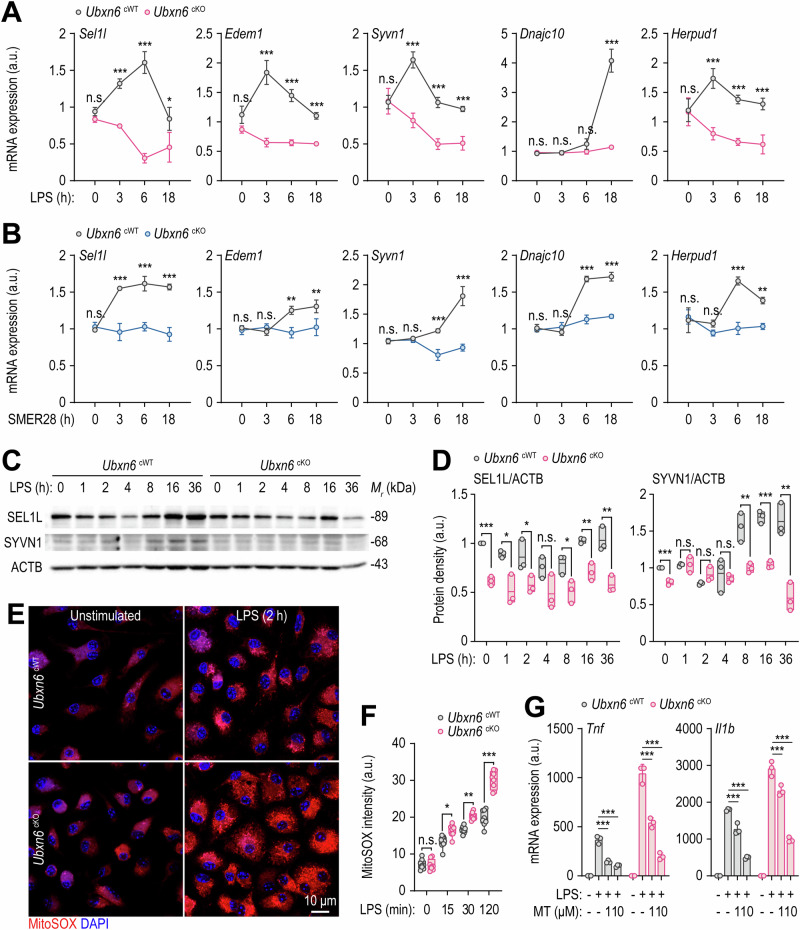
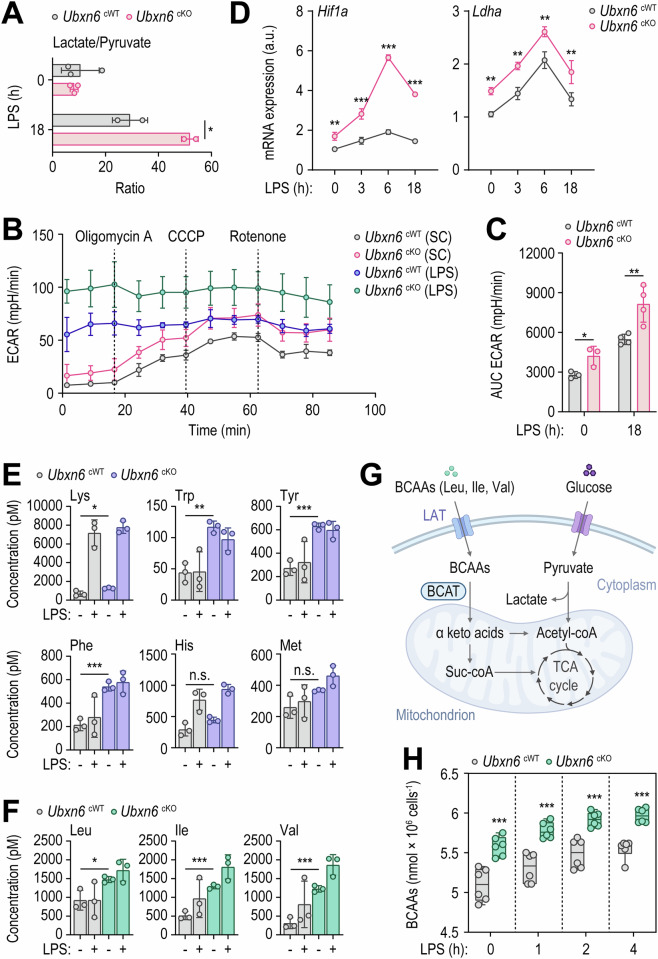
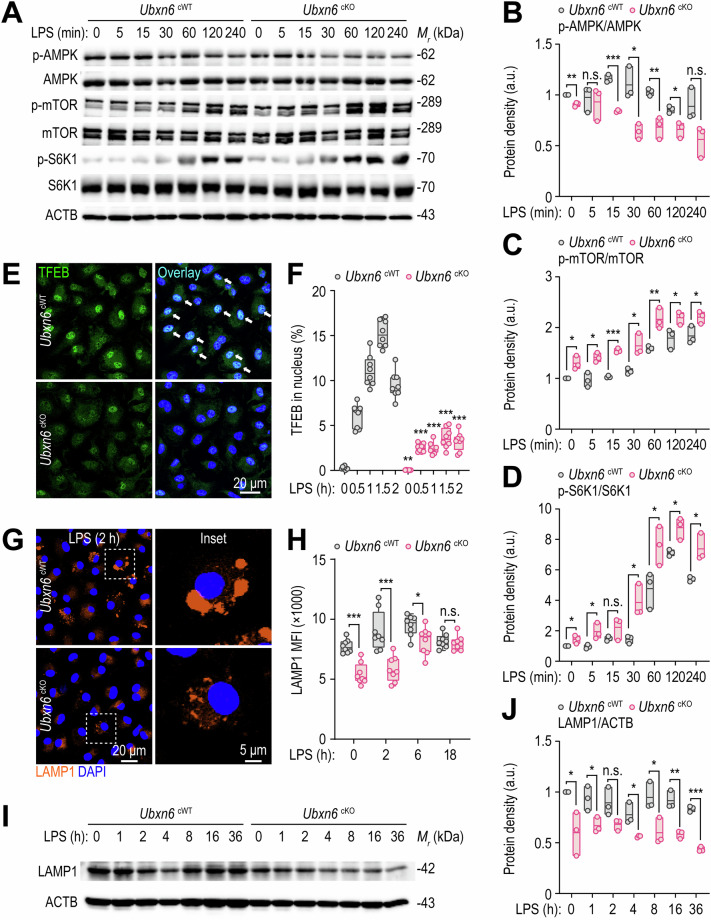
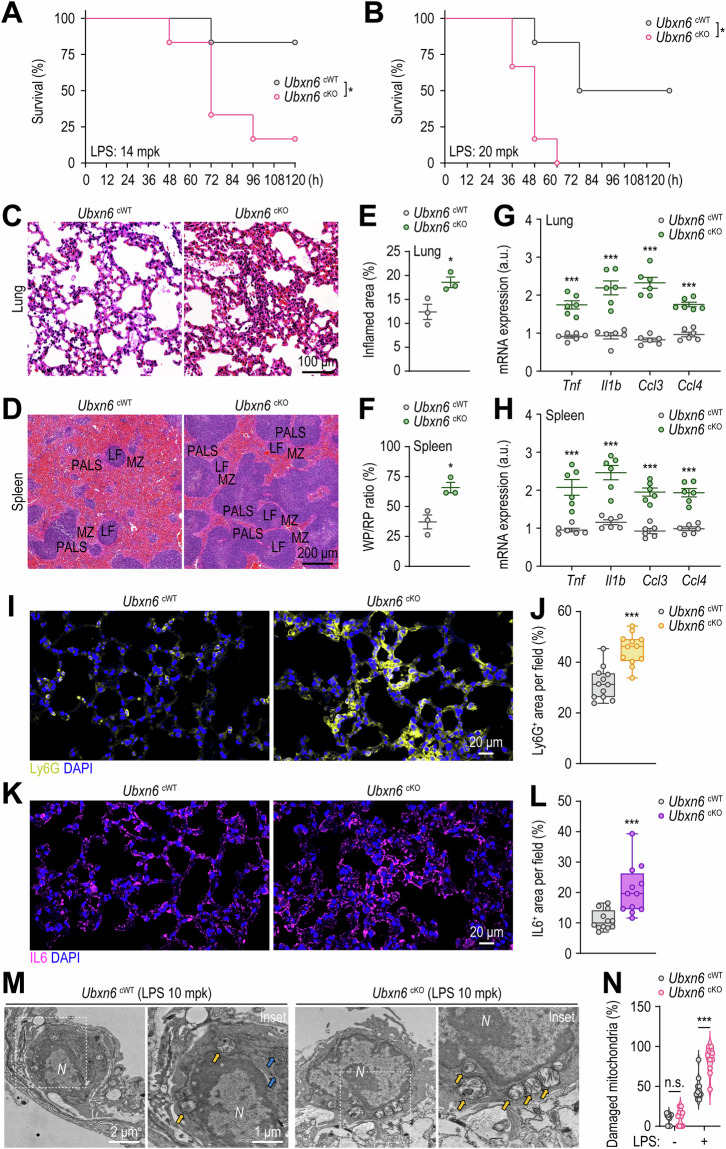
Ubiquitin regulatory X (UBX) domain-containing protein 6 (UBXN6) is an essential cofactor for the activity of the valosin-containing protein p97, an adenosine triphosphatase associated with diverse cellular activities. Nonetheless, its role in cells of the innate immune system remains largely unexplored. In this study, we report that UBXN6 is upregulated in humans with sepsis and may serve as a pivotal regulator of inflammatory responses via the activation of autophagy. Notably, the upregulation of UBXN6 in sepsis patients was negatively correlated with inflammatory gene profiles but positively correlated with the expression of Forkhead box O3, an autophagy-driving transcription factor. Compared with those of control mice, the macrophages of mice subjected to myeloid cell-specific UBXN6 depletion exhibited exacerbated inflammation, increased mitochondrial oxidative stress, and greater impairment of autophagy and endoplasmic reticulum-associated degradation pathways. UBXN6-deficient macrophages also exhibited immunometabolic remodeling, characterized by a shift to aerobic glycolysis and elevated levels of branched-chain amino acids. These metabolic shifts amplify mammalian target of rapamycin pathway signaling, in turn reducing the nuclear translocation of the transcription factor EB and impairing lysosomal biogenesis. Together, these data reveal that UBXN6 serves as an activator of autophagy and regulates inflammation to maintain immune system suppression during human sepsis.

Keywords: Autophagy; Immunosuppression; Inflammation; Sepsis; UBXN6.


Conflict of interest statement

Competing interests: The authors declare no competing interests. Ethics statement: This study was approved by the Institutional Research and Ethics Committee at Chungnam National University Hospital (Daejeon, Korea; CNUH 2018-03-058, CNUH 2020-07-082) and conducted in accordance with the Declaration of Helsinki [100]. Informed consent was obtained from all the subjects upon enrollment.

Figures

Fig. 1
Fig. 1
Compared with healthy controls, sepsis patients presented upregulated expression levels of UBXN6. A Diagram illustrating the number of DEGs identified by comparing HCs to SRs, HCs to SPs, and SRs to SPs. The yellow region highlights DEGs whose expression varies between HCs and SPs but not between HCs and SRs. B Graph depicting the fold changes in 604 genes from the yellow area of (A), with red indicating upregulated DEGs and blue indicating downregulated DEGs in SP. C Heatmap representing 91 ATG genes with differential expression. Hierarchical clustering of DEGs was performed on the basis of the Euclidean distance of relative expression. D Expression of UBXN6 in human PBMCs from HCs, SRs, and SPs in our cohort. *q value < 0.05, **q value < 0.01. E Gene expression correlations between UBXN6 and several inflammatory genes identified in our cohort and the publicly available GSE134347 dataset. The correlation coefficients are clustered hierarchically via the Euclidean distance method. F Principal component analysis of data from two publicly available cohorts, GSE134347 and GSE154918. The expression patterns of UBXN6 between HCs and sepsis patients within these cohorts are depicted. For GSE134347, microarray data were used, with log2-transformed signal intensities employed as expression levels. For GSE154918, RNA-seq data were used, with log2-transformed FPKM values representing expression levels. G Correlation test results for UBXN6 and 499 ATG genes. The 11 genes marked with red dots have a positive correlation with a statistically significant adjusted p value (q value) with a Bonferroni correction of less than 0.05. H Expression levels (log2-signal) and correlation values of UBXN6 and the 8 ATG genes in the GSE134347 cohort. The blue and red lines represent linear regressions for HCs and sepsis patients, respectively. The Pearson correlation coefficient (R) between the UBXN6 expression level and each gene was estimated via the correlation function implemented in R. All correlation tests yielded p values less than 2.2 × 10¹⁶. HC, healthy controls; SP, patients with a poor prognosis; SR, patients who had recovered; FPKM, fragments per kilobase of transcript per million mapped reads. *p < 0.05, **p < 0.01, and ***p < 0.001
Fig. 2
Fig. 2
The myeloid expression of UBXN6 controls LPS-induced proinflammatory responses in vitro. A Scatter plot based on tSNE analysis, depicting cell populations from both the solvent control (SC) and the LPS-stimulated (LPS) groups of human PBMCs. B Five distinct clusters identified and annotated via known cell type markers (refer to Fig. S2). C The section visualizing the expression of UBXN6, with a bar graph on the right displaying normalized UBXN6 read counts for each cluster. Statistical significance was determined via Wilcoxon’s rank sum test to compare the normalized read counts of UBXN6 between the monocyte clusters (SC and LPS) and each CD4, CD8/NK, and B-cell cluster. The p values for each comparison were all less than 1 × 10¹⁰. D Heatmap of representative inflammation-associated genes and negative regulatory genes related to inflammatory responses expressed in BMDMs after LPS stimulation (100 ng/mL) for 3 h. E Relative expression levels of Tnf, Ccl3, and Ccl4 mRNAs in BMDMs. The cells were stimulated with LPS (100 ng/mL) for the indicated periods and then lysed for qRT‒PCR. F TNF protein levels in the culture supernatants of BMDMs primed with or without LPS (100 ng/mL) were analyzed via ELISA. G Relative mRNA expression levels of Tnfaip3 in BMDMs stimulated with LPS (100 ng/mL) at the indicated times. H Western blotting of phosphorylated p65, AKT, JNK, ERK, and p38 protein levels in BMDMs treated with LPS (100 ng/mL) for the indicated times; ACTB served as the loading control. I, J Representative images (I) and quantification (J) of NF-κB nuclear translocation in BMDMs stimulated with LPS (100 ng/mL) for the indicated periods. The cells were stained with anti-NF-κB antibodies (green) for NF-kB and with DAPI (blue) for nucleic acid detection. Confocal microscopy was used to determine the fluorescence intensity of interest, which was then analyzed with FIJI software. K, L IL-1B protein levels in BMDMs were measured via ELISA (K) and Western blotting (L). BMDMs were primed with or without LPS (100 ng/mL) for 4 h, followed by stimulation with or without ATP (5 mM) or nigericin (10 μM) for 45 min. NLRP3 and the mature and precursor forms of IL1B and CASP1 were examined. ACTB represents the loading control (L). One-way ANOVA with Tukey’s multiple comparison test (E, G, and K), two-tailed Student’s t test (F), or two-way ANOVA with Sidak’s multiple comparison test (J) was used to determine statistical significance. SC, solvent control; LPS, lipopolysaccharide; tSNE, t-distributed stochastic neighbor embedding; n.s., not significant; a.u., arbitrary unit; ATP, adenosine triphosphate; NG, nigericin; SN, supernatant; WCL, whole-cell lysate. The data are presented as the means ± SD from at least three independent experiments (EG, J, and K). *p < 0.05, **p < 0.01, and ***p < 0.001
Fig. 3
Fig. 3
UBXN6 is required for the induction of autophagy in murine BMDMs. A, B Representative immunostaining images (A) and quantification (B) of LC3 puncta with anti-LC3 antibodies (green) for LC3 and DAPI (blue) for nucleic acid detection. BMDMs were starved with HBSS for 12 h, stimulated with LPS (100 ng/mL) for 18 h, or treated with or without AICAR (0.5 mM) for 24 h. C TEM images of BMDMs stimulated with or without LPS (100 ng/mL) for 18 h. The red arrows indicate autophagosomes. D The number of autophagosomes per cell quantified in the samples from (C). E LC3 conversion rates in BMDMs determined by Western blotting. The cells were treated with or without LPS (100 ng/mL) for 18 h in the presence or absence of Baf-A1 (100 nM). F Relative LC3-II levels normalized against ACTB in (E). G, H Immunofluorescence images (G) and quantification (H) of LC3 puncta formation in BMDMs via confocal microscopy. The macrophages were pretreated with or without DBeQ (0.1, 1, or 3 μM) for 1 h, followed by stimulation with or without LPS (100 ng/mL) for 18 h. Statistical significance was determined via two-tailed Student’s t test (B and F) or one-way ANOVA with Tukey’s multiple comparison test (D and H). SC, solvent control; LPS, lipopolysaccharide; AICAR, 5-aminoimidazole-4-carboxamide ribonucleoside; n.s., not significant; Baf-A1, bafilomycin A1. The data are presented as the means ± SD from at least three independent experiments (B, D, F, and H). *p < 0.05, **p < 0.01, and ***p < 0.001
Fig. 4
Fig. 4
Myeloid UBXN6 is essential for enhancing ERAD and inhibiting inflammation induced by damaged mitochondria in LPS-primed macrophages. A, B Expression levels of Sel1l, Edem1, Syvn1, Dnajc10, and Herpud1 mRNAs in BMDMs measured by qRT‒PCR after treatment with LPS (100 ng/mL) (A) or SMER28 (20 μM) (B) for the indicated times. C Representative immunoblots showing the time course of SEL1L and SYVN1 protein induction in BMDMs. ACTB represents the loading control. D Relative quantitative analysis of SEL1 or SYVN1 levels normalized to ACTB in (C). E, F Representative images (E) and quantification (F) of mtROS levels in BMDMs stained with MitoSOX (1 μM) for 20 min after stimulation with LPS (100 ng/mL) for the indicated times. G The expression levels of Tnf and Il1b mRNAs in BMDMs after 1 h of pretreatment with or without MitoTEMPO (1 or 10 μM). The BMDMs were then stimulated with or without LPS (100 ng/mL) for 6 h. Statistical significance was determined via one-way ANOVA with Tukey’s multiple comparison test (A, B, F, and G) or two-tailed Student’s t test (D). SC, solvent control; LPS, lipopolysaccharide; n.s., not significant; a.u., arbitrary unit; MT, MitoTEMPO. The data represent the means ± SD (A, B, D, F, and G) from at least three independent experiments. *p < 0.05, **p < 0.01, and ***p < 0.001
Fig. 5
Fig. 5
Compared with WT macrophages, UBXN6-deficient macrophages presented elevated levels of essential amino acids and increased aerobic glycolysis. AC Lactate/pyruvate ratio (A), ECAR data (B), and AUC of the ECAR (C) evaluated in BMDMs stimulated with or without LPS (100 ng/mL) for 18 h. D Relative mRNA expression levels of Hif1a and Ldha in BMDMs after treatment with LPS (100 ng/mL) for the indicated times via qRT‒PCR. E, F Concentrations of essential amino acids (E and F), including BCAAs (F). Untargeted metabolomics analysis was conducted on the samples shown in (A). G Schematic pathways of BCAAs in cellular metabolism. H Intracellular levels of BCAAs were measured in BMDMs stimulated with LPS (100 ng/mL) for the indicated times. Statistical significance was determined via two-tailed Student’s t test (A, C, E, and F), one-way ANOVA with Tukey’s multiple comparison test (D), or two-way ANOVA with Sidak’s multiple comparison test (H). LPS, lipopolysaccharide; ECAR, extracellular acidification rate; a.u., arbitrary unit; SC, solvent control; AUC, area under curve; BCAAs, branched chain amino acids; LAT, L-type amino acid transporter; BCAT, branched-chain amino acid transaminase; n.s., not significant. The data are presented as the means ± SD from at least three independent experiments (A, CF, and H). *p < 0.05, **p < 0.01, and ***p < 0.001
Fig. 6
Fig. 6
UBXN6 promotes TFEB nuclear translocation-mediated lysosomal activation in macrophages during LPS stimulation. AD Phosphorylated and total protein levels associated with the AMPK and mTOR signaling pathways in BMDMs stimulated with LPS (100 ng/mL) for the indicated times; ACTB was used as a loading control (A). Relative quantifications are shown for phospho-AMPK normalized to total AMPK (B), phospho-mTOR normalized to total mTOR (C), and phospho-S6K1 normalized to total S6K1 (D). E, F Confocal microscopy images of immunostained TFEB (green) and DAPI (blue, for nuclei) (E) and the percentage of TFEB nuclear translocation (F) obtained from BMDMs treated with LPS (100 ng/mL) for the indicated times. The white arrows indicate TFEB in the nucleus. G Representative images of BMDMs immunostained with LAMP1 (orange) and DAPI (blue, for nuclei) after stimulation with LPS (100 ng/mL) for 2 h. H Mean fluorescence intensities of LAMP1 in BMDMs stimulated with LPS (100 ng/mL) for the indicated periods determined by FIJI software. I, J Western blot analysis of LAMP1 proteins (I) and their relative levels normalized to those of ACTB (J) in BMDMs primed with LPS (100 ng/mL) for the indicated periods. Two-tailed Student’s t tests (BD, F, H, and J) were used to determine statistical significance. LPS, lipopolysaccharide; n.s., not significant; MFI, mean fluorescence intensity. The data represent the means ± SD (B–D, F, H, and J) from at least three independent experiments. *p < 0.05, **p < 0.01, and ***p < 0.001
Fig. 7
Fig. 7
UBXN6 attenuates sepsis-induced mortality and systemic inflammation in vivo. A, B Survival of Ubxn6 cWT and cKO mice assessed for 120 h after the administration of LPS (14 mg/kg, n = 6) (A) or LPS (20 mg/kg, n = 6) (B). CF Hematoxylin and eosin-stained sections of lungs (C) and spleen tissues (D), with relative quantification of inflamed areas in the lungs (E) and the red-to-white pulp ratio in the spleens (F) of mice challenged with LPS (14 mg/kg) for 24 h. G, H Relative mRNA levels of Tnf, Il1b, Ccl3, and Ccl4 in the lungs (G) and spleens (H) of mice injected with LPS (14 mg/kg) for 6 h. IL Representative confocal microscopy images of Ly6G (I)- and IL6 (K)-stained cells, with positive areas per field quantified for Ly6G (J) and IL6 (L), respectively. Paraffin sections of lung tissues from the mice used in (C) were immunostained with Ly6G (yellow), IL6 (purple), and DAPI (blue for nuclei). M, N TEM images (M) and quantification of damaged mitochondria (N) from alveolar macrophages in ALI model mouse lung tissues. The mice were treated with or without LPS (10 mg/kg) for 24 h before their lungs were analyzed via TEM. The yellow or blue arrows indicate swollen or intact mitochondria, respectively. Statistical significance was determined via either the log-rank (Mantel‒Cox) test (A, B) or two-tailed Student’s t test (EH, J, L, and N). PALS, periarteriolar lymphoid sheaths; LF, lymphoid follicle; MZ, marginal zone; WP, white pulp; RP, red pulp; a.u., arbitrary unit; N, nuclei; n.s., not significant. The data represent the means ± SEM from 3‒6 biological replicates (EN). *p < 0.05 and ***p < 0.001

References

    1. Paludan SR, Pradeu T, Masters SL, Mogensen TH. Constitutive immune mechanisms: mediators of host defense and immune regulation. Nat Rev Immunol. 2021;21:137–50. - PMC - PubMed
    1. Meidaninikjeh S, Sabouni N, Marzouni HZ, Bengar S, Khalili A, Jafari R. Monocytes and macrophages in COVID-19: Friends and foes. Life Sci. 2021;269:119010. - PMC - PubMed
    1. Murray PJ, Wynn TA. Protective and pathogenic functions of macrophage subsets. Nat Rev Immunol. 2011;11:723–37. - PMC - PubMed
    1. Dikic I. Proteasomal and autophagic degradation systems. Annu Rev Biochem. 2017;86:193–224. - PubMed
    1. Liu K, Zhao E, Ilyas G, Lalazar G, Lin Y, Haseeb M, et al. Impaired macrophage autophagy increases the immune response in obese mice by promoting proinflammatory macrophage polarization. Autophagy. 2015;11:271–84. - PMC - PubMed