. 2024 Oct 22;22(1):648.
doi: 10.1186/s12951-024-02923-5.

Exosomal miR-1a-3p derived from glucocorticoid-stimulated M1 macrophages promotes the adipogenic differentiation of BMSCs in glucocorticoid-associated osteonecrosis of the femoral head by targeting Cebpz

Affiliations

Exosomal miR-1a-3p derived from glucocorticoid-stimulated M1 macrophages promotes the adipogenic differentiation of BMSCs in glucocorticoid-associated osteonecrosis of the femoral head by targeting Cebpz

Ping Duan et al. J Nanobiotechnology. .

Erratum in

Abstract

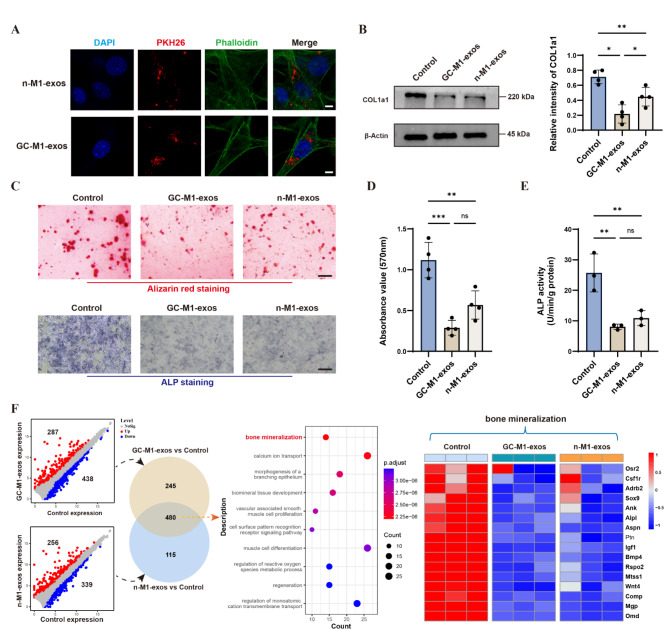
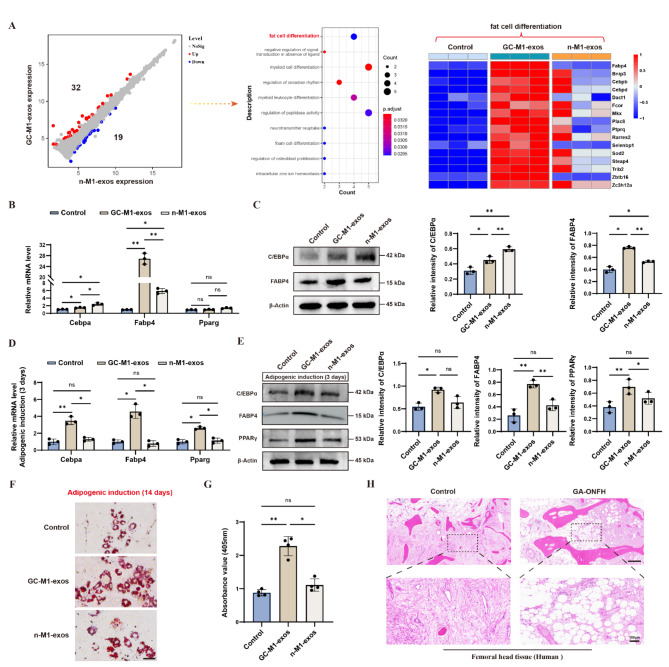
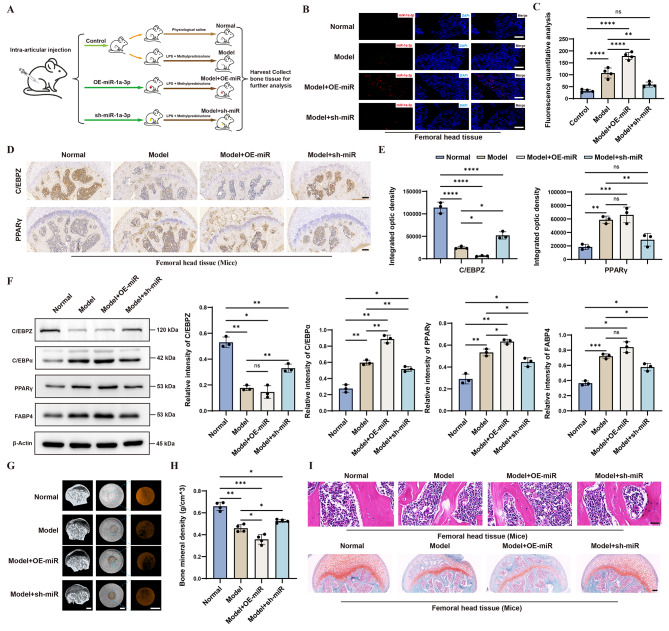
Background: By interacting with bone marrow mesenchymal stem cells (BMSCs) and regulating their function through exosomes, bone macrophages play crucial roles in various bone-related diseases. Research has highlighted a notable increase in the number of M1 macrophages in glucocorticoid-associated osteonecrosis of the femoral head (GA-ONFH). Nevertheless, the intricate crosstalk between M1 macrophages and BMSCs in the glucocorticoid-stimulated environment has not been fully elucidated, and the underlying regulatory mechanisms involved in the occurrence of GA-ONFH remain unclear.

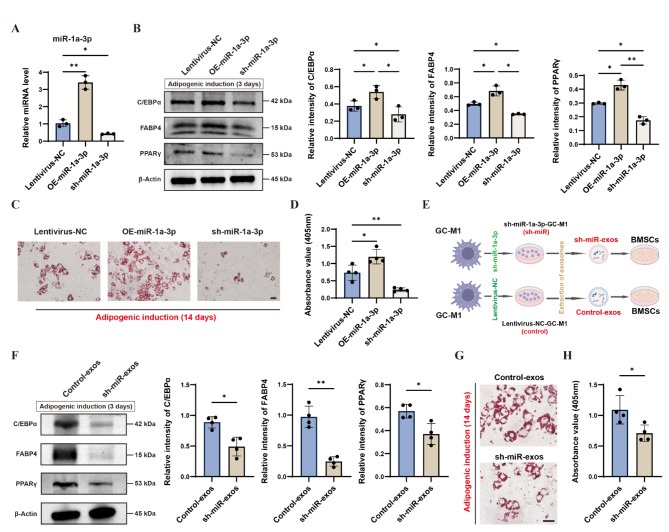
Methods: We employed in vivo mouse models and clinical samples from GA-ONFH patients to investigate the interactions between M1 macrophages and BMSCs. Immunofluorescence staining was used to assess the colocalization of M1 macrophages and BMSCs. Flow cytometry and transcriptomic analysis were performed to evaluate the impact of exosomes derived from normal (n-M1) and glucocorticoid-stimulated M1 macrophages (GC-M1) on BMSC differentiation. Additionally, miR-1a-3p expression was altered in vitro and in vivo to assess its role in regulating adipogenic differentiation.

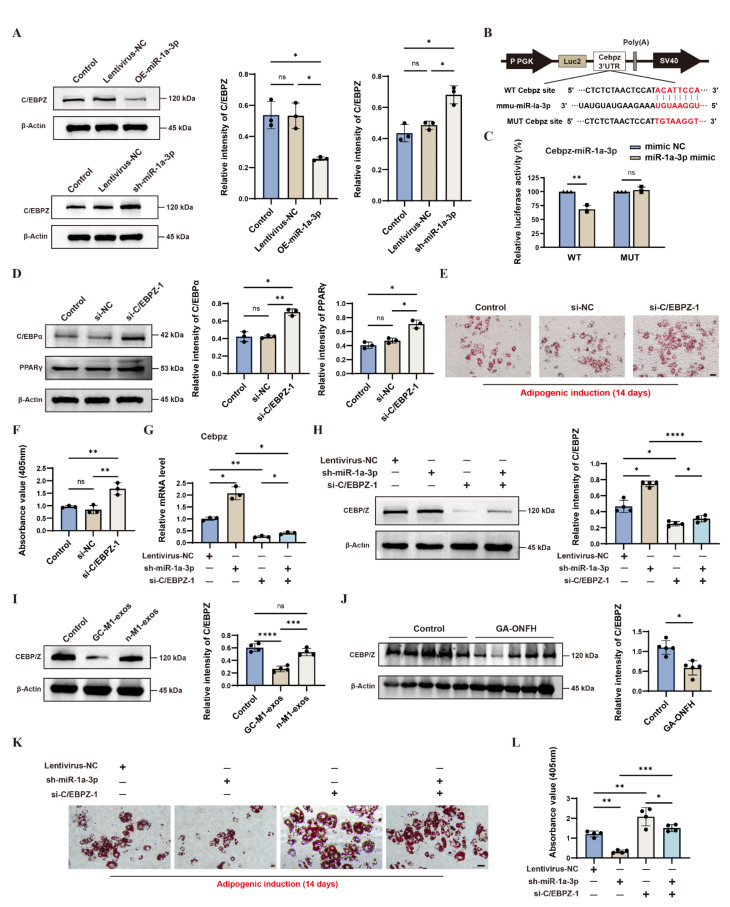
Results: In vivo, the colocalization of M1 macrophages and BMSCs was observed, and an increase in M1 macrophage numbers and a decrease in bone repair capabilities were further confirmed in both GA-ONFH patients and mouse models. Both n-M1 and GC-M1 were identified as contributors to the inhibition of osteogenic differentiation in BMSCs to a certain extent via exosome secretion. More importantly, exosomes derived from GC-M1 macrophages exhibited a heightened capacity to regulate the adipogenic differentiation of BMSCs, which was mediated by miR-1a-3p. In vivo and in vitro, miR-1a-3p promoted the adipogenic differentiation of BMSCs by targeting Cebpz and played an important role in the onset and progression of GA-ONFH.

Conclusion: We demonstrated that exosomes derived from GC-M1 macrophages disrupt the balance between osteogenic and adipogenic differentiation in BMSCs, contributing to the pathogenesis of GA-ONFH. Inhibiting miR-1a-3p expression, both in vitro and in vivo, significantly mitigates the preferential adipogenic differentiation of BMSCs, thus slowing the progression of GA-ONFH. These findings provide new insights into the regulatory mechanisms underlying GA-ONFH and highlight potential therapeutic targets for intervention.

Keywords: Adipogenic differentiation; Exosomes; GA-ONFH; miR-1a-3p.


Conflict of interest statement

The authors declare no competing interests.

Figures

Fig. 1
Fig. 1
Bone loss and a significant increase in the number of M1 macrophages in the GA-ONFH group. (A) Gross view of femoral head samples from the control group and GA-ONFH group (longitudinal section); control group, n = 5; GA-ONFH group, n = 5. (B, C) Representative images of Masson staining (n = 5 per group). Scale bar: 400 μm. Representative images of IHC staining for CD86 in the femoral head and statistical analysis (n = 5 per group). The red arrows indicate M1 macrophages. Scale bar: 100 μm. (D) Coronal (COR), transverse (TRA) and sagittal (SAG) sections of the femoral head were reconstructed from the micro-CT images (n = 4 per group). Scale bar: 0.5 mm. (E, F) Representative images of IHC staining for COL1 and RUNX2 in the femoral head and statistical analysis (n = 3 per group). Scale bar: 50 μm. (G, H) Representative images of IF staining showing CD86 (red)/DAPI (blue) in the mouse femoral head and statistical analysis (n = 3 per group). Scale bar: 300 μm. (I) Representative images of multiple IF staining showing DAPI (blue)/CD86 (purple)/CD29 (red)/CD44 (green) in the mouse femoral head (n = 3 independent experiments). Scale bar: 300 μm. The data are presented as the means ± SD. ***P < 0.001, **P < 0.01. Two-tailed Student t-test
Fig. 2
Fig. 2
M1 macrophages inhibit the osteogenic differentiation of BMSCs. (A) The M1 macrophage surface markers CD86 and CD11b were analysed via flow cytometry (n = 3 independent experiments). (B) Diagram of M1 macrophage and BMSC coculture in vitro. (C) The mRNA levels of osteogenesis-related genes in BMSCs were determined via RT‒qPCR analyses (n = 3 independent experiments). (D) Assessment of COL1a1 (n = 3 independent experiments), RUNX2 (n = 4 independent experiments) and BMP2 (n = 4 independent experiments) expression in BMSCs from different treatment groups by Western blotting, with β-actin used for normalization and quantitative analysis by ImageJ. (E) Mineralization in treated BMSCs was evaluated by alizarin red staining and ALP staining (n = 3 independent experiments). Scale bar: 100 μm. (F) Statistical data of Alizarin red staining. (G) Statistical data of the ALP activity assay (n = 3 independent experiments). The data are presented as the means ± SD. **P < 0.01, *P < 0.05, ns = not significant. One-way ANOVA followed by Holm-Sidak multiple comparison test
Fig. 3
Fig. 3
M1 macrophage-derived exosomes inhibit the osteogenic differentiation of BMSCs. (A) Representative images of BMSCs cultured with n-M1-exos or GC-M1-exos for 12 h (n = 3 independent experiments). DAPI (blue) indicates the nucleus, PKH26 (red) indicates the exosomes, and phalloidin (green) indicates the cytoskeleton. Scale bar: 4 μm. (B) The expression of COL1a1 in BMSCs from different treatment groups was evaluated by Western blotting and quantified using ImageJ (n = 4 independent experiments). (C) Mineralization in treated BMSCs was evaluated by alizarin red staining and ALP staining (n = 4 independent experiments). Scale bar: 100 μm. (D) The statistical data of Alizarin red staining. (E) The statistical data of ALP activity assay (n = 3 independent experiments). (F) Transcriptome sequencing analysis of BMSCs from the different treatment groups: volcano maps and heatmaps showing differences in gene expression between the GC-M1-exos group and the n-M1-exos group compared with the control group. The data are presented as the mean ± SD. ***P < 0.001, **P < 0.01, *P < 0.05, ns = not significant. One-way ANOVA followed by Holm-Sidak multiple comparison test
Fig. 4
Fig. 4
GC-M1-exos promoted the adipogenic differentiation of BMSCs more effectively than did n-M1-exos. (A) Transcriptome sequencing analysis of BMSCs from the GC-M1-exos and n-M1-exos groups: volcano maps and heatmaps showing differences in gene expression. GO analysis revealed that the differentially expressed genes were enriched in the fat cell differentiation signaling pathway (Definition: The process in which a relatively unspecialized cell acquires specialized features of an adipocyte, an animal connective tissue cell specialized for the synthesis and storage of fat). (B, C) The mRNA and protein expression levels of adipogenic differentiation-related genes in BMSCs cultured in normal medium (n = 3 independent experiments). (D, E) After culture for 3 days in adipogenic differentiation medium, the mRNA and protein expression levels of adipogenic differentiation-related genes in BMSCs were measured (n = 3 independent experiments). (F, G) Representative images of oil red O staining and statistical analysis of absorbance values at 405 nm (n = 4 independent experiments). Scale bar: 100 μm. (H) Representative images of H&E-stained femoral heads (n = 5 per group). Scale bar: 500 μm. The data are presented as the mean ± SD. **P < 0.01, *P < 0.05, ns = not significant. One-way ANOVA followed by Holm-Sidak multiple comparison test
Fig. 5
Fig. 5
Identification and analysis of differentially expressed miRNAs. (A) Heatmap displaying differentially expressed miRNAs. (B) GO enrichment analysis of downstream target genes of miRNAs was performed. (C) Bioinformatics analysis: Downstream target genes that may be affected by miRNAs were identified in the miRDB database and subsequently intersected with genes in the GO database that are involved in the regulation of fat cell differentiation signalling pathways (GO:0045598); the number of genes corresponding to each miRNA was determined. (D) The schematic shows 16 genes that regulate fat cell differentiation and may be affected by miR-1a-3p. (E) The expression of miR-1a-3p was measured by RT‒qPCR (n = 3 independent experiments). (F) The expression of miR-1a-3p in bone marrow blood samples from the control and GA-ONFH patients was measured by RT‒qPCR (n = 5 per group). (G, H) Representative FISH images of miR-1a-3p in the mouse femoral head (n = 4 per group). Scale bar: 50 μm; Fluorescence was quantified via ImageJ. The data are presented as the mean ± SD. **P < 0.01, *P < 0.05. Two-tailed Student t-test
Fig. 6
Fig. 6
miR-1a-3p promotes the adipogenic differentiation of BMSCs in vitro. (A) The expression level of miR-1a-3p was measured by RT‒qPCR (n = 3 independent experiments). (B) The protein expression levels of C/EBPα, FABP4, and PPARγ in the different treatment groups were measured via Western blotting (n = 3 independent experiments). (C, D) Representative images of oil red O staining and statistical analysis of absorbance values at 405 nm (n = 4 independent experiments). Scale bar: 50 μm. (E) Process diagram: GC-M1 macrophages were infected with control or sh-miR-1a-3p lentivirus, and exosomes were extracted via high-speed centrifugation and added to BMSC culture medium. (F) The protein expression levels of C/EBPα, FABP4, and PPARγ in the different treatment groups were measured via Western blotting (n = 4 independent experiments). (G, H) Representative images of oil red O staining and statistical analysis of absorbance values at 405 nm (n = 4 independent experiments). Scale bar: 100 μm. The data are presented as the mean ± SD. **P < 0.01, *P < 0.05. (A), (B) and (D) One-way ANOVA followed by Holm-Sidak multiple comparison test. (F, H) Two-tailed Student t test
Fig. 7
Fig. 7
miR-1a-3p promotes the adipogenic differentiation of BMSCs by negatively regulating Cebpz expression. (A) The protein expression levels of C/EBPZ in the different treatment groups were measured via Western blotting (n = 3 independent experiments). (B, C) Schematic diagram and results of dual-luciferase reporter assays showing the interaction between miR-1a-3p and Cebpz (n = 3 independent experiments). (D) The protein expression levels of C/EBPα and PPARγ were measured by Western blotting (n = 3 independent experiments). (E, F) Representative images of oil red O staining and statistical analysis of absorbance values at 405 nm (n = 3 independent experiments). Scale bar: 50 μm. (G, H) The mRNA and protein expression levels of C/EBPZ in each group were measured by RT‒qPCR (n = 3 independent experiments) and Western blotting (n = 4 independent experiments), respectively. (I) The protein expression levels of C/EBPZ in the different treatment groups were measured via Western blotting, and statistical analysis was performed using ImageJ (n = 4 independent experiments). (J) The protein expression levels of C/EBPZ in the Control group and GA-ONFH group were measured by Western blotting, and statistical analysis was performed via ImageJ (n = 5 per group). (K, L) Representative images of oil red O staining in each group and statistical analysis of absorbance values at 405 nm (n = 4 independent experiments). Scale bar: 50 μm. The data are presented as the mean ± SD. ****P < 0.001, ***P < 0.001, **P < 0.01, *P < 0.05, ns = not significant. (A, D, FI) and (L) One-way ANOVA followed by Holm-Sidak multiple comparison test. (J) Two-tailed Student t test. (C) Two-way ANOVA followed by Holm-Sidak multiple comparison test
Fig. 8
Fig. 8
miR-1a-3p affects the progression of GA-ONFH in vivo. (A) Schematic diagram of the establishment of four differently treated animal models. (B, C) Representative FISH images of miR-1a-3p in the mouse femoral head and fluorescence was quantified via ImageJ (n = 4 per group). Scale bar: 50 μm. (D, E) Representative images of IHC staining for PPARγ and C/EBPZ in the femoral head and statistical analysis of the integrated optic density (n = 3 per group). Scale bar: 100 μm. (F) The protein expression levels of C/EBPα, PPARγ, FABP4 and C/EBPZ in the different treatment groups were measured via Western blotting, and the relative intensity of each parameter was statistically analysed via ImageJ (n = 3 independent experiments). (G) Three-dimensional reconstruction images of the femoral head (longitudinal section). Scale bar: 3 mm. Circular regions of interest in the image were used to visually assess the internal bone structure of the femoral head. Scale bar: 1.5 mm. n = 4 per group. (H) Bone mineral density analysis of femoral heads from each group (n = 4 per group). (I) Representative images of H&E-stained femoral heads from each group (n = 4 per group). Scale bar: 50 μm; Representative images of Safranin O/Fast Green staining from each group (n = 4 per group). Scale bar: 100 μm. The data are presented as the mean ± SD. ****P < 0.001, ***P < 0.001, **P < 0.01, *P < 0.05, ns = not significant. One-way ANOVA followed by Holm-Sidak multiple comparison test

References

    1. Chang C, Greenspan A, Gershwin ME. The pathogenesis, diagnosis and clinical manifestations of steroid-induced osteonecrosis. J Autoimmun. 2020;110:102460. - PubMed
    1. Xie XH, Wang XL, Yang HL, Zhao DW, Qin L. Steroid-associated osteonecrosis: Epidemiology, pathophysiology, animal model, prevention, and potential treatments (an overview). J Orthop Translat. 2015;3:58–70. - PMC - PubMed
    1. Wang A, Ren M, Wang J. The pathogenesis of steroid-induced osteonecrosis of the femoral head: a systematic review of the literature. Gene. 2018;671:103–9. - PubMed
    1. Mont MA, Cherian JJ, Sierra RJ, Jones LC, Lieberman JR. Nontraumatic osteonecrosis of the femoral head: where do we stand today? A ten-year update. J Bone Joint Surg Am. 2015;97:1604–27. - PubMed
    1. Houdek MT, Wyles CC, Packard BD, Terzic A, Behfar A, Sierra RJ. Decreased osteogenic activity of mesenchymal stem cells in patients with corticosteroid-Induced osteonecrosis of the femoral head. J Arthroplasty. 2016;31:893–8. - PubMed

MeSH terms

LinkOut - more resources