

Significant individual variation in cardiac-cycle-linked cerebrospinal fluid production following subarachnoid hemorrhage
- PMID: 39438961
- PMCID: PMC11495023
- DOI: 10.1186/s12987-024-00587-9
Significant individual variation in cardiac-cycle-linked cerebrospinal fluid production following subarachnoid hemorrhage
Abstract
Background: Spontaneous subarachnoid hemorrhage (SAH) often results in altered cerebrospinal fluid (CSF) flow and secondary hydrocephalus, yet the mechanisms behind these phenomena remain poorly understood. This study aimed to elucidate the impact of SAH on individual CSF flow patterns and their association with secondary hydrocephalus.
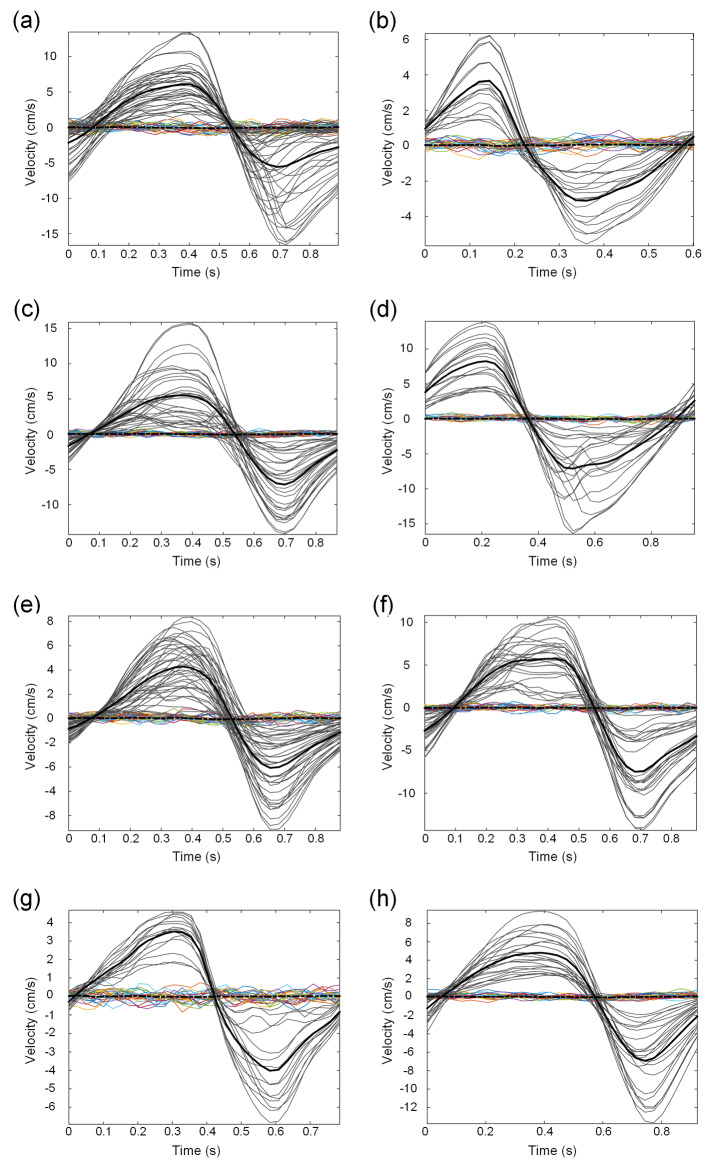
Methods: In patients who had experienced SAH, changes in CSF flow were assessed using cardiac-gated phase-contrast magnetic resonance imaging (PC-MRI) at the Sylvian aqueduct and cranio-cervical junction (CCJ). Within these regions of interest, volumetric CSF flow was determined for every pixel and net CSF flow volume and direction calculated. The presence of acute or chronic hydrocephalus was deemed from ventriculomegaly and need of CSF diversion. For comparison, we included healthy subjects and patients examined for different CSF diseases.
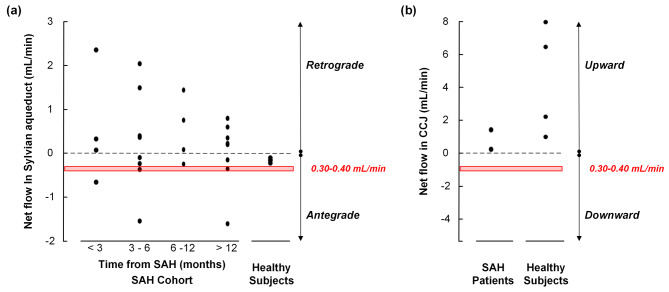
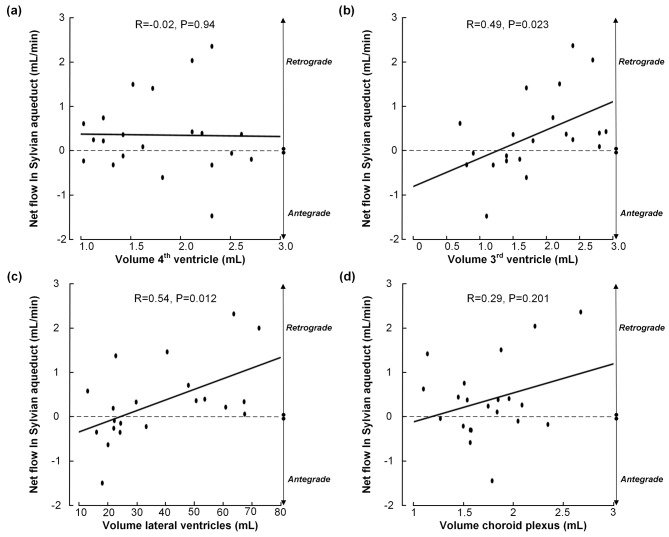
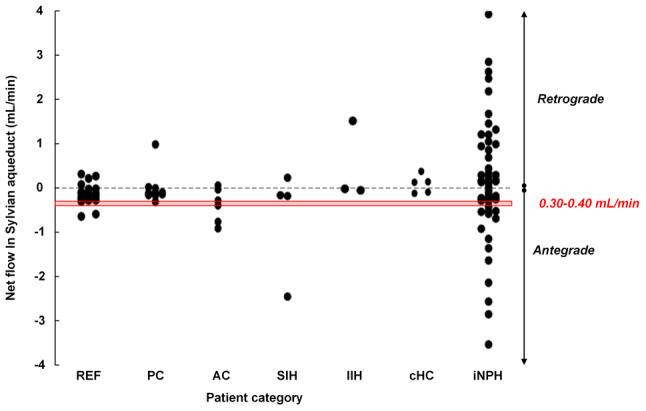
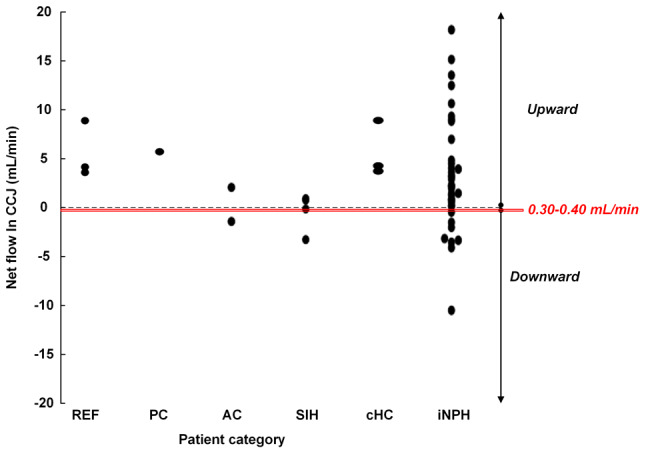
Results: Twenty-four SAH patients were enrolled, revealing a heterogeneous array of CSF flow alterations at the Sylvian aqueduct. The cardiac-cycle-linked CSF net flow in Sylvian aqueduct differed from the traditional figures of ventricular CSF production about 0.30-0.40 mL/min. In 15 out of 24 patients (62.5%), net CSF flow was retrograde from the fourth to the third and lateral ventricles, while it was upward at the cranio-cervical junction in 2 out of 2 patients (100%). The diverse CSF flow metrics did not distinguish between individuals with acute or chronic secondary hydrocephalus. In comparison, 4/4 healthy subjects showed antegrade net CSF flow in the Sylvian aqueduct and net upward CSF flow in CCJ. These net CSF flow measures also showed interindividual variability among other patients with CSF diseases.
Conclusions: There is considerable inter-individual variation in net CSF flow rates following SAH. Net CSF flow in the Sylvian aqueduct differs markedly from the traditional ventricular CSF production rates of 0.30-0.40 mL/min in SAH patients, but less so in healthy subjects. Furthermore, the cardiac-cycle-linked net CSF flow rates in Sylvian aqueduct and CCJ suggest an important role of extra-ventricular CSF production.
Keywords: Cerebrospinal fluid flow; Cerebrospinal fluid production; Cranio-cervical junction; Subarachnoid hemorrhage; Sylvian aqueduct.
© 2024. The Author(s).
Conflict of interest statement
The authors declare no competing interests.
Figures

Similar articles
-
Cerebrospinal fluid volumetric net flow rate and direction in idiopathic normal pressure hydrocephalus.Neuroimage Clin. 2018;20:731-741. doi: 10.1016/j.nicl.2018.09.006. Epub 2018 Sep 14. Neuroimage Clin. 2018. PMID: 30238917 Free PMC article.
-
Magnitude and direction of aqueductal cerebrospinal fluid flow: large variations in patients with intracranial aneurysms with or without a previous subarachnoid hemorrhage.Acta Neurochir (Wien). 2019 Feb;161(2):247-256. doi: 10.1007/s00701-018-3730-6. Epub 2018 Nov 15. Acta Neurochir (Wien). 2019. PMID: 30443816
-
Direction and magnitude of cerebrospinal fluid flow vary substantially across central nervous system diseases.Fluids Barriers CNS. 2021 Apr 1;18(1):16. doi: 10.1186/s12987-021-00251-6. Fluids Barriers CNS. 2021. PMID: 33794929 Free PMC article.
-
Amplitude and phase of cerebrospinal fluid pulsations: experimental studies and review of the literature.J Neurosurg. 2006 May;104(5):810-9. doi: 10.3171/jns.2006.104.5.810. J Neurosurg. 2006. PMID: 16703889 Review.
-
Cerebrospinal Fluid Flow Studies and Recent Advancements.Semin Ultrasound CT MR. 2016 Apr;37(2):92-9. doi: 10.1053/j.sult.2016.01.002. Epub 2016 Jan 7. Semin Ultrasound CT MR. 2016. PMID: 27063659 Review.
Cited by
-
Altered brain fluid dynamics in spontaneous intracranial hypotension.Fluids Barriers CNS. 2025 Jul 1;22(1):65. doi: 10.1186/s12987-025-00679-0. Fluids Barriers CNS. 2025. PMID: 40597337 Free PMC article.
References
-
- Hoh BL, Ko NU, Amin-Hanjani S, Chou S-Y, Cruz-Flores S, Dangayach NS, Derdeyn CP, Du R, Hänggi D, Hetts SW, et al. 2023 Guideline for the management of patients with Aneurysmal Subarachnoid Hemorrhage: a Guideline from the American Heart Association/American Stroke Association. Stroke. 2023;54:e314–70. - PubMed
-
- Zhou J, Guo P, Guo Z, Sun X, Chen Y, Feng H. Fluid metabolic pathways after subarachnoid hemorrhage. J Neurochem. 2022;160:13–33. - PubMed
MeSH terms
LinkOut - more resources
Full Text Sources
Medical
