. 2024 Oct 22;43(1):292.
doi: 10.1186/s13046-024-03180-y.

Combining ERAP1 silencing and entinostat therapy to overcome resistance to cancer immunotherapy in neuroblastoma

Affiliations

Combining ERAP1 silencing and entinostat therapy to overcome resistance to cancer immunotherapy in neuroblastoma

Patrizia Tempora et al. J Exp Clin Cancer Res. .

Abstract

Background: Checkpoint immunotherapy unleashes tumor control by T cells, but it is undermined in non-immunogenic tumors, e.g. with low MHC class I expression and low neoantigen burden, such as neuroblastoma (NB). Endoplasmic reticulum aminopeptidase 1 (ERAP1) is an enzyme that trims peptides before loading on MHC class I molecules. Inhibition of ERAP1 results in the generation of new antigens able of inducing potent anti-tumor immune responses. Here, we identify a novel non-toxic combinatorial strategy based on genetic inhibition of ERAP1 and administration of the HDAC inhibitor (HDACi) entinostat that increase the immunogenicity of NB, making it responsive to PD-1 therapy.

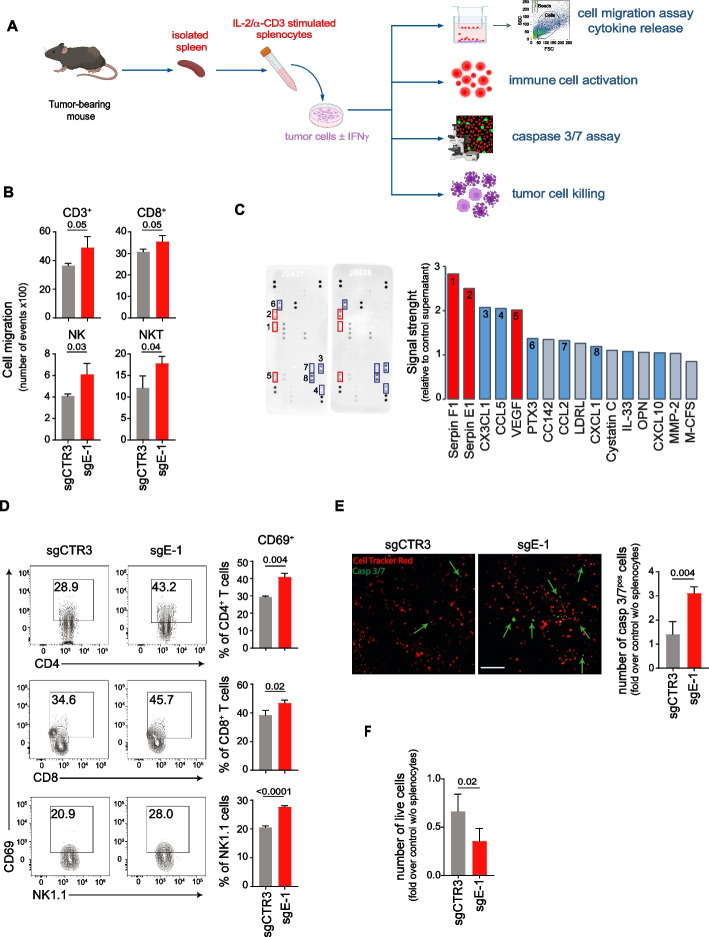
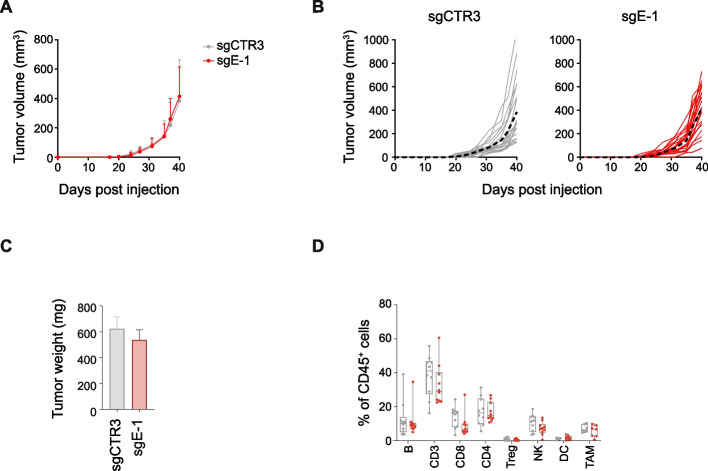
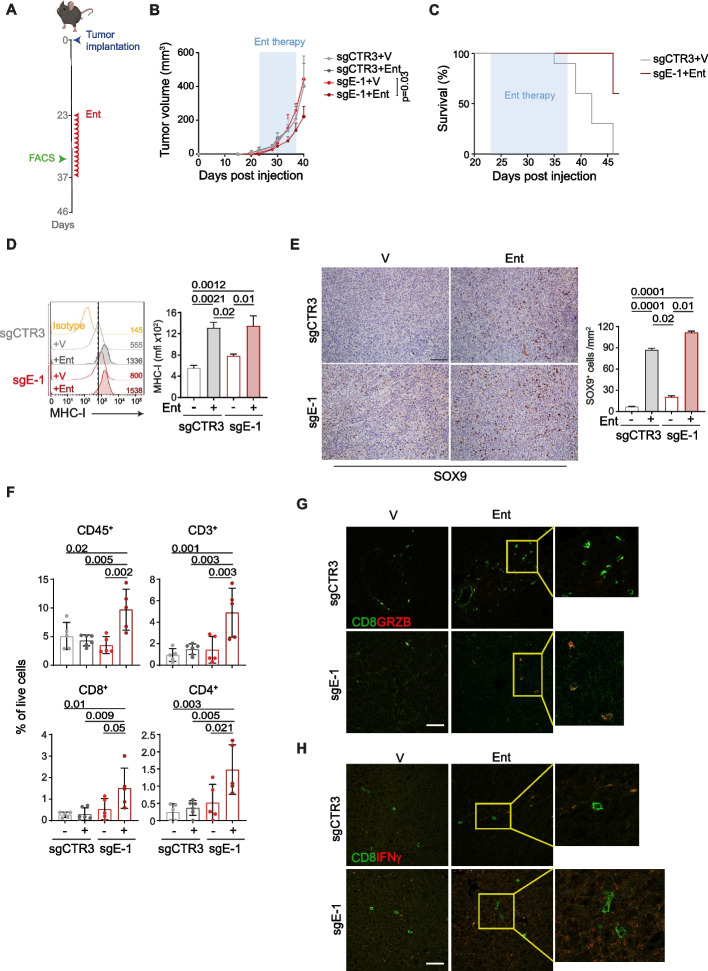
Methods: CRISPR/Cas9-mediated gene editing was used to knockout (KO) the ERAP1 gene in 9464D NB cells derived from spontaneous tumors of TH-MYCN transgenic mice. The expression of MHC class I and PD-L1 was evaluated by flow cytometry (FC). The immunopeptidome of these cells was studied by mass spectrometry. Cocultures of splenocytes derived from 9464D bearing mice and tumor cells allowed the assessment of the effect of ERAP1 inhibition on the secretion of inflammatory cytokines and activation and migration of immune cells towards ERAP1 KO cells by FC. Tumor cell killing was evaluated by Caspase 3/7 assay and flow cytometry analysis. The effect of ERAP1 inhibition on the immune content of tumors was analyzed by FC, immunohistochemistry and multiple immunofluorescence.

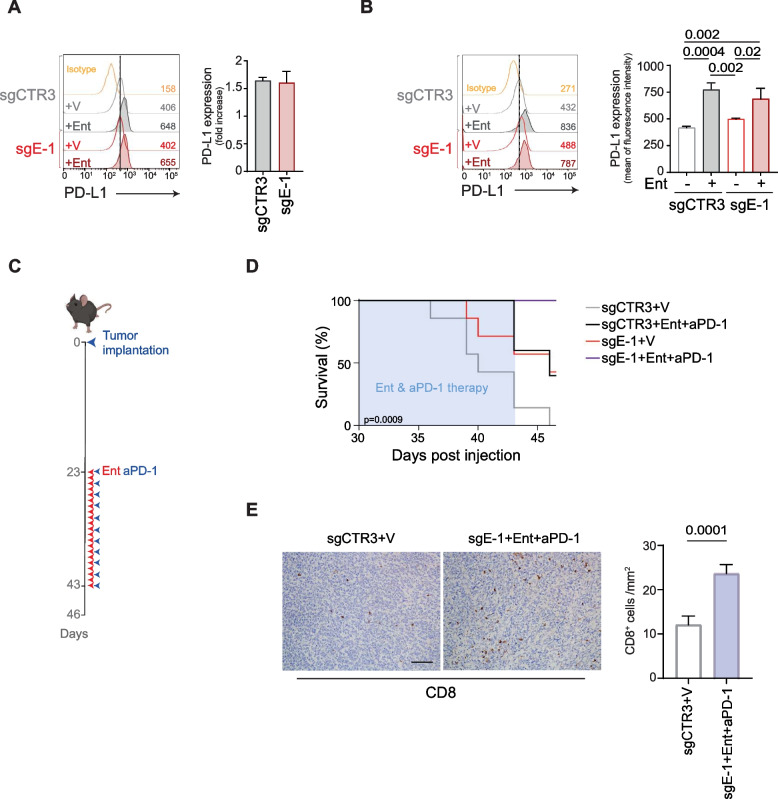
Results: We found that inhibition of ERAP1 makes 9464D cells more susceptible to immune cell-mediated killing by increasing both the recall and activation of CD4+ and CD8+ T cells and NK cells. Treatment with entinostat induces the expression of MHC class I and PD-L1 molecules in 9464D both in vitro and in vivo. This results in pronounced changes in the immunopeptidome induced by ERAP1 inhibition, but also restrains the growth of ERAP1 KO tumors in vivo by remodelling the tumor-infiltrating T-cell compartment. Interestingly, the absence of ERAP1 in combination with entinostat and PD-1 blockade overcomes resistance to PD-1 immunotherapy and increases host survival.

Conclusions: These findings demonstrate that ERAP1 inhibition combined with HDACi entinostat treatment and PD-1 blockade remodels the immune landscape of a non-immunogenic tumor such as NB, making it responsive to checkpoint immunotherapy.

Keywords: Antigen processing; Cancer immunotherapy; Combination therapy; ERAP1; Epigenetic; Immunopeptidome; Neuroblastoma.


Conflict of interest statement

The authors declare that they have no competing interests.

Figures

Fig. 1
Fig. 1
Inhibition of ERAP1 does not affect the surface expression of MHC class I molecules of 9464D cells. A Representative flow-cytometry histograms of MHC class I expression in 200 mm3-size 9464D and 975A2 tumors (n = 3) grown subcutaneously in C57BL/6 mice. B Representative immunoblotting analysis of ERAP1 expression in 9464D and 975A2 NB cell lines. Densitometric analysis of β-actin-normalized ERAP1 expression from three independent experiments is shown below. C Representative immunoblotting analysis of ERAP1 expression in 9464D cells untreated or infected with lentiviruses carrying non-targeting sgRNAs (sgCTR3 and sgCTR4) or sgRNAs targeting exon 1 or exon 5 (sgE-1 and sgE-5) of the ERAP1 gene. Densitometric analysis of β-actin-normalized ERAP1 expression from three independent experiments is shown below. D Representative flow-cytometry histograms of MHC class I expression in the indicated cell lines. Isotype-matched negative control Ab is shown as yellow histogram. Bars represent the increase in mean fluorescence intensity (MFI) of MHC class I expression in IFNγ-stimulated compared to unstimulated cells. E Representative immunoblotting analysis of ERAP1 expression in the indicated cells untreated or treated with IFNγ. Densitometric analysis of β-actin-normalized ERAP1 expression from three independent experiments is shown below. Levels of significance for comparison between samples were determined by ANOVA and two-tailed Student’s t test. Statistically significant P values are shown
Fig. 2
Fig. 2
Inhibition of ERAP1 renders 9464D cells more susceptible to lysis by immune cells. A Experimental scheme. Tumor cells untreated or treated with IFNγ were co-cultured with pre-stimulated syngeneic splenocytes derived from tumor-bearing mice. B Quantification of immune cells migrated through a trans-well to tumor cells. Bars indicate the total number of migrated cells. C Chemokine expression in sgCTR3 and sgE-1 cell lysates by protein array. Relative chemokine expression based on densitometric analysis is shown on the right. D Representative flow-cytometry analyses of CD69 expression by CD4+ T cells, CD8+ T cells and NK cells from splenocytes co-cultured with IFNγ-treated tumor cells for 18 h. Bars represent the % of immune cells expressing the indicated markers. E Representative multi-fluorescence images of IFNγ-treated tumor cells co-cultured 7 h with red-labeled splenocytes in the presence of caspase 3/7 Green Detection Reagent, shown at original magnification × 20, scale bar 75 μm. Caspase 3/7-positive tumor cells are indicated by green arrows. Quantitative analysis of the caspase 3/7-positive tumor cells from at least 8 fields for each of two independent experiments is shown. F Live IFNγ-treated tumor cells after 24 h of co-culture with splenocytes. Data are normalized to the number of live tumor cells without splenocytes. Levels of significance for comparison between samples were determined by two-tailed Student’s t test. Statistically significant P values are shown
Fig. 3
Fig. 3
ERAP1 inhibition does not alter the growth and immune landscape of 9464D tumors. A, B Tumor growth of sgCTR3 and sgE-1 cells injected subcutaneously in C57BL/6 mice. Growth curves of groups (A) and single mice (B) are shown.  In B, the average growth for each group is indicated with a black dotted line. C Weight of explanted tumors at 40 days post injection. D, Flow-cytometry analysis of the immune content in explanted tumors at day 40 post injection (n ≥ 10 for each group). Levels of significance for comparison between samples were determined by two-tailed Student’s t test
Fig. 4
Fig. 4
Inhibition of ERAP1 affects both the surface expression of MHC class I molecules and the immunopeptidome of 9464D cells treated with entinostat. A Representative flow-cytometry histograms of MHC class I expression in the indicated cell lines. Isotype-matched negative control Ab is shown as yellow histogram. Bars represent the increase in MFI of MHC class I expression in entinostat- (Ent) stimulated compared to unstimulated tumor cells. B Venn diagrams showing the number of unique and shared H-2Kb- and H-2Db-bound peptides between sgCTR3 and sgE-1 cells. C and D The number (B) and the percentage (C) of peptides bound to H-2Kb- and H-2Dbof sgCTR3 and sgE-1 cells are plotted according to their amino acid length. E, Logo representation of unique H-2Kb- and H-2Db-bound peptide sequences in sgCTR3 and sgE-1 cells analyzed independently according to their lengths shown on the x-axis. The height of each column is proportional to the degree of amino acid conservation and the height of each letter composing the column is proportional to its frequency at the given position. Numbers between parentheses indicate the number of peptide sequences analyzed. Amino acids are colored as follows: acidic (red), basic (blue), hydrophobic (black), neutral (purple) and polar (green)
Fig. 5
Fig. 5
Inhibition of ERAP1 in combination with entinostat treatment delays the growth of 9464D tumors and reshapes the intratumoral immune infiltrate. A Schematic representation of the entinostat treatment and timing of tumor immune infiltrate analysis. B Tumor growth of sgCTR3 and sgE-1 cells injected subcutaneously in C57BL/6 mice and treated as indicated. Significance at day 17 after the start of treatment. Levels of significance for comparison between samples were determined by ANOVA. Statistically significant P values are shown. C Survival analysis of the indicated experimental groups. Levels of significance for comparison between samples were determined by Log-rank test. Statistically significant P values are shown. D Representative flow-cytometry histograms of MHC class I expression in the explanted tumors at day 10 after the start of treatment (n ≥ 5 for each group). Isotype-matched negative control Ab is shown as yellow histogram. Bars represent the increase in MFI of MHC class I expression in entinostat- (Ent) stimulated compared to unstimulated tumor cells. E Representative examples of SOX9 staining in the explanted tumors at day 10 after the start of treatment (n ≥ 5 for each group). Nuclei were counterstained with hematoxylin (blue). A number of SOX9 positive cells are indicated by brown arrows. Original magnifications, × 20. Scale bars, 30 μm. Quantitative analysis of SOX9 expressing cells from n = 3 biologically independent highly infiltrated NBs is shown on the right. Plotted as mean ± S.D. and analyzed by Kruskal–Wallis test to generate two-tailed P values. F Flow-cytometry analysis of the immune content in the same tumors analysed in E. Levels of significance for comparison between samples were determined by ANOVA and Log-rank test. G Representative multiple immunofluorescence staining of the same tumors analysed in E and F for CD8+ T cells (green) expressing granzyme B (red) or IFNγ (red) shown at magnification 40 × , scale bar 30 μm. Images with nuclei (Hoechst) are shown on the left of each panel. The yellow rectangles are higly magnified on the right-hand panels. V, vehicle control; Ent, entinostat. Statistically significant P values are shown
Fig. 6
Fig. 6
ERAP1 inhibition in combination with entinostat and PD-1 blockade delays the growth of 9464D tumors. A and B Representative flow-cytometry histograms of PD-L1 expression in the indicated cell lines (A) and explanted tumors (B) at day 10 after the start of treatment (n ≥ 5 for each group). Isotype-matched negative control Ab is shown as yellow histogram. Bars represent the increase in MFI of PD-L1 expression in entinostat- (Ent) stimulated compared to vehicle-treated tumor cells. C Schematic representation of the combined entinostat and PD-1 treatment. D Survival analysis of the indicated experimental groups. Levels of significance for comparison between samples were determined by ANOVA, two-tailed Student’s t test and Log-rank test. E Representative examples of CD8 staining in the explanted tumors at day 10 after the start of treatment (n ≥ 7 for each group). Nuclei were counterstained with hematoxylin (blue). Original magnifications, × 20. Scale bars, 30 μm. Quantitative analysis of CD8 expressing cells from n = 3 biologically independent highly infiltrated NBs is shown on the right. Plotted as mean ± S.D. and analyzed by Kruskal–Wallis test to generate two-tailed P values. V, vehicle control; Ent, entinostat; aPD-1, anti-PD-1 Ab. Statistically significant P values are shown

References

    1. Korman AJ, Garrett-Thomson SC, Lonberg N. The foundations of immune checkpoint blockade and the ipilimumab approval decennial. Nat Rev Drug Discov. 2022;21(7):509–28. - PubMed
    1. Capitini CM, Otto M, DeSantes KB, Sondel PM. Immunotherapy in pediatric malignancies: current status and future perspectives. Future Oncol. 2014;10(9):1659–78. - PMC - PubMed
    1. Maris JM, Hogarty MD, Bagatell R, Cohn SL. Neuroblastoma. Lancet. 2007;369(9579):2106–20. - PubMed
    1. London WB, Bagatell R, Weigel BJ, Fox E, Guo D, Van Ryn C, Naranjo A, Park JR. Historical time to disease progression and progression-free survival in patients with recurrent/refractory neuroblastoma treated in the modern era on Children’s Oncology Group early-phase trials. Cancer. 2017;123(24):4914–23. - PMC - PubMed
    1. Matthay KK, Maris JM, Schleiermacher G, Nakagawara A, Mackall CL, Diller L, Weiss WA. Neuroblastoma Nat Rev Dis Primers. 2016;2:16078. - PubMed