. 2024 Oct 22;12(1):167.
doi: 10.1186/s40478-024-01873-1.

A minimally invasive biomarker for sensitive and accurate diagnosis of Parkinson's disease

Affiliations

A minimally invasive biomarker for sensitive and accurate diagnosis of Parkinson's disease

Zerui Wang et al. Acta Neuropathol Commun. .

Abstract

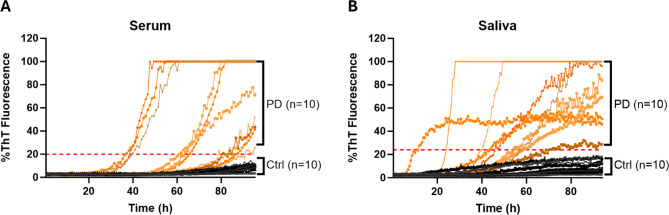
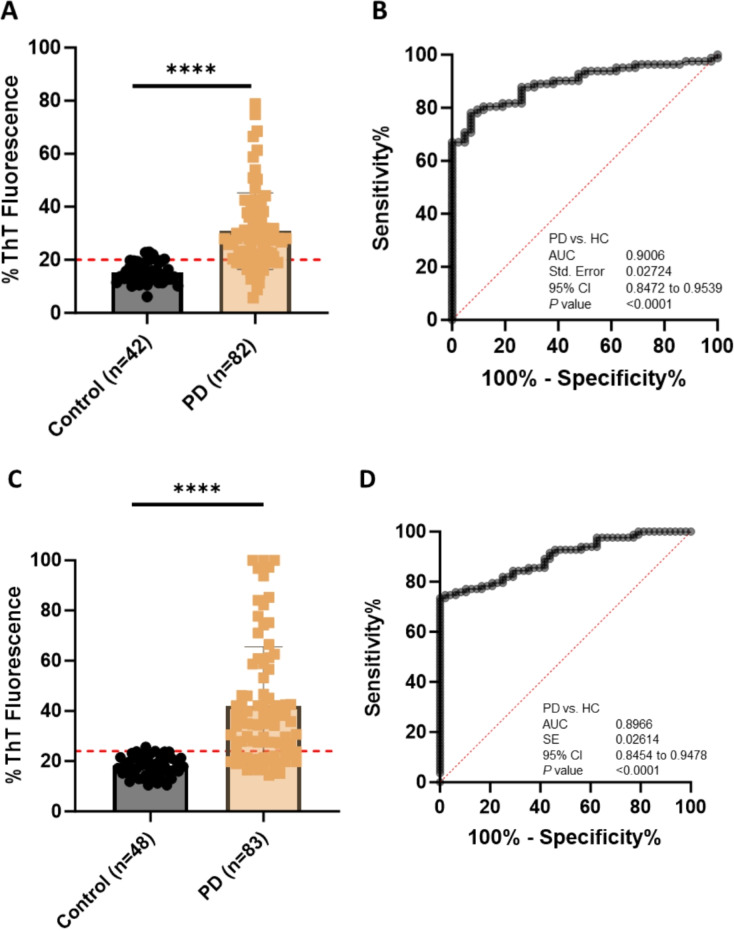
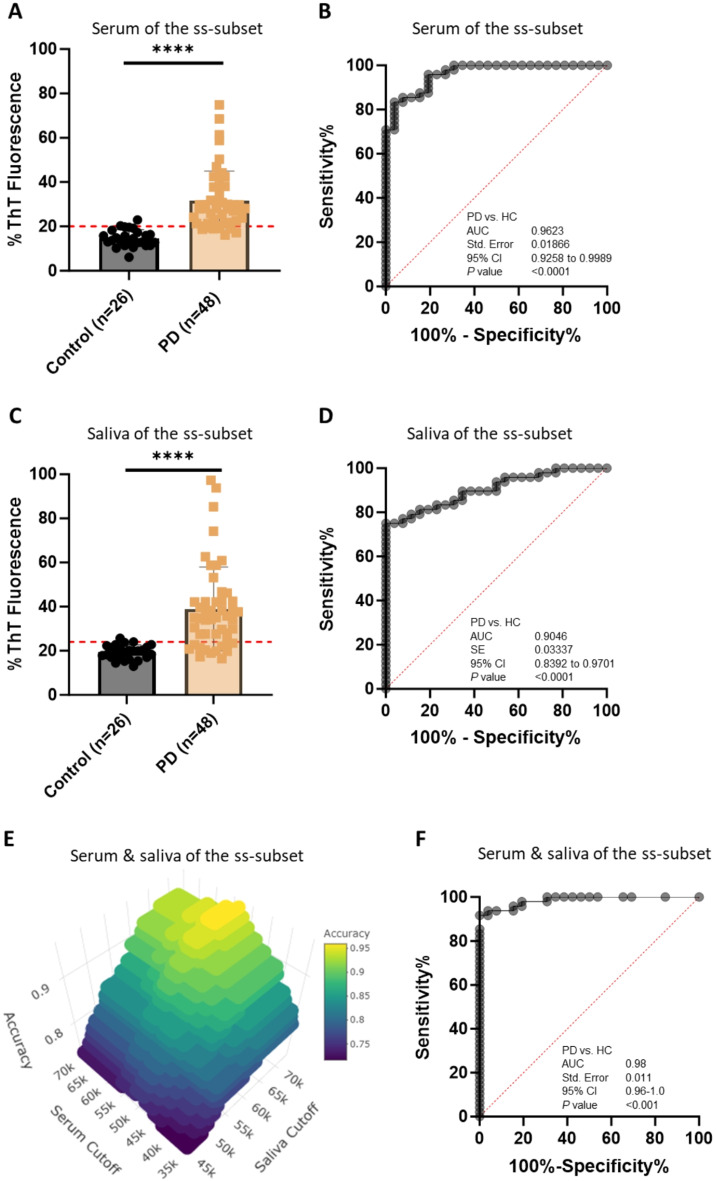
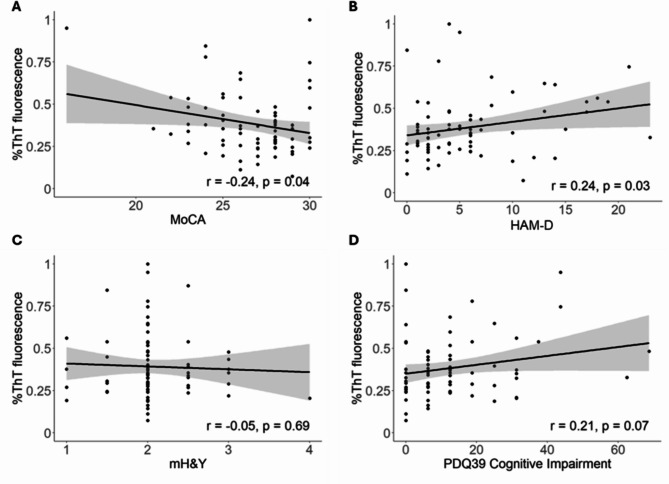
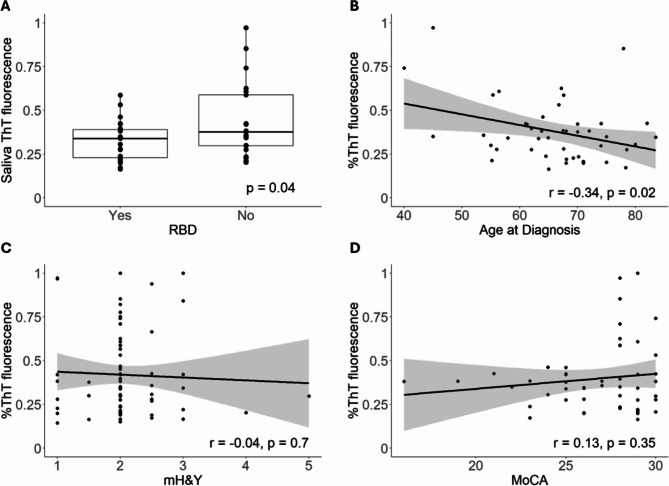
Seeding activities of disease-associated α-synuclein aggregates (αSynD), a hallmark of Parkinson's disease (PD), are detectable by seed amplification assay (αSyn-SAA) and being developed as a diagnostic biomarker for PD. Sensitive and accurate αSyn-SAA for blood or saliva would greatly facilitate PD diagnosis. This prospective diagnostic study conducted αSyn-SAA analyses on serum and saliva samples collected from patients clinically diagnosed with PD or healthy controls (HC). 124 subjects (82 PD, 42 HC) donated blood and had extensive clinical assessments, of whom 74 subjects (48 PD, 26 HC) also donated saliva at the same visits. An additional 57 subjects (35 PD, 22 HC) donated saliva and had more limited clinical assessments. The mean ages were 69.21, 66.55, 69.58, and 64.71 years for PD serum donors, HC serum donors, PD saliva donors, and HC saliva donors, respectively. αSynD seeding activities in either sample type alone or both sample types together were evaluated for PD diagnosis. Serum αSyn-SAA data from 124 subjects showed 80.49% sensitivity, 90.48% specificity, and 0.9006 accuracy (AUC of ROC); saliva αSyn-SAA data from 131 subjects attained 74.70% sensitivity, 97.92% specificity, and 0.8966 accuracy. Remarkably, the combined serum and saliva αSyn-SAA from 74 subjects with both sample types achieved better diagnostic performance: 95.83% sensitivity, 96.15% specificity, and 0.98 accuracy. In addition, serum αSynD seeding activities correlated inversely with Montreal Cognitive Assessment in males and positively with Hamilton Depression Rating Scale in females and in the < 70 age group, whereas saliva αSynD seeding activities correlated inversely with age at diagnosis in males and in the < 70 age group. Our data indicate that serum and saliva αSyn-SAA together can achieve high diagnostic accuracy for PD comparable to that of CSF αSyn-SAA, suggesting their potential utility for highly sensitive, accurate, and minimally invasive diagnosis of PD in routine clinical practice and clinical studies.

Keywords: Alpha-synuclein; Biomarker; Parkinson’s disease; RT-QuIC; Seeding activity.


Conflict of interest statement

Qingzhong Kong, Steven A. Gunzler, Zerui Wang and Shu G. Chen have received grants from the National Institutes of Health. Steven A. Gunzler received grants from the Michael J Fox Foundation (MJFF) and the Parkinson Foundation, and has participated in studies funded by Biogen, Amneal, Bial, and UCB. Zerui Wang received funding from MJFF. Shu G. Chen received funding from MJFF and CurePSP. No other disclosures were reported.

Figures

Fig. 1
Fig. 1
Representative ThT Fluorescence Curves of αSyn RT-QuIC Assays of Serum or Saliva Samples. A. Representative curves of ThT fluorescence readings over time for αSynD RT-QuIC assays of serum samples from 10 PD and 10 HC subjects. B. Representative curves of ThT fluorescence readings over time for αSynD RT-QuIC assays of saliva samples from 10 PD and 10 HC subjects. All samples were coded and blinded for the RT-QuIC assays. The ThT fluorescence readings at the endpoint (93.35 h) were normalized to percentages of the maximal fluorescence reading (260,000) and used to measure the relative αSynD seeding activities in the respective samples. Orange lines: curves for PD samples; black lines: curves for HC subjects
Fig. 2
Fig. 2
Comparison of αSynD Seeding Activity in Serum or Saliva Samples from Patients with PD and Healthy Controls (HC) by αSyn-SAA. Scatter graphs of RT-QulC endpoint ThT fluorescence intensities (αSynD seeding activities) in serum samples (A) or saliva samples (C) from patients with PD and HC subjects. Graphed are the average of the endpoint ThT fluorescence in quadruplicate wells of 124 serum samples (42 HC, 82 PD) or 131 saliva samples (48 HC, 83 PD) in RT-QuIC assays as a percentage of the maximum fluorescence (%ThT fluorescence). ThT fluorescence cutoff: serum, 52,105; saliva, 62,613. **** p < 0.0001. ROC curves for αSynD seeding activities in 124 serum samples (B) or 131 saliva samples (D) from patients with PD and HC subjects. SE, standard error. 95% CI, 95% confidence interval.
Fig. 3
Fig. 3
Enhanced Diagnostic Accuracy for PD Using αSynD Seeding Activities in Both Serum and Saliva Samples from a Subset of Patients with PD and Healthy Control (HC) by αSyn-SAA. A. Scatter graph of αSynD seeding activities (RT-QuIC endpoint ThT fluorescence intensity) of serum samples in a subset of PD and HC subjects with paired serum and saliva samples. Scatter graph was plotted based on the average of the endpoint ThT fluorescence in quadruplicate wells as a percentage of the maximum fluorescence (%ThT fluorescence) in RT-QuIC assay of serum samples from 48 patients with PD and 26 HC in a subset of PD and HC subjects with both serum and saliva samples (termed serum-saliva subset or ss-subset). ThT fluorescence cutoff: 52,105. **** p < 0.0001. B. ROC curve and AUC for serum αSynD seeding activity comparisons between patients with PD and HC subjects in the ss-subset. ROC curve and AUC value were obtained based on αSynD seeding activity in serum samples from the patients with PD and HC of the ss-subset shown in panel A. C. Scatter graph of RT-QulC endpoint ThT fluorescence intensity (αSynD seeding activity) of saliva samples from patients with PD and HC in the ss-subset. Scatter graph was plotted based on αSynD seeding activities in saliva samples from the patients with PD and HC of the ss-subset shown in panel A. ThT fluorescence cutoff: 62,613. **** p < 0.0001. D. ROC curve and AUC for saliva αSynD seeding activity comparisons between the patients with PD and HC in a ss-subset. ROC curve and AUC value were obtained based on αSynD seeding activities in saliva of the patients with PD and HC of the ss-subset shown in panel C. E. 3-D Plot to identify optimal cutoff values for serum and saliva for maximum diagnostic accuracy for PD in the ss-subset shown in A and C. PD diagnostic accuracy was plotted against the RT-QuIC endpoint ThT fluorescence cutoff values of both serum and saliva in a 3-D plot, which identified the optimal endpoint ThT fluorescence cutoff settings to achieve maximal diagnostic accuracy for PD as 52,960 for serum and 66,800 for saliva. The accuracy values were calculated by varying the cutting off values for both serum and saliva with the definition that a patient was considered positive for PD only when the endpoint ThT fluorescence of both serum and saliva samples exceeded their respective cutoff values. F. ROC curve and AUC for PD diagnosis based on αSynD seeding activities in both serum and saliva of patients with PD and HC in the ss-subset. ROC curve and AUC were obtained based on calculated sensitivity and specificity values when varying the ThT fluorescence cutoff values for both serum and saliva. The sensitivity and specificity values were calculated based on the same definition of PD positivity as described in panel E. R analysis of the paired serum and saliva αSynD seeding activity data of the ss-subset was in agreement with the ROC analysis. **** p < 0.001. SE, standard error. 95% CI, 95% confidence interval (Continued next page)
Fig. 4
Fig. 4
Serum αSynD Seeding Activities Correlate with MoCA and HAM-D among Patients with PD. αSynD seeding activities (endpoint ThT fluorescence as a percentage of the maximum reading) in serum samples correlate inversely with MoCA score (A), positively with HAM-D score (B), and weakly positively with PDQ-39 cognitive impairment score (D), but not with modified Hoehn & Yahr (mH&Y) (C) of patients with PD. Linear regression lines with 95% confidence interval (gray shade) are shown
Fig. 5
Fig. 5
Saliva αSynD Seeding Activities Correlate with Age at Diagnosis and RBD among Patients with PD. αSynD seeding activities (endpoint ThT fluorescence as a percentage of the maximum reading) in saliva samples correlate inversely with RBD status (A) and age at diagnosis (B), but not with modified Hoehn & Yahr (mH&Y) (C) or MoCA (D) of patients with PD. Linear regression lines with 95% confidence interval (gray shade) are shown for B-D

Update of

References

    1. Hughes JE, Daniel SE, Ben-Shlomo Y, Lees AJ (2002) The accuracy of diagnosis of parkinsonian syndromes in a specialist movement disorder service. Brain 125(4):861–870 - PubMed
    1. Adler CH, Beach TG, Hentz JG, Shill HS, Caviness JN, Driver-Dunckley E et al (2014) Low clinical diagnostic accuracy of early vs advanced Parkinson disease. Neurology 83(5):406–412 - PMC - PubMed
    1. Rizzo G, Copetti M, Arcuti S, Martino D, Fontana A, Logroscino G (2016) Accuracy of clinical diagnosis of Parkinson disease: a systematic review and meta-analysis. Neurology 86(6):566–576 - PubMed
    1. Virameteekul S, Revesz T, Jaunmuktane Z, Warner TT, De Pablo-Fernández E (2023) Clinical diagnostic accuracy of Parkinson’s disease: where do we stand? Mov Disord 38(4):558–566 - PubMed
    1. Groveman BR, Orrù CD, Hughson AG, Raymond LD, Zanusso G et al (2018) Rapid and ultra-sensitive quantitation of disease-associated a-synuclein seeds in brain and cerebrospinal fluid by αSyn RT-QuIC. Acta Neuropathol Commun 6(1):7 - PMC - PubMed

Publication types

LinkOut - more resources