Seasonality and Co-Detection of Respiratory Viral Infections Among Hospitalised Patients Admitted With Acute Respiratory Illness-Valencia Region, Spain, 2010-2021
- PMID: 39439102
- PMCID: PMC11496384
- DOI: 10.1111/irv.70017
Seasonality and Co-Detection of Respiratory Viral Infections Among Hospitalised Patients Admitted With Acute Respiratory Illness-Valencia Region, Spain, 2010-2021
Abstract
Background: Respiratory viruses are known to represent a high burden in winter, yet the seasonality of many viruses remains poorly understood. Better knowledge of co-circulation and interaction between viruses is critical to prevention and management. We use > 10-year active surveillance in the Valencia Region to assess seasonality and co-circulation.
Methods: Over 2010-2021, samples from patients hospitalised for acute respiratory illness were analysed using multiplex real-time PCR to test for 9 viruses: influenza, respiratory syncytial virus (RSV), parainfluenza virus (PIV), rhino/enteroviruses (HRV/ENV), metapneumovirus (MPV), bocavirus, adenovirus, SARS-CoV-2 and non-SARS coronaviruses (HCoV). Winter seasonal patterns of incidence were examined. Instances of co-detection of multiple viruses in a sample were analysed and compared with expected values under a crude model of independent circulation.
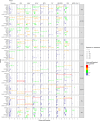
Results: Most viruses exhibited consistent patterns between years. Specifically, RSV and influenza seasons were clearly defined, peaking in December-February, as did HCoV and SARS-CoV-2. MPV, PIV and HRV/ENV showed less clear seasonality, with circulation outside the observed period. All viruses circulated in January, suggesting any pair had opportunity for co-infection. Multiple viruses were found in 4% of patients, with more common co-detection in children under 5 (9%) than older ages. Influenza co-detection was generally observed infrequently relative to expectation, while RSV co-detections were more common, particularly among young children.
Conclusions: We identify characteristic patterns of viruses associated with acute respiratory hospitalisation during winter. Simultaneous circulation permits extensive co-detection of viruses, particularly in young children. However, virus combinations appear to differ in their rates of co-detection, meriting further study.
Keywords: RSV respiratory syncytial virus; co‐detection; co‐infection; influenza; respiratory virus; rhinovirus; seasonality; severe acute respiratory syndrome coronavirus 2.
© 2024 The Author(s). Influenza and Other Respiratory Viruses published by John Wiley & Sons Ltd.
Conflict of interest statement
G.S. is funded by a Sanofi research grant through Institut Pasteur. S.S.C. and L.C. are employees of Sanofi and may hold shares in the company. J.D.D., A.M.I. and F.X.L.L. are employees at FISABIO foundation that have received funding from Sanofi and the Foundation for Influenza Epidemiology. A.M.I. has received fees for conferences/experts' meetings from Sanofi and for educational events from MSD. J.D.D. and his institution received grants from Sanofi and GSK related to RSV preventive strategies. J.D.D. acted as advisor for these immunisation strategies to Sanofi. L.O. received a research grant by Sanofi through Institut Pasteur. B.M.C. and J.P.B. declare no conflicts of interest.
Figures


References
Publication types
MeSH terms
Grants and funding
LinkOut - more resources
Full Text Sources
Medical
Miscellaneous

