. 2024 Oct 31;38(20):e70118.
doi: 10.1096/fj.202400132RRR.

m6A demethylase FTO transcriptionally activated by SP1 improves ischemia reperfusion-triggered acute kidney injury by activating Ambra1/ULK1-mediated autophagy

Affiliations

m6A demethylase FTO transcriptionally activated by SP1 improves ischemia reperfusion-triggered acute kidney injury by activating Ambra1/ULK1-mediated autophagy

Yan Chen et al. FASEB J. .

Abstract

Ischemia reperfusion (I/R) was considered as one of main causes of acute kidney injury (AKI). However, the exact mechanism remains unclear. Here, this study aimed to investigate the role and mechanism of the m6A demethylase fat mass and obesity-associated (FTO) protein in I/R-induced AKI. HK-2 cells and SD rats were utilized to establish hypoxia/reoxygenation (H/R) or I/R induced AKI models. The changes of RNAs and proteins were quantified using RT-qPCR, western blot, and immunofluorescence assays, respectively. Cell proliferation and apoptosis were assessed by CCK-8 and flow cytometry. Interactions between molecules were investigated using RIP, ChIP, Co-IP, RNA pull-down, and dual luciferase reporter assays. Global m6A quantification was evaluated by kits. TUNEL and HE staining were employed for histopathological examinations. Oxidative stress-related indicators and renal function were determined using ELISA assays. The FTO expression was downregulated in H/R-induced HK-2 cells and renal tissues from I/R-induced rats. Overexpression of FTO improved the cell viability but repressed apoptosis and oxidative stress in H/R-treated HK-2 cells, as well as enhanced renal function and alleviated kidney injury in I/R rats. Notably, the FTO overexpression significantly increased autophagy-related LC3 and ULK1 levels. When autophagy was inhibited, the protective effects of FTO in AKI were diminished. Notably, Ambra1, a crucial regulator of autophagy, was repressed in H/R-induced HK-2 cells. However, the FTO overexpression restored the Ambra1 expression by reducing m6A modification of its mRNA. SP1, acting as an upstream transcription factor, directly interacts with the FTO promoter to enhance FTO expression. Knockdown of SP1 or Ambra1 suppressed the beneficial effects of FTO upregulation on autophagy and oxidative stress injury in H/R-stimulated cells. FTO, transcriptionally activated by SP1, promoted autophagy by upregulating Ambra1/ULK1 signaling, thereby inhibiting oxidative stress and kidney injury. These findings may provide some novel insights for AKI treatment.

Keywords: Ambra1; FTO; SP1; ULK1; acute kidney injury; autophagy.


Figures

FIGURE 1
FIGURE 1
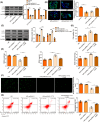
Gain‐of‐function of FTO alleviated H/R‐induced oxidative stress injury. (A and B) HK‐2 cells were cultured under H/R condition for 2, 4 or 6 h. RT‐qPCR and Western blot were used to detect FTO expression. (C) The mRNA expression of FTO in HK‐2 cells transfected with pcDNA3.1‐FTO or pcDNA3.1 were detected by RT‐qPCR. Next, HK‐2 cells were transfected with pcDNA3.1‐FTO or pcDNA3.1, and then cultured under H/R condition. (D) CCK‐8 detection of cell viability. (E) ELISA detection of MDA, GSH, and SOD levels. (F) DCFH‐DA was adopted to detect ROS level. (G) Flow cytometry detection of apoptosis. Error bars represent the mean ± SD of at least three independent experiments. *p < .05, **p < .01, ***p < .001.
FIGURE 2
FIGURE 2
Autophagy inhibition reversed the FTO overexpression‐mediated inhibitory effects on H/R‐triggered oxidative stress injury. HK‐2 cells were transfected with pcDNA3.1‐FTO or pcDNA3.1, and then cultured under H/R condition. (A) Western blot detection of LC3II/I and ULK1 expression. (B) Immunofluorescence detection of LC3B. Next, HK‐2 cells were treated with the FTO overexpression and 3‐MA (an autophagy inhibitor), and then cultured under H/R condition. (C) Western blot detection of LC3II/I and ULK1 expression. (D) CCK‐8 detection of cell viability. (E) ELISA detection of MDA, GSH, and SOD levels. (F) DCFH‐DA was adopted to detect ROS level. (G) Flow cytometry detection of apoptosis. The data are expressed as the mean ± SD and are representative of 3 experiments. *p < .05, **p < .01, ***p < .001.
FIGURE 3
FIGURE 3
Enforced expression of FTO relieved I/R‐induced AKI through activating autophagy. A rat model of renal I/R injury was established and treated with a FTO overexpressing vector. (A and B) ELISA analysis of serum BUN and Cr levels. (C) Representative images of HE staining to assess renal histopathological changes in rats. (D) Representative images of TUNEL staining to detect renal tubular cell apoptosis. (E) ELISA analysis of MDA, GSH and SOD levels. (F) Western blot detection of LC3II/I and ULK1 expression. (G) RT‐qPCR detection of FTO expression. Data are the means ± SD for three independent experiments. *p < .05, **p < .01, ***p < .001. n = 6 rats/group.
FIGURE 4
FIGURE 4
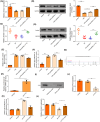
FTO enhanced autophagy‐related Ambra1 expression via a m6A‐dependent manner. (A and B) Effects of the FTO overexpression on the Ambra1 expression in H/R‐induced HK‐2 cells were detected by RT‐qPCR and Western blot. (C and D) Rats were divided into the Sham group, I/R group, I/R + pcDNA3.1‐NC group, and I/R + pcDNA3.1‐FTO group. The Ambra1 expression was detected by RT‐qPCR and Western blot. (E) The global m6A levels were detected by kits. (F) m6A modification level of Ambra1 was detected by meRIP. (G) Schematic diagram of the m6A modification sites on Ambra1 mRNA, which was predicted by SRAMP database. (H and I) RIP and RNA pull down assays were used to detect the binding relationship between FTO and Ambra1 mRNA. (J) Transfection efficiency of sh‐FTO in HK‐2 cells was detected by RT‐qPCR. Next, HK‐2 cells were treated with sh‐FTO or co‐treated with sh‐FTO and DAA (a m6A inhibitor). (K) m6A modification of Ambra1 mRNA was detected by meRIP. (L) The Ambra1 expression was detected by RT‐qPCR. Data are represented as the mean ± SD of three independent experiments. *p < .05, **p < .01, ***p < .001.
FIGURE 5
FIGURE 5
Ambra1 inhibition reversed the FTO overexpression‐mediated autophagy activation. (A) Co‐IP detection of the binding between Ambra1 and TRAF6, TRIM32 or ULK1 in HK2 cells. (B) RT‐qPCR was used to detect the Ambra1 expression after sh‐Ambra1 transfection. Next, HK‐2 cells were co‐transfected with pcDNA3.1‐FTO and sh‐Ambra1, and then cultured under H/R condition. (C) Western blot detection of Ambra1, LC3II/I, and ULK1 expression. Values were expressed as mean ± SD of three separate determinations. *p < .05, **p < .01, ***p < .001.
FIGURE 6
FIGURE 6
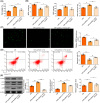
Silencing of Ambra1 restrained the FTO overexpression‐mediated protective effects on H/R‐triggered oxidative stress injury. HK‐2 cells were co‐transfected with pcDNA3.1‐FTO and sh‐Ambra1, and then cultured under H/R condition. (A) CCK‐8 detection of cell viability. (B) ELISA detection of MDA, GSH, and SOD levels. (C) DCFH‐DA was adopted to detect ROS level. (D) Flow cytometry detection of apoptosis. Error bars represent the mean ± SD of at least three independent experiments. *p < .05, **p < .01, ***p < .001.
FIGURE 7
FIGURE 7
FTO was transcriptionally regulated by SP1. (A) Schematic diagram of SP1 motif. (B) Schematic diagram of potential binding sites of SP1 on FTO promoter predicted by JASPAR database. (C) ChIP assay was used to confirm the binding relationship between SP1 and FTO promoter. (D) RT‐qPCR detection of the effects of overexpressing or knockdown efficiency of SP. (E) Dual luciferase reporter assay was utilized to detect the effect of SP1 on the transcriptional activity of FTO promoter. (F) RT‐qPCR detection of FTO expression. (G) Western blot detection of SP1 and FTO expression. Values were expressed as mean ± SD of three separate determinations. *p < .05, **p < .01, ***p < .001.
FIGURE 8
FIGURE 8
SP1 knockdown diminished the effects of FTO upregulation on autophagy and oxidative stress in H/R induced HK‐2 cells. HK‐2 cells were transfected with pcDNA3.1‐FTO or co‐transfected with pcDNA3.1‐FTO and sh‐SP1, and then cultured under H/R condition. (A) CCK‐8 detection of cell viability. (B) ELISA detection of MDA, GSH, and SOD levels. (C) DCFH‐DA was used to detect ROS level. (D) Flow cytometry detection of apoptosis. (E) Western blot detection of Ambra1, LC3II/I and ULK1 expression. Error bars represent the mean ± SD of at least three independent experiments. *p < .05, **p < .01, ***p < .001.

References

    1. Ronco C, Bellomo R, Kellum JA. Acute kidney injury. Lancet. 2019;394(10212):1949‐1964. - PubMed
    1. Shiva N, Sharma N, Kulkarni YA, Mulay SR, Gaikwad AB. Renal ischemia/reperfusion injury: an insight on in vitro and in vivo models. Life Sci. 2020;256:117860. - PubMed
    1. Malek M, Nematbakhsh M. Renal ischemia/reperfusion injury; from pathophysiology to treatment. J Renal Inj Prev. 2015;4(2):20‐27. - PMC - PubMed
    1. Lerink LJS, de Kok MJC, Mulvey JF, et al. Preclinical models versus clinical renal ischemia reperfusion injury: a systematic review based on metabolic signatures. Am J Transplant. 2022;22(2):344‐370. - PMC - PubMed
    1. Li M, Ning J, Huang H, Jiang S, Zhuo D. Allicin protects against renal ischemia‐reperfusion injury by attenuating oxidative stress and apoptosis. Int Urol Nephrol. 2022;54(7):1761‐1768. - PMC - PubMed

MeSH terms

Substances

LinkOut - more resources