. 2024 Oct 8:11:1439259.
doi: 10.3389/fmolb.2024.1439259. eCollection 2024.

Navigating directed evolution efficiently: optimizing selection conditions and selection output analysis

Affiliations

Navigating directed evolution efficiently: optimizing selection conditions and selection output analysis

Paola Handal-Marquez et al. Front Mol Biosci. .

Abstract

Directed evolution is a powerful tool that can bypass gaps in our understanding of the sequence-function relationship of proteins and still isolate variants with desired activities, properties, and substrate specificities. The rise of directed evolution platforms for polymerase engineering has accelerated the isolation of xenobiotic nucleic acid (XNA) synthetases and reverse transcriptases capable of processing a wide array of unnatural XNAs which have numerous therapeutic and biotechnological applications. Still, the current generation of XNA polymerases functions with significantly lower efficiency than the natural counterparts and retains a significant level of DNA polymerase activity which limits their in vivo applications. Although directed evolution approaches are continuously being developed and implemented to improve XNA polymerase engineering, the field lacks an in-depth analysis of the effect of selection parameters, library construction biases and sampling biases. Focusing on the directed evolution pipeline for DNA and XNA polymerase engineering, this work sets out a method for understanding the impact of selection conditions on selection success and efficiency. We also explore the influence of selection conditions on fidelity at the population and individual mutant level. Additionally, we explore the sequencing coverage requirements in directed evolution experiments, which differ from genome assembly and other -omics approaches. This analysis allowed us to identify the sequencing coverage threshold for the accurate and precise identification of significantly enriched mutants. Overall, this study introduces a robust methodology for optimizing selection protocols, which effectively streamlines selection processes by employing small libraries and cost-effective NGS sequencing. It provides valuable insights into critical considerations, thereby enhancing the overall effectiveness and efficiency of directed evolution strategies applicable to enzymes other than the ones considered here.

Keywords: design of experiments; directed evolution; fitness landscape; next-generation sequencing (NGS) data analysis; polymerase engineering.


Conflict of interest statement

The authors declare that the research was conducted in the absence of any commercial or financial relationships that could be construed as a potential conflict of interest.

Figures

FIGURE 1
FIGURE 1
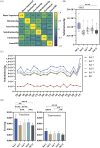
Compartmentalized self-replication (CSR) optimization pipeline and recovery. (A) An expressed polymerase library is emulsified with different substrates and reaction additives (factors). Cells are lysed within the emulsion and polymerase variants access the provided substrates to amplify their own encoding genes. The proportion of highly active variant genes within the provided selection conditions (e.g., green) should increase whereas that of variants with lower activity (e.g., orange) should decrease. Amplified products are recovered and quantified, cloned and/or sequenced. These measurements (responses) are used to determine the efficiency of selection and determine the influence of factors on selection. (B) Pipeline for recovering selection products, including recovery PCR using primers that hybridize to overhangs introduced by selection primers and subsequent innest PCR reactions to introduce overhangs for cloning or to prepare amplicons for NGS. PCR parameters were empirically optimized to minimize the number of cycles needed for visualization, while maintaining significant differences to background (control reactions). (C) Agarose gel electrophoresis of selection products from DoE Design 1 (D1) post-recovery PCR and innest PCR with different cycling parameters. The x28 innest PCR reactions amplified from recovery PCR of x20 cycles were selected for cloning and NGS as these parameters lead to maximum yields with minimum background. Red arrows indicate the expected molecular weight of the PCR product (664 bp), and red rectangles denote correctly sized products (664 bp).
FIGURE 2
FIGURE 2
Quantification and analysis of DoE-CSR D1 selection products. (A) Selection products from recovery (Rec) and innest (Innest) PCRs with x20 (e.g., Rec20) or x28 (e.g., Rec28) cycles, were quantified through densiometric measurement of band intensity from agarose gels (G, e.g., Rec28G) and through spectrophotometric measurements by absorbance at 260 nm (S, e.g., Rec28S). The product yields were normalized to the smallest yield (0%) and largest yield (100%) identified in each quantification method. (B) Selection parameters and their corresponding binary level (0 = 0 concentration or seconds, 1 maximum concentration or seconds) of positive selections from D1 (Selections 2, 5, 7, 8, 11). The complete list of factors and levels for all selections and actual concentrations/times can be found on Supplementary Material S1. (C) Feature importance analysis was carried out using Lasso regression model to determine the impact of selection factors on Innest28G and Innest28S responses. The coefficient values of each factor derived from 100 runs of the model were averaged and their value plotted as a measure of factor importance. The average R2 and RMSE values for the models with Innest28G as the response were 0.58 ± 1.77 × 10⁻² and 0.62 ± 1.31 × 10⁻² respectively and the average R2 and RMSE values for the models with Innest28S as the response were 0.97 ± 8.82 × 10⁻² and 0.14 ± 1.05 × 10⁻¹ respectively. Only R2 values are shown in the plot, a complete list of model coefficients and metrics can be found in Supplementary Material S3.
FIGURE 3
FIGURE 3
Quantification and analysis of DoE-CSR D2 selection products. (A) Products from the x28 cycle recovery (Rec) and innest (Innest) PCR reactions from the D2 selections were quantified through densiometric measurement of band intensity from agarose gels (G) and through spectrophotometric measurements by absorbance at 260 nm (S). Background noise was removed by dividing gel quantifications by the average yield of 12 negative control reactions. Spectrophotometric quantifications were noise-adjusted by subtracting the average yield of the 12 negative control reactions. Quantifications were normalized to the smallest yield (0%) and largest yield (100%) identified in each quantification method. (B) Feature importance analysis was carried out using a Lasso regression model to determine the impact of selection factors on each response (Innest28G or Innest28S). The coefficient values of each factor derived from 100 runs of the model were averaged and their value plotted. Absolute averages, serving as an overall measure of factor importance, can be found in Supplementary Table S5. The average R2 and RMSE values for the models with Innest28G as the response were 0.87 ± 0.0054, 0.35 ± 0.0074 respectively and the average R2 and RMSE values for the models with Innest28S as the response were 0.82 ± 0.0022, 0.41 ± 0.0026 respectively. (C) Lasso regression modelling with interaction terms was carried out to identify factor interactions. The corresponding importance metrics of quadratic effects and interactions across features are displayed in a 2D plot for clarity. The average R2 and RMSE values for the models with Innest28G as the response were 0.87 ± 5.41 × 10⁻³, 0.35 ± 7.36 × 10⁻³ respectively and the average R2 and RMSE values for the models with Innest28S as the response were 0.82 ± 2.20 × 10⁻³, 0.41 ± 2.59 × 10⁻³ respectively. Only R2 values are shown in the plot, a complete list of model coefficients and metrics be found in Supplementary Material S3.
FIGURE 4
FIGURE 4
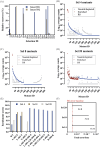
Mutant enrichment and population fidelity analysis of successful D1 selections. (A) The log average count and standard deviation of each mutant across all 5 positive D1 selections was plotted. Significantly enriched mutants are colored in red, neutral, or significantly depleted mutants are colored in blue, and the corresponding log count of each mutant pre-selection (R0) is shown in grey. (B)) The enrichment scores of significantly enriched mutants across selections. (C) Overall fidelity scores (insertion, deletion, and substitution rates) by polymerase variants in each selection normalized to the fidelity pre-selection (R0), 7.49 × 10⁻⁴. The fold numbers correspond to the fidelity relative to the R0. (D) Correlation plot of bases sequenced and error rates by type.
FIGURE 5
FIGURE 5
Fidelity analysis of significantly enriched mutants from successful D1 selections. (A) Correlation plot of bases sequenced error rates by type and recovery yield (Innest28S). (B) Overall substitution error rates of significantly enriched mutants across selections. Significance comparisons (p < 0.01) were determined by the Kruskal-Wallis test followed by Dunn’s multiple comparison test with Bonferroni correction. (C) Mutant-specific substitution error rates across selections as well as pre-selection (R0). (D) The overall transition and transversion error rates of significantly enriched mutants across significantly enriched mutants across selections and significance comparisons determined by the Friedman test followed by the multiple comparisons Dunn’s test with Bonferroni correction.
FIGURE 6
FIGURE 6
Mutant-specific fidelity analysis of top enriched mutants from successful D1 selections. Frequency of transition and transversion incorporation of selection 2 (Sel 2) and selection 5 (Sel 5) mutants.
FIGURE 7
FIGURE 7
Quantification and analysis of DoE-CSR D4 selection products. (A) Products from the x30 innest PCR reactions from the D4 selections were quantified through densiometric measurement of band intensity from agarose gels (Innest30G) and through dye-based Qubit fluorometric quantification (Innest30Q). Product yields were normalized to the smallest yield (0%) and largest yield (100%). Top 400 mutant log counts from D4 positive selection 4 (B), selection 8 (C) and selection 20 (D) are shown. Significantly enriched mutants (red), neutral, or significantly depleted mutants (blue), and the corresponding log count of each mutant pre-selection (grey) are highlighted. Mutants with lower counts post-selection may appear enriched if their frequency relative to the total counts is higher. (E) The enrichment scores of significantly enriched mutants across selections with >1,000 counts post-selection. (F) Overall fidelity scores (insertion, deletion, and substitution rates) by polymerase variants in each selection normalized to the fidelity pre-selection (R0). The fold numbers correspond to the fidelity relative to the R0.
FIGURE 8
FIGURE 8
Fidelity analysis of significantly enriched mutants from successful D4 selections. (A) The overall substitution error rates of significantly enriched mutants across selections and significance comparisons determined by the Friedman test followed by the multiple comparisons Dunn’s test with Bonferroni correction. (B) Mutant-specific substitution error rates across selections as well as pre-selection (R0).
FIGURE 9
FIGURE 9
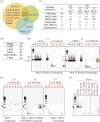
Incorporation of 2′F-rATP in PCR by enriched KOD DNAP variants. (A) Venn diagram showing mutations isolated in successful D4 and D1 selections. Mutants labelled in red were selected for further characterization. (B) Mutants selected and their corresponding ID in experiments (C–F). (C) PCR conditions mimicking selection parameters from D1 Sel 7 and D4 Sel 4, 8 and 20, labelled from V2 – V5. V1 corresponds to selection parameters that enabled the isolation of a mesophilic HNA synthetase (Handal-Marquez et al., 2022). (D) PCR products from each mutant in V1 and V2 reaction conditions with dNTPs or 2′F-rATP substitution (rA*). Red highlights indicate reactions with 2′F-rATP, red arrows indicate the expected molecular weight of the PCR product (664 bp), and red rectangles denote correctly sized products (664 bp). (E) PCR products from reactions with V3, V4 and V5 conditions. (F) PCR products from reactions with V4 conditions and dNTPs, or substitutions with 2′-deoxy-2′-α-fluoro nucleoside triphosphates (rN*).
FIGURE 10
FIGURE 10
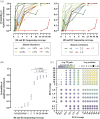
Sequencing coverage analysis in directed evolution. (A) Ten subsets of sequencing reads at varying coverages pre- (R0) and post- (R1) selection from D1 Sel 7 were extracted, and the probability of isolating significantly enriched mutants across these subsets was calculated and plotted. Mutants are color-coded by frequency (left) and enrichment scores (right). (B) Average probability of identifying expected significantly enriched mutants across trials, with significance comparisons conducted against 60x coverage using Friedman test followed by Dunn’s test with Bonferroni correction. Only significant differences were found between 60x and 2x or lower coverages. (C) 2D bubble plot illustrating the impact of sequencing coverages pre- (R0) and post- (R1) selection on true positive (TP) probability and precision, where precision is calculated as TP divided by the sum of TP and false positives (FP). Low probability scores indicate reduced likelihood of identifying all significantly enriched mutants, while precision measures the accuracy of positive predictions.

References

    1. Abil Z., Ellefson J. W., Gollihar J. D., Watkins E., Ellington A. D. (2017). Compartmentalized partnered replication for the directed evolution of genetic parts and circuits. Nat. Protoc. 12, 2493–2512. 10.1038/nprot.2017.119 - DOI - PMC - PubMed
    1. Afgan E., Nekrutenko A., Grüning B. A., Blankenberg D., Goecks J., Schatz M. C., et al. (2022). The Galaxy platform for accessible, reproducible and collaborative biomedical analyses: 2022 update. Nucleic Acids Res. 50, W345–W351. 10.1093/nar/gkac247 - DOI - PMC - PubMed
    1. Antony J. (2023). Design of experiments for engineers and scientists, third edition. Elsevier.
    1. Beletskii A., Bhagwat A. S. (1996). Transcription-induced mutations: increase in C to T mutations in the nontranscribed strand during transcription in Escherichia coli . Proc. Natl. Acad. Sci. 93, 13919–13924. 10.1073/pnas.93.24.13919 - DOI - PMC - PubMed
    1. Chakrabarti R., Schutt C. E. (2001). The enhancement of PCR amplification by low molecular weight amides. Nucleic Acids Res. 29, 2377–2381. 10.1093/nar/29.11.2377 - DOI - PMC - PubMed

LinkOut - more resources