. 2024 Oct 8:15:1450317.
doi: 10.3389/fendo.2024.1450317. eCollection 2024.

Advancing non-alcoholic fatty liver disease prediction: a comprehensive machine learning approach integrating SHAP interpretability and multi-cohort validation

Affiliations

Advancing non-alcoholic fatty liver disease prediction: a comprehensive machine learning approach integrating SHAP interpretability and multi-cohort validation

Bo Yang et al. Front Endocrinol (Lausanne). .

Abstract

Introduction: Non-alcoholic fatty liver disease (NAFLD) represents a major global health challenge, often undiagnosed because of suboptimal screening tools. Advances in machine learning (ML) offer potential improvements in predictive diagnostics, leveraging complex clinical datasets.

Methods: We utilized a comprehensive dataset from the Dryad database for model development and training and performed external validation using data from the National Health and Nutrition Examination Survey (NHANES) 2017-2020 cycles. Seven distinct ML models were developed and rigorously evaluated. Additionally, we employed the SHapley Additive exPlanations (SHAP) method to enhance the interpretability of the models, allowing for a detailed understanding of how each variable contributes to predictive outcomes.

Results: A total of 14,913 participants were eligible for this study. Among the seven constructed models, the light gradient boosting machine achieved the highest performance, with an area under the receiver operating characteristic curve of 0.90 in the internal validation set and 0.81 in the external NHANES validation cohort. In detailed performance metrics, it maintained an accuracy of 87%, a sensitivity of 92.9%, and an F1 score of 0.92. Key predictive variables identified included alanine aminotransferase, gammaglutamyl transpeptidase, triglyceride glucose-waist circumference, metabolic score for insulin resistance, and HbA1c, which are strongly associated with metabolic dysfunctions integral to NAFLD progression.

Conclusions: The integration of ML with SHAP interpretability provides a robust predictive tool for NAFLD, enhancing the early identification and potential management of the disease. The model's high accuracy and generalizability across diverse populations highlight its clinical utility, though future enhancements should include longitudinal data and lifestyle factors to refine risk assessments further.

Keywords: SHAP interpretability; light gradient boosting machine; machine learning; non-alcoholic fatty liver disease; predictive model.


Conflict of interest statement

The authors declare that the research was conducted in the absence of any commercial or financial relationships that could be construed as a potential conflict of interest.

Figures

Figure 1
Figure 1
Flow diagram of the inclusion and exclusion criteria for the collection of data on NAFLD patients in the Dryad and NHANES cohorts. NAFLD, non-alcoholic fatty liver disease.
Figure 2
Figure 2
Machine learning flowchart of this study.
Figure 3
Figure 3
Comparison of machine learning models on training and test datasets using ROC curves. (A) ROC curves of seven machine learning models in the training set. (B) ROC curves of seven machine learning models in the test set.
Figure 4
Figure 4
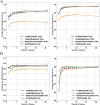
Performance evaluation of machine learning models on feature selection in training and test datasets. (A) Model accuracy and AUC for various classifiers in the training set. (B) Model accuracy and AUC for various classifiers in the test set.
Figure 5
Figure 5
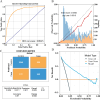
Comprehensive evaluation of the final model’s performance on the training set. (A) ROC curve illustrating the model’s diagnostic ability. (B) Calibration plot with the Brier score and Log loss. Bars indicate the group with NAFLD (orange) and the control group (blue) per interval of predicted probability. (C) Confusion matrix detailing actual vs. predicted classifications. (D) Decision curve analysis showing the net benefit across different threshold probabilities.
Figure 6
Figure 6
Comprehensive evaluation of the final model’s performance on the validation set. (A) ROC curve illustrating the model’s diagnostic ability. (B) Calibration plot with the Brier score and Log loss. Bars indicate the group with NAFLD (orange) and the control group (blue) per interval of predicted probability. (C) Confusion matrix detailing actual vs. predicted classifications. (D) Decision curve analysis showing the net benefit across different threshold probabilities.
Figure 7
Figure 7
Analysis of feature importance and relationships in predictive modeling. (A) SHAP summary plot showing the effects of features on model output. (B) SHAP bar plot illustrating the mean SHAP values for each feature. (C) Feature importance ranking based on total SHAP values. (D) Detailed SHAP value plots for individual features, demonstrating their contribution to model predictions. SHAP, SHapley Additive explanations.
Figure 8
Figure 8
Machine learning model analysis using biochemical markers to predict NAFLD. (A) SHAP values for features suggesting a non-NAFLD prediction. (B) SHAP values for features suggesting an NAFLD prediction. (C) Waterfall plot illustrating the cumulative effect of features on the model’s output starting from the base value for a non-NAFLD prediction. (D) Waterfall plot showing the cumulative effect of features for an NAFLD prediction. SHAP, SHapley Additive explanations; NAFLD, non-alcoholic fatty liver disease.

References

    1. Byrne CD, Targher G. Nafld: A multisystem disease. J Hepatol. (2015) 62:S47–64. doi: 10.1016/j.jhep.2014.12.012 - DOI - PubMed
    1. Wang JL, Jiang SW, Hu AR, Zhou AW, Hu T, Li HS, et al. . Non-invasive diagnosis of non-alcoholic fatty liver disease: current status and future perspective. Heliyon. (2024) 10:e27325. doi: 10.1016/j.heliyon.2024.e27325 - DOI - PMC - PubMed
    1. Cotter TG, Rinella M. Nonalcoholic fatty liver disease 2020: the state of the disease. Gastroenterology. (2020) 158:1851–64. doi: 10.1053/j.gastro.2020.01.052 - DOI - PubMed
    1. Younossi ZM, Koenig AB, Abdelatif D, Fazel Y, Henry L, Wymer M. Global epidemiology of nonalcoholic fatty liver disease-meta-analytic assessment of prevalence, incidence, and outcomes. Hepatology. (2016) 64:73–84. doi: 10.1002/hep.28431 - DOI - PubMed
    1. Younossi ZM. Non-alcoholic fatty liver disease - a global public health perspective. J Hepatol. (2019) 70:531–44. doi: 10.1016/j.jhep.2018.10.033 - DOI - PubMed

LinkOut - more resources