

Network Pharmacology-Based Strategy to Explore the Effect and Mechanism of Zhizhu Granule Improving Glucose-Lipid Metabolism in Rats with Metabolic Syndrome
- PMID: 39440025
- PMCID: PMC11495215
- DOI: 10.2147/DMSO.S477410
Network Pharmacology-Based Strategy to Explore the Effect and Mechanism of Zhizhu Granule Improving Glucose-Lipid Metabolism in Rats with Metabolic Syndrome
Abstract
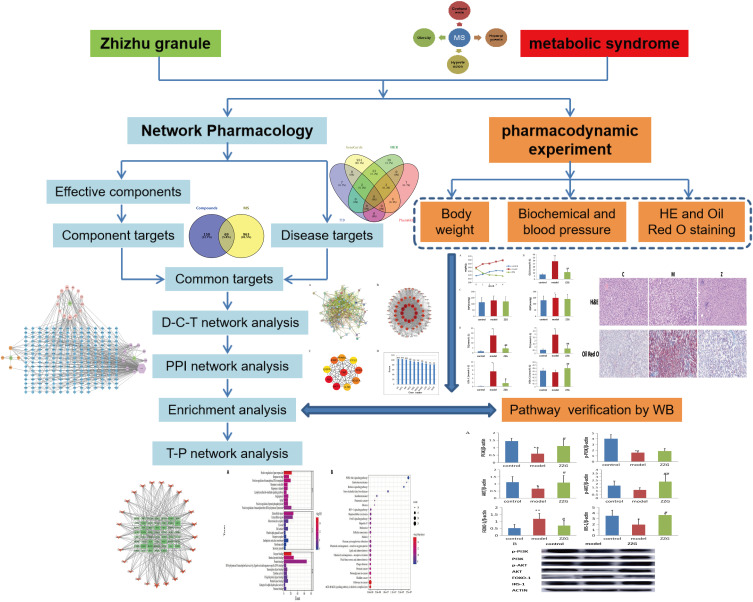
Objective: To explore the mechanism of the traditional Chinese medicine (TCM), Zhizhu granule (ZZG), in treating metabolic syndrome (MS) based on network pharmacology and pharmacodynamic experiment.
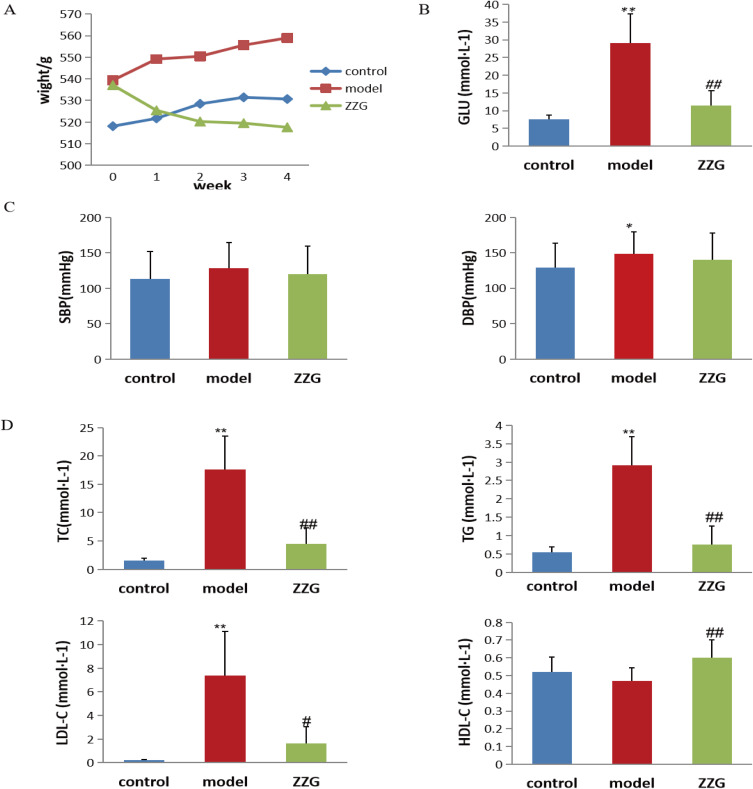
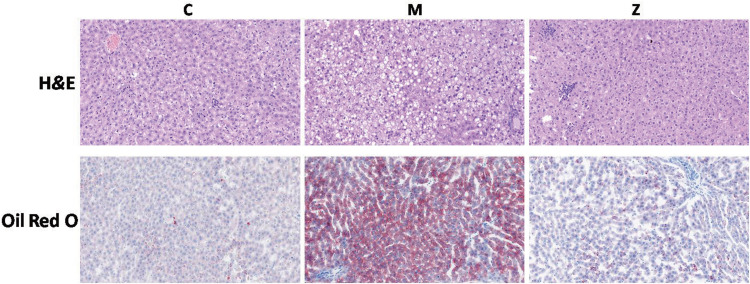
Materials and methods: Network pharmacology combined with a pharmacodynamic experiment was used to elucidate the therapeutic mechanism of ZZG in MS. Serum samples were collected from rats with MS, induced by a high-sugar-fat-salt diet (HSFSD) combined with streptozotocin (STZ), to measure the levels of biochemical markers. The glucose (GLU), total cholesterol (TC), triglyceride (TG), low-density lipoprotein cholesterol (LDL-C), high-density lipoprotein cholesterol (HDL-C), systolic blood pressure (SBP), and diastolic blood pressure (DBP) were detected. The liver tissue of rats was used for histological examination and Western blot analysis.
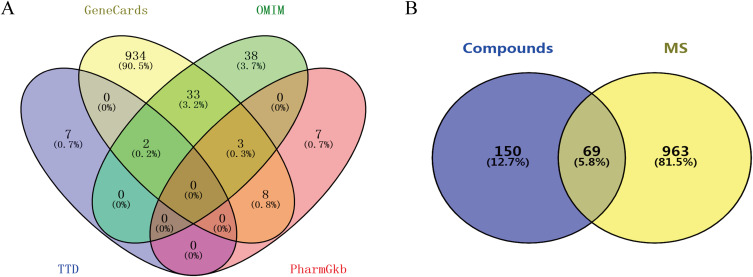
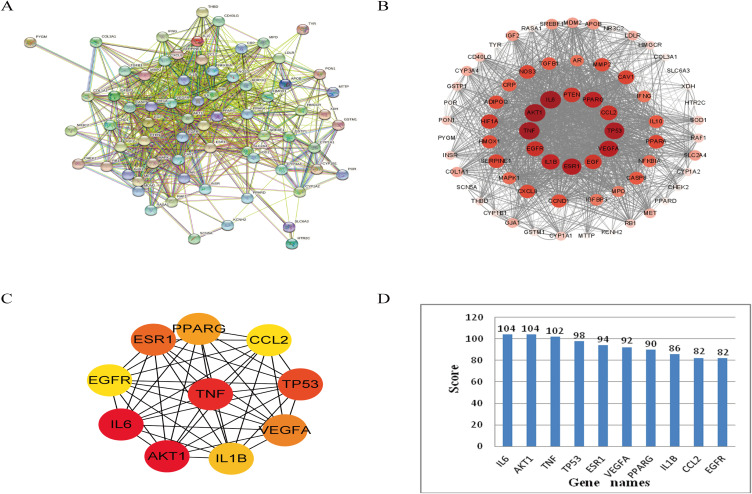
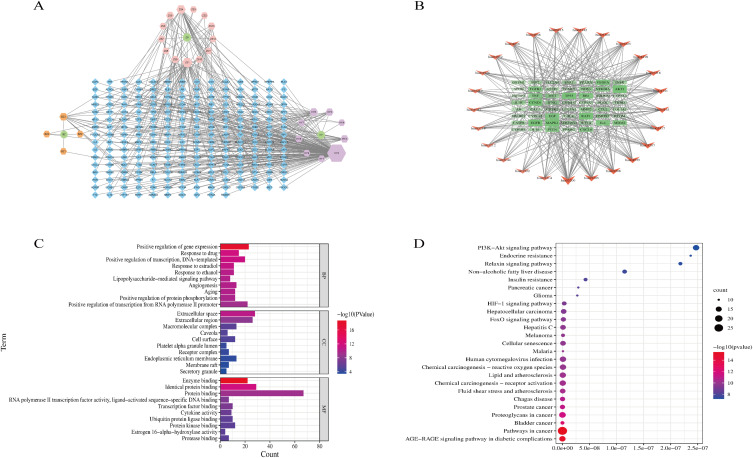
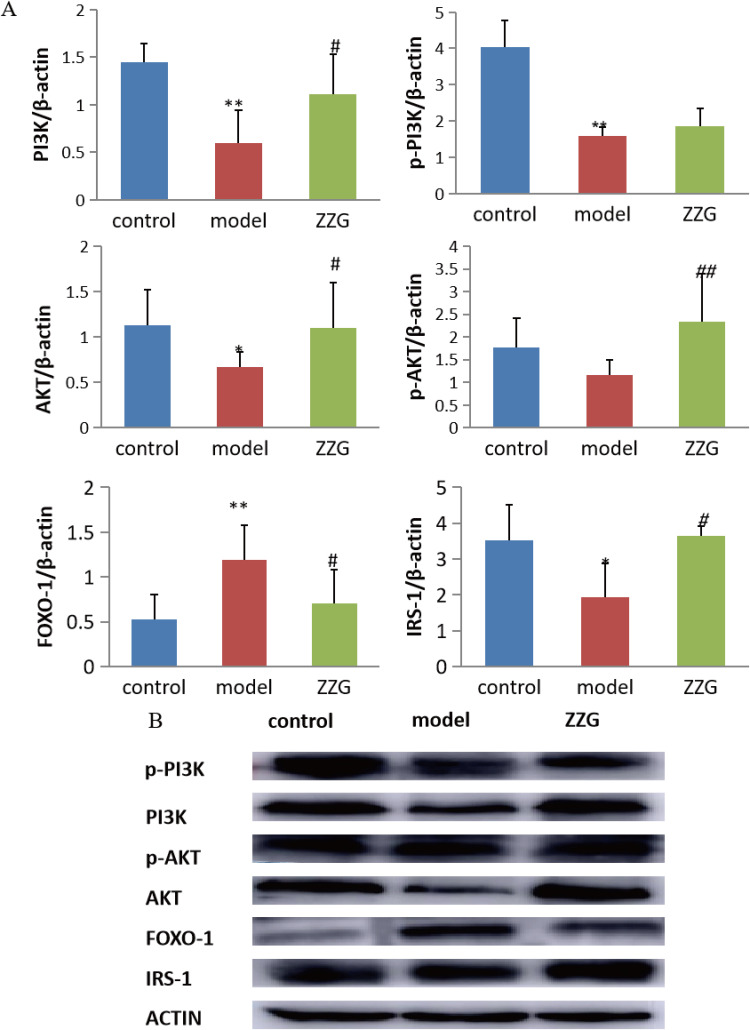
Results: Network pharmacology analysis generated 69 drug-disease common targets and 10 hub genes closely related to ZZG against MS. KEGG pathway analysis revealed that the PI3K/AKT signaling pathway was the most potential pathway, which took part in the therapeutic mechanisms. In the animal experiments section, the therapeutic effect of ZZG on MS and the therapeutic pathway of ZZG on MS were verified. ZZG could significantly decrease the body weight, TC, TG, LDL-C and GLU levels in MS rats (all p<0.01), alleviate hepatocyte steatosis and decrease liver lipid droplet deposition. Western blot analysis indicated that compared with the model group, the expression levels of PI3K, AKT, and IRS-1 protein were significantly increased (all p<0.05), and the FOXO-1 was significantly decreased (all p<0.05) in the ZZG group.
Conclusion: ZZG can improve glucose-lipid metabolism disorder in rats with metabolic syndrome. The reported results provide experimental evidence for ZZG in the treatment of MS.
Keywords: PI3K/AKT pathway; Zhizhu granule; metabolic syndrome; network pharmacology; pharmacodynamic experiment.
© 2024 Wang et al.
Conflict of interest statement
The authors declare that the study has no conflicts of interest.
Figures
Similar articles
-
[Mechanism of Astragali Radix-Puerariae Lobatae Radix combination in regulating type 2 diabetes mellitus through AMPK signaling pathway: based on network pharmacology and experimental verification].Zhongguo Zhong Yao Za Zhi. 2022 May;47(10):2738-2749. doi: 10.19540/j.cnki.cjcmm.20211216.703. Zhongguo Zhong Yao Za Zhi. 2022. PMID: 35718494 Chinese.
-
Molecular mechanism of Fufang Zhenzhu Tiaozhi capsule in the treatment of type 2 diabetes mellitus with nonalcoholic fatty liver disease based on network pharmacology and validation in minipigs.J Ethnopharmacol. 2021 Jun 28;274:114056. doi: 10.1016/j.jep.2021.114056. Epub 2021 Mar 23. J Ethnopharmacol. 2021. PMID: 33771638
-
Lei-gong-gen formula granule attenuates hyperlipidemia in rats via cGMP-PKG signaling pathway.J Ethnopharmacol. 2020 Oct 5;260:112989. doi: 10.1016/j.jep.2020.112989. Epub 2020 Jun 8. J Ethnopharmacol. 2020. PMID: 32526339
-
Network pharmacology-based approach uncovers the pharmacodynamic components and mechanism of Fructus Tribuli for improving endothelial dysfunction in hypertension.J Ethnopharmacol. 2023 Nov 15;316:116749. doi: 10.1016/j.jep.2023.116749. Epub 2023 Jun 7. J Ethnopharmacol. 2023. PMID: 37295575
-
Effect of Korean Red Ginseng on metabolic syndrome.J Ginseng Res. 2021 May;45(3):380-389. doi: 10.1016/j.jgr.2020.11.002. Epub 2020 Nov 12. J Ginseng Res. 2021. PMID: 34025131 Free PMC article. Review.
References
LinkOut - more resources
Full Text Sources
Research Materials
Miscellaneous
