Vector time series modelling of turbidity in Dublin Bay
- PMID: 39440233
- PMCID: PMC11492412
- DOI: 10.1080/02664763.2024.2315470
Vector time series modelling of turbidity in Dublin Bay
Abstract
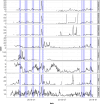
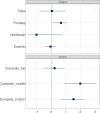
Turbidity is commonly monitored as an important water quality index. Human activities, such as dredging and dumping operations, can disrupt turbidity levels and should be monitored and analysed for possible effects. In this paper, we model the variations of turbidity in Dublin Bay over space and time to investigate the effects of dumping and dredging while controlling for the effect of wind speed as a common atmospheric effect. We develop a Vector Auto-Regressive Integrated Conditional Heteroskedasticity (VARICH) approach to modelling the dynamical behaviour of turbidity over different locations and at different water depths. We use daily values of turbidity during the years 2017-2018 to fit the model. We show that the results of our fitted model are in line with the observed data and that the uncertainties, measured through Bayesian credible intervals, are well calibrated. Furthermore, we show that the daily effects of dredging and dumping on turbidity are negligible in comparison to that of wind speed.
Keywords: Bayesian; turbidity; vector autoregression.
© 2024 The Author(s). Published by Informa UK Limited, trading as Taylor & Francis Group.
Conflict of interest statement
No potential conflict of interest was reported by the author(s).
Figures


References
-
- Alola A.A., Uzuner G., and Akadiri S.S., Modeling tourism and fear nexus in g4 countries, Curr. Issues Tour. 24 (2021), pp. 1333–1339.
-
- Bever A.J., MacWilliams M.L., and Fullerton D.K., Influence of an observed decadal decline in wind speed on turbidity in the San Francisco estuary, Estuaries Coast. 41 (2018), pp. 1943–1967.
-
- Bollerslev T., Generalized autoregressive conditional heteroskedasticity, J. Econom. 31 (1986), pp. 307–327.
-
- Briciu-Burghina C., Sullivan T., Chapman J., and Regan F., Continuous high-frequency monitoring of estuarine water quality as a decision support tool: A Dublin port case study, Environ. Monit. Assess. 186 (2014), pp. 5561–5580. - PubMed
-
- Brooks S.P. and Gelman A., General methods for monitoring convergence of iterative simulations, J. Comput. Graph. Stat. 7 (1998), pp. 434–455.
LinkOut - more resources
Full Text Sources
